Native · Mac & Windows · Statistics & data visualization
Stratum brings descriptive statistics, 30+ publication-quality charts, full inferential testing, SPC control charts, and machine learning into one fast, native app — no notebooks, no scripting, no cloud.
Free 10-day trial · no credit card. One-time $119 to buy — no subscription.
Requires macOS 14 (Sonoma) or later, or Windows 10/11 (64-bit) · Built to handle datasets up to ~5 million rows. · All platforms & install help →
The power of a JMP or Minitab, without the subscription, the cloud, or the learning curve.
From $119, paid once — no subscription, ever. Start with a free 10-day trial.
100% offline. Your files, datasets, and results never leave your computer.
Swift on Mac, a native build on Windows — not Electron. Instant launch, up to ~5M rows.
Try every feature free for 10 days — no credit card, and no account to create.
From first import to final PDF, Stratum keeps you in flow — point, click, and read the result. No glue code between tools.
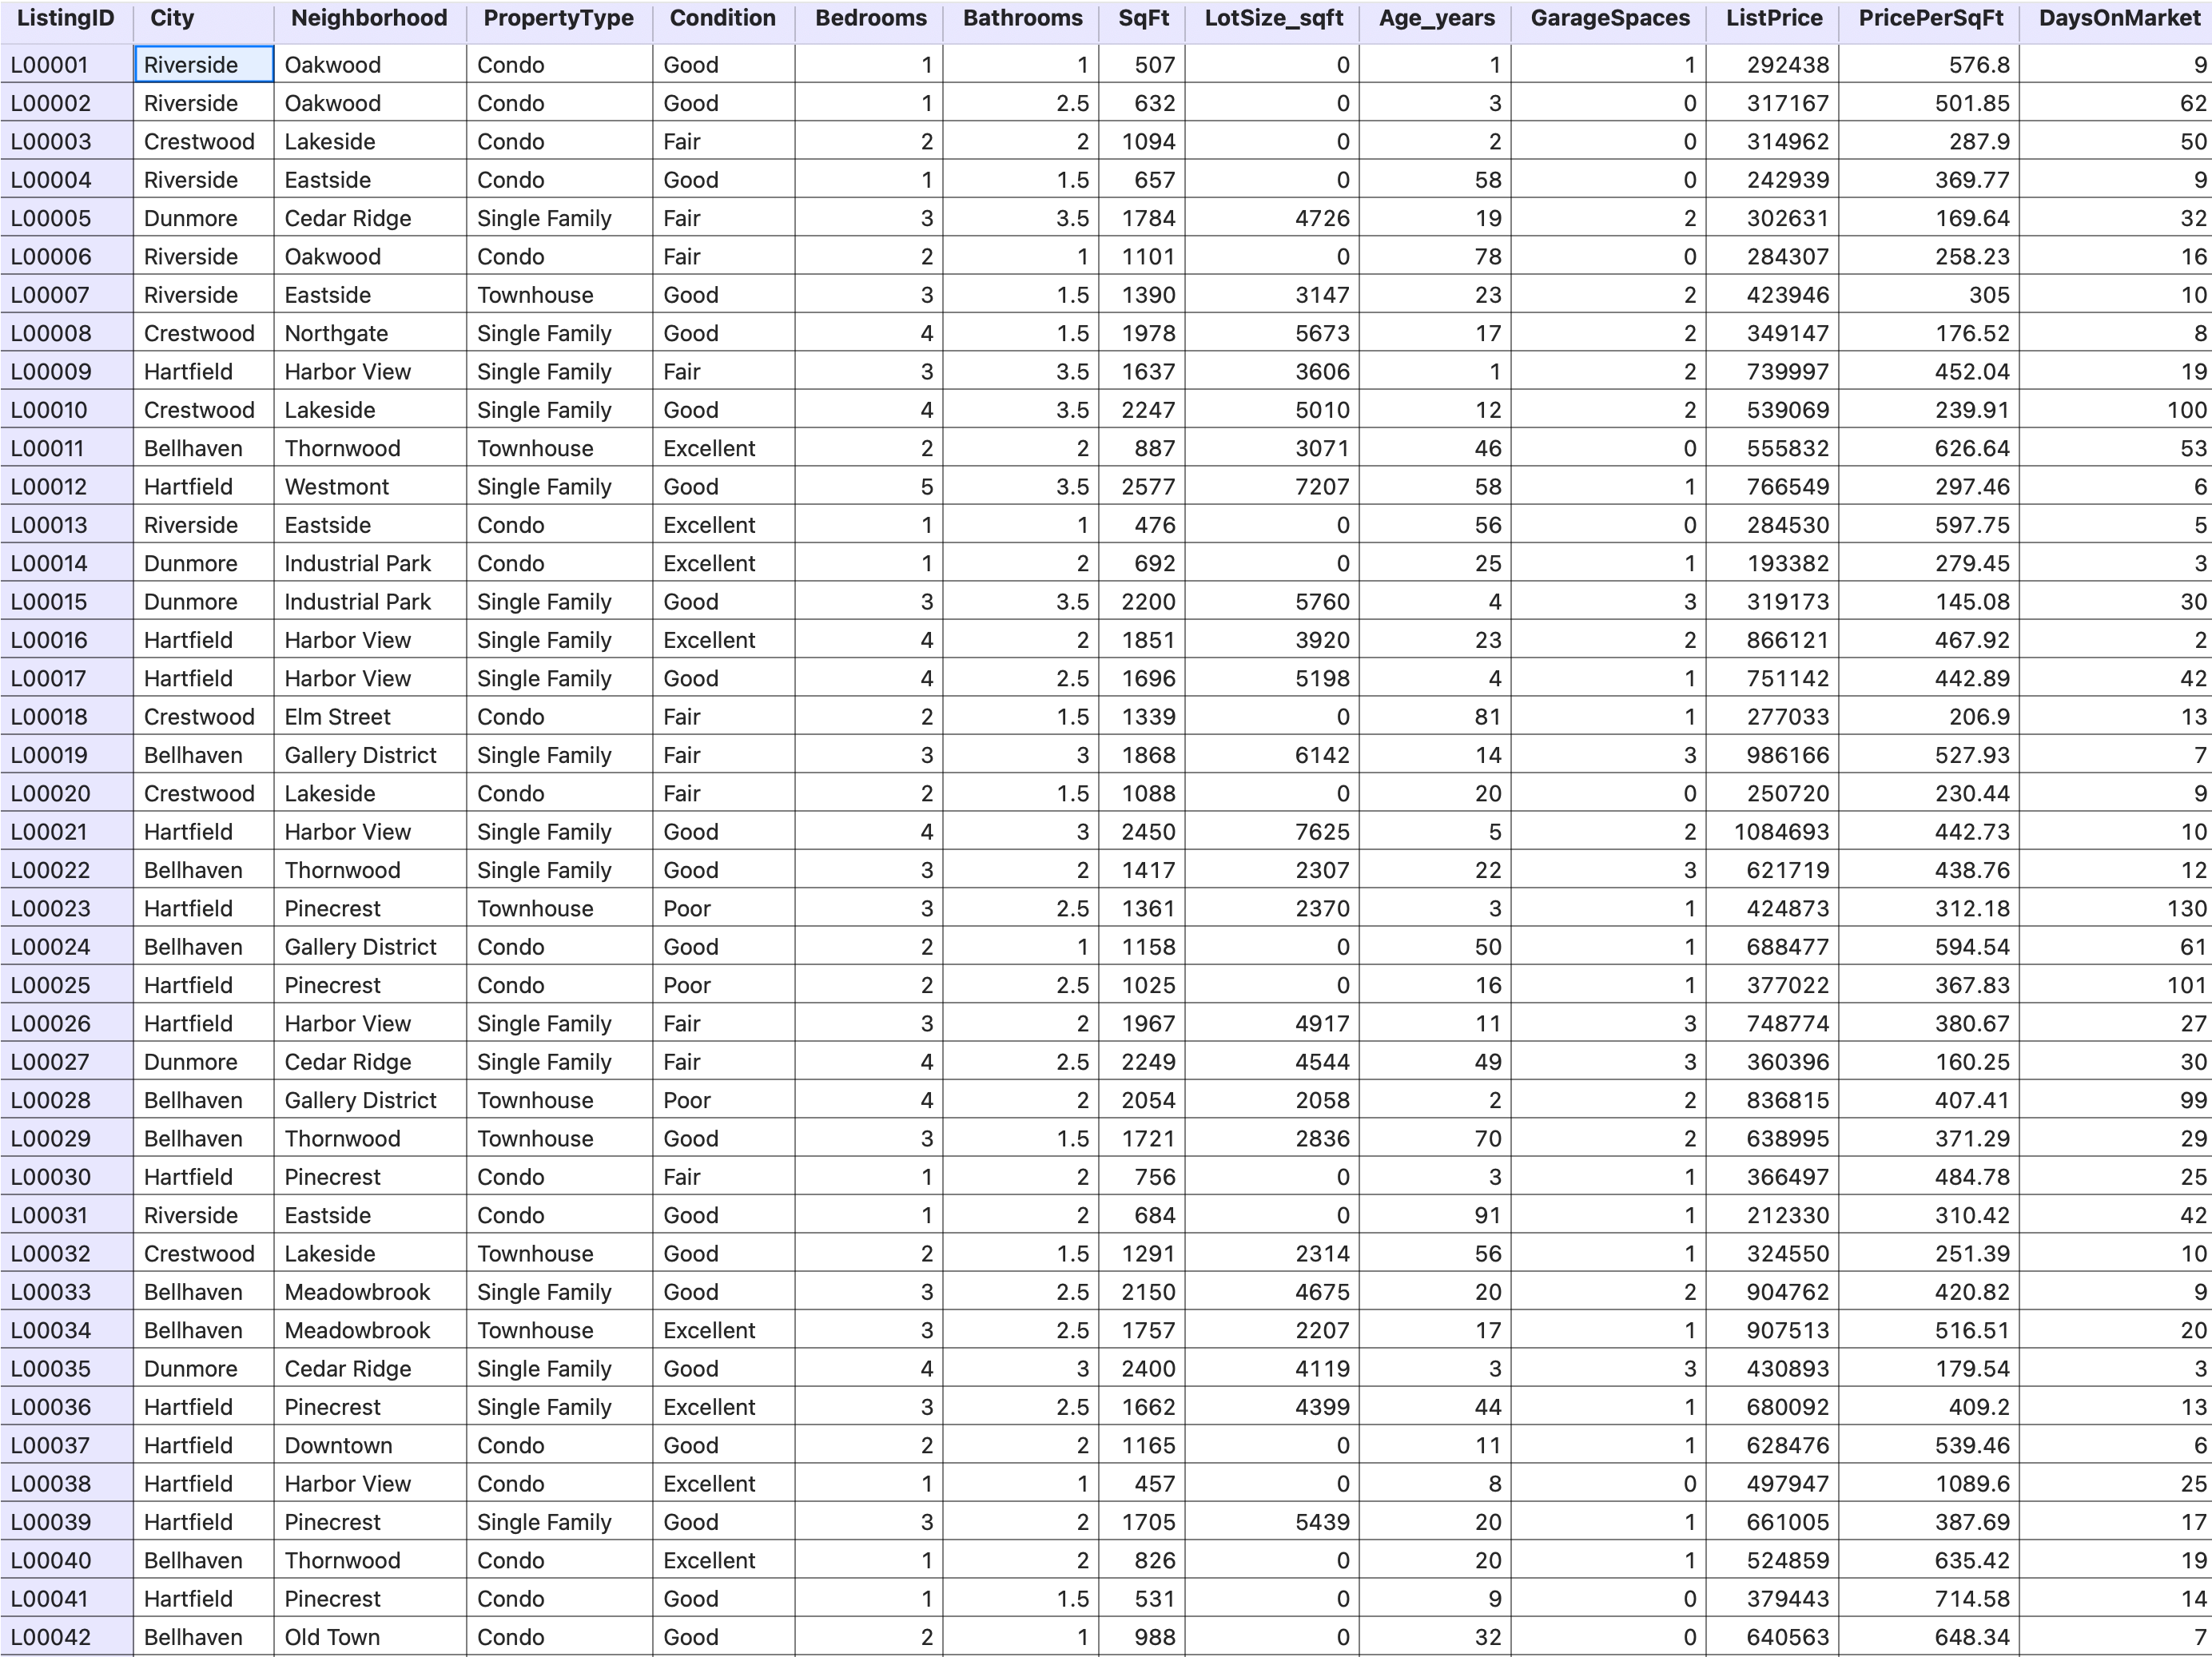
Drop in CSV, TSV, or Excel files. Stratum auto-detects delimiters and infers numeric vs. categorical columns, then opens straight into a fast, native data grid.
Re-editable formula columns with 100+ functions, a dockable filter inspector, and join / stack / aggregate / dedup / sample — all without leaving the app.
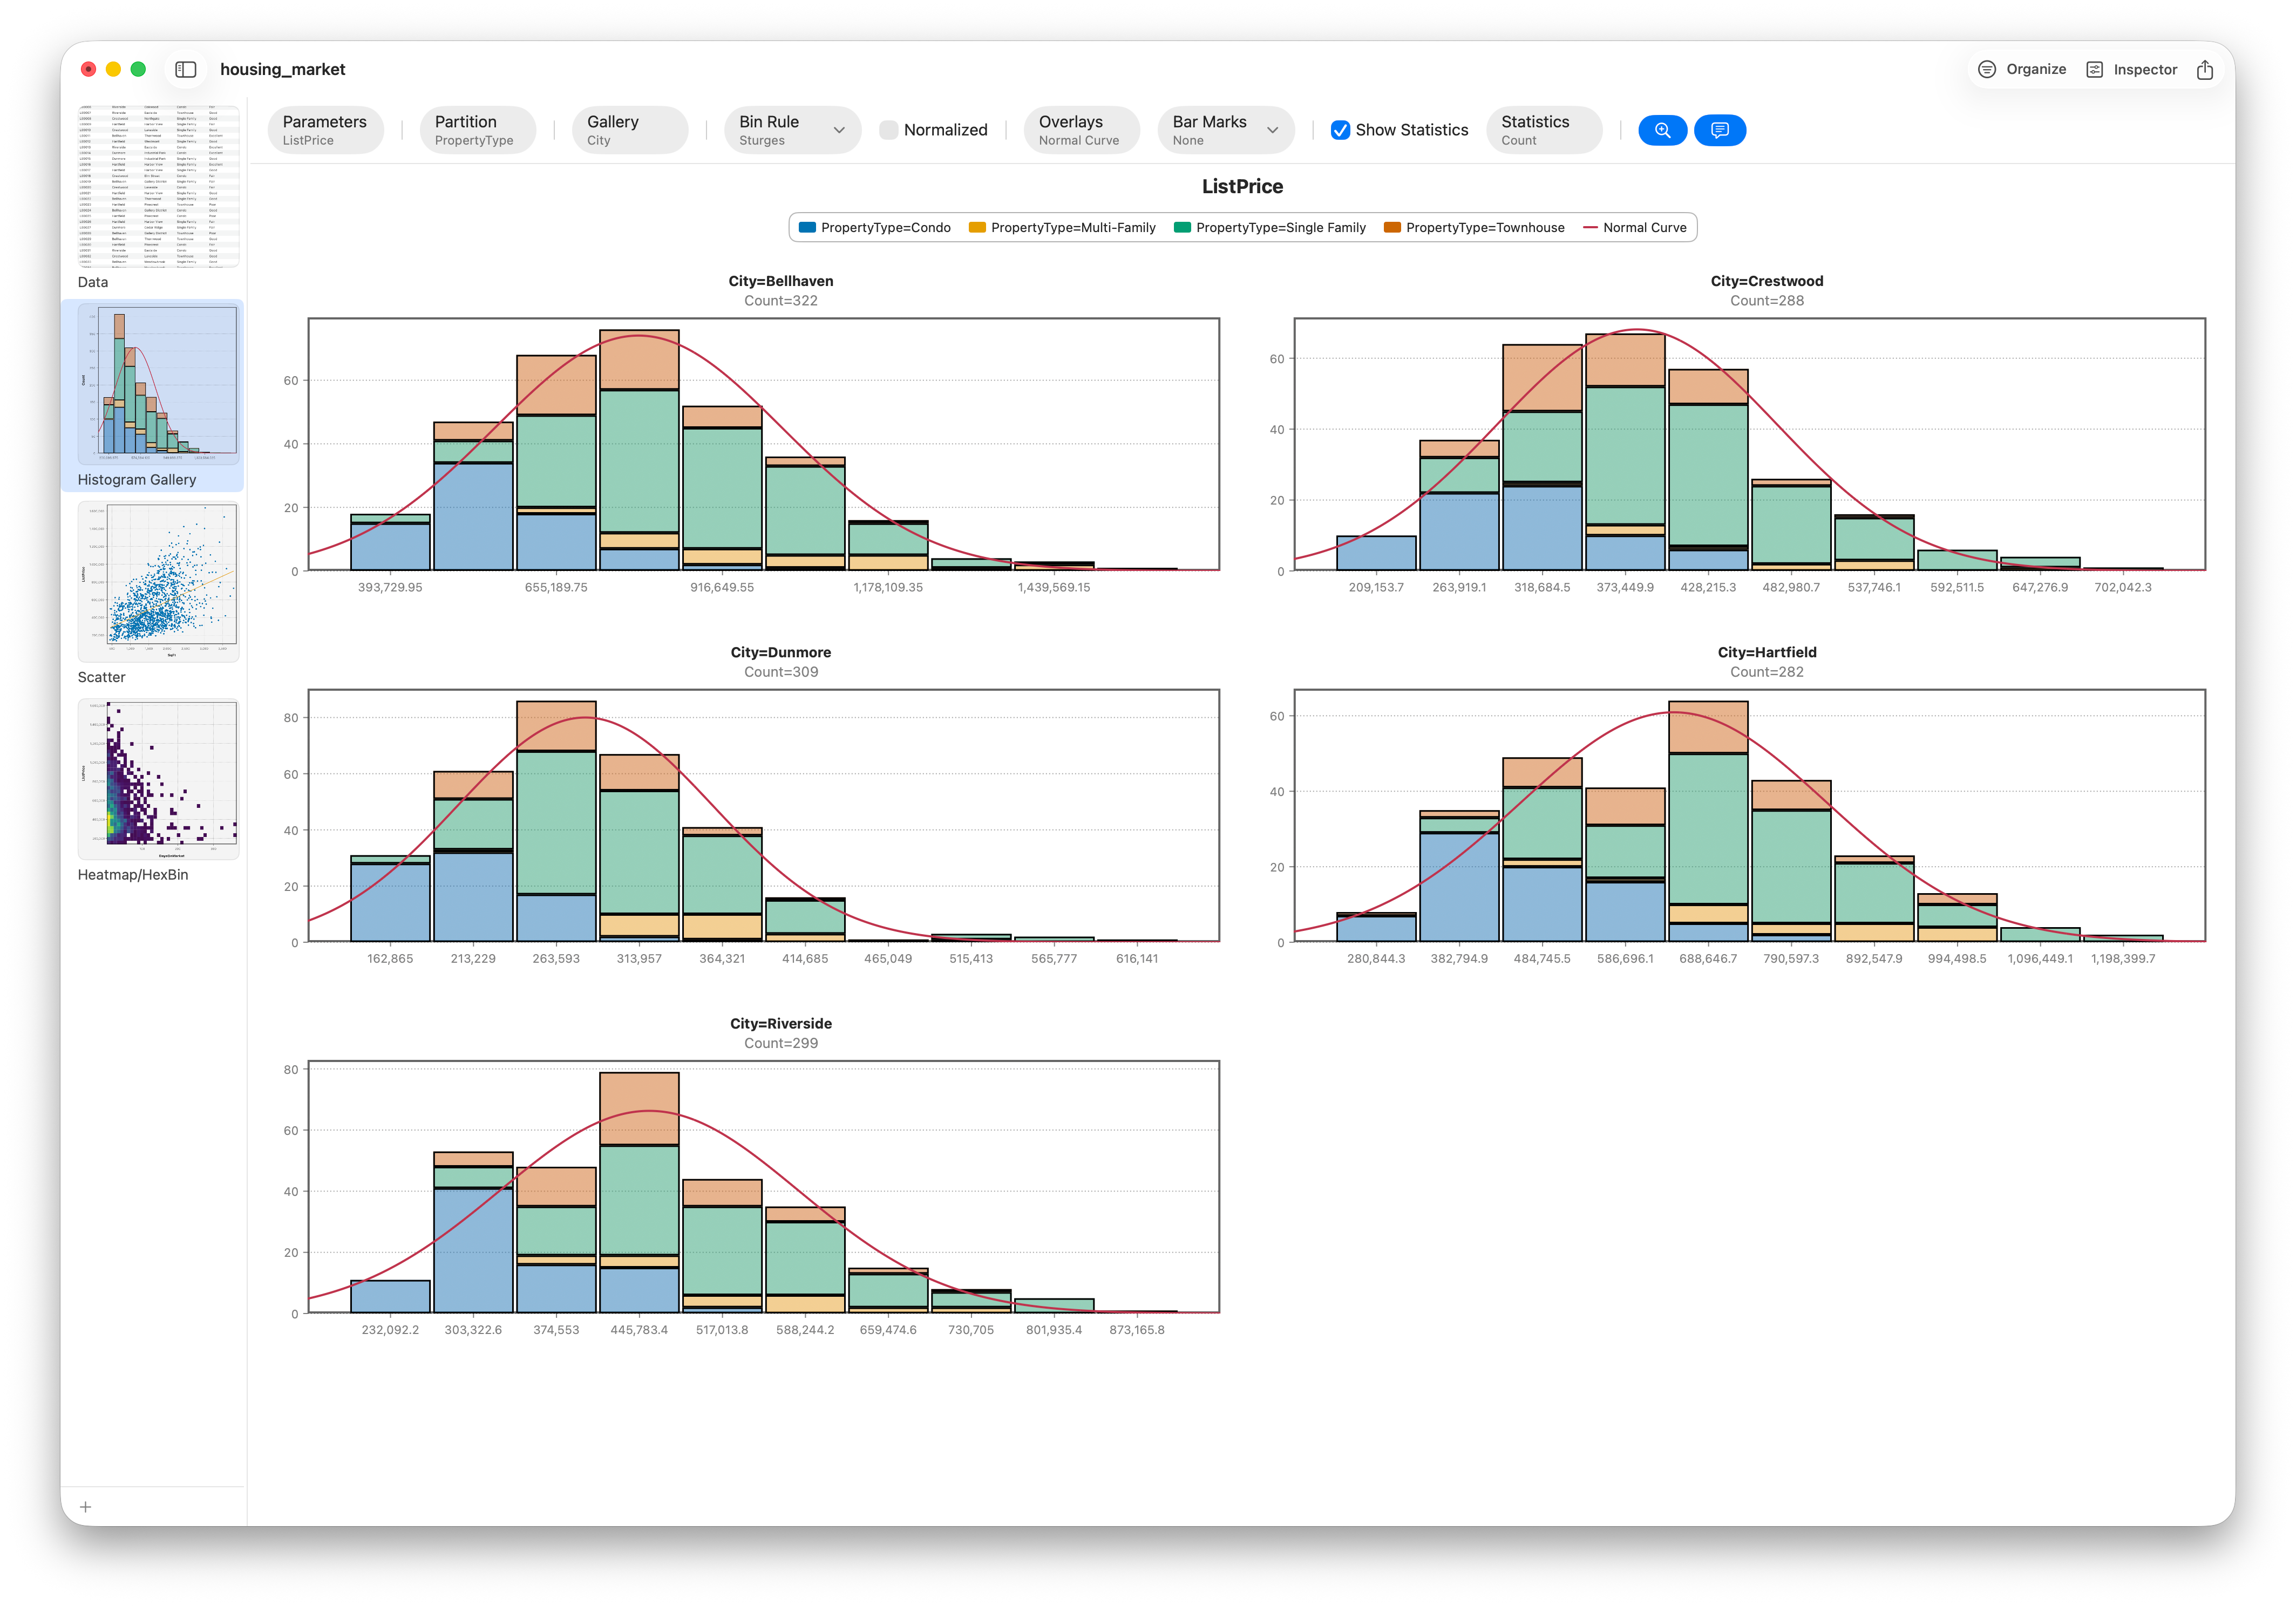
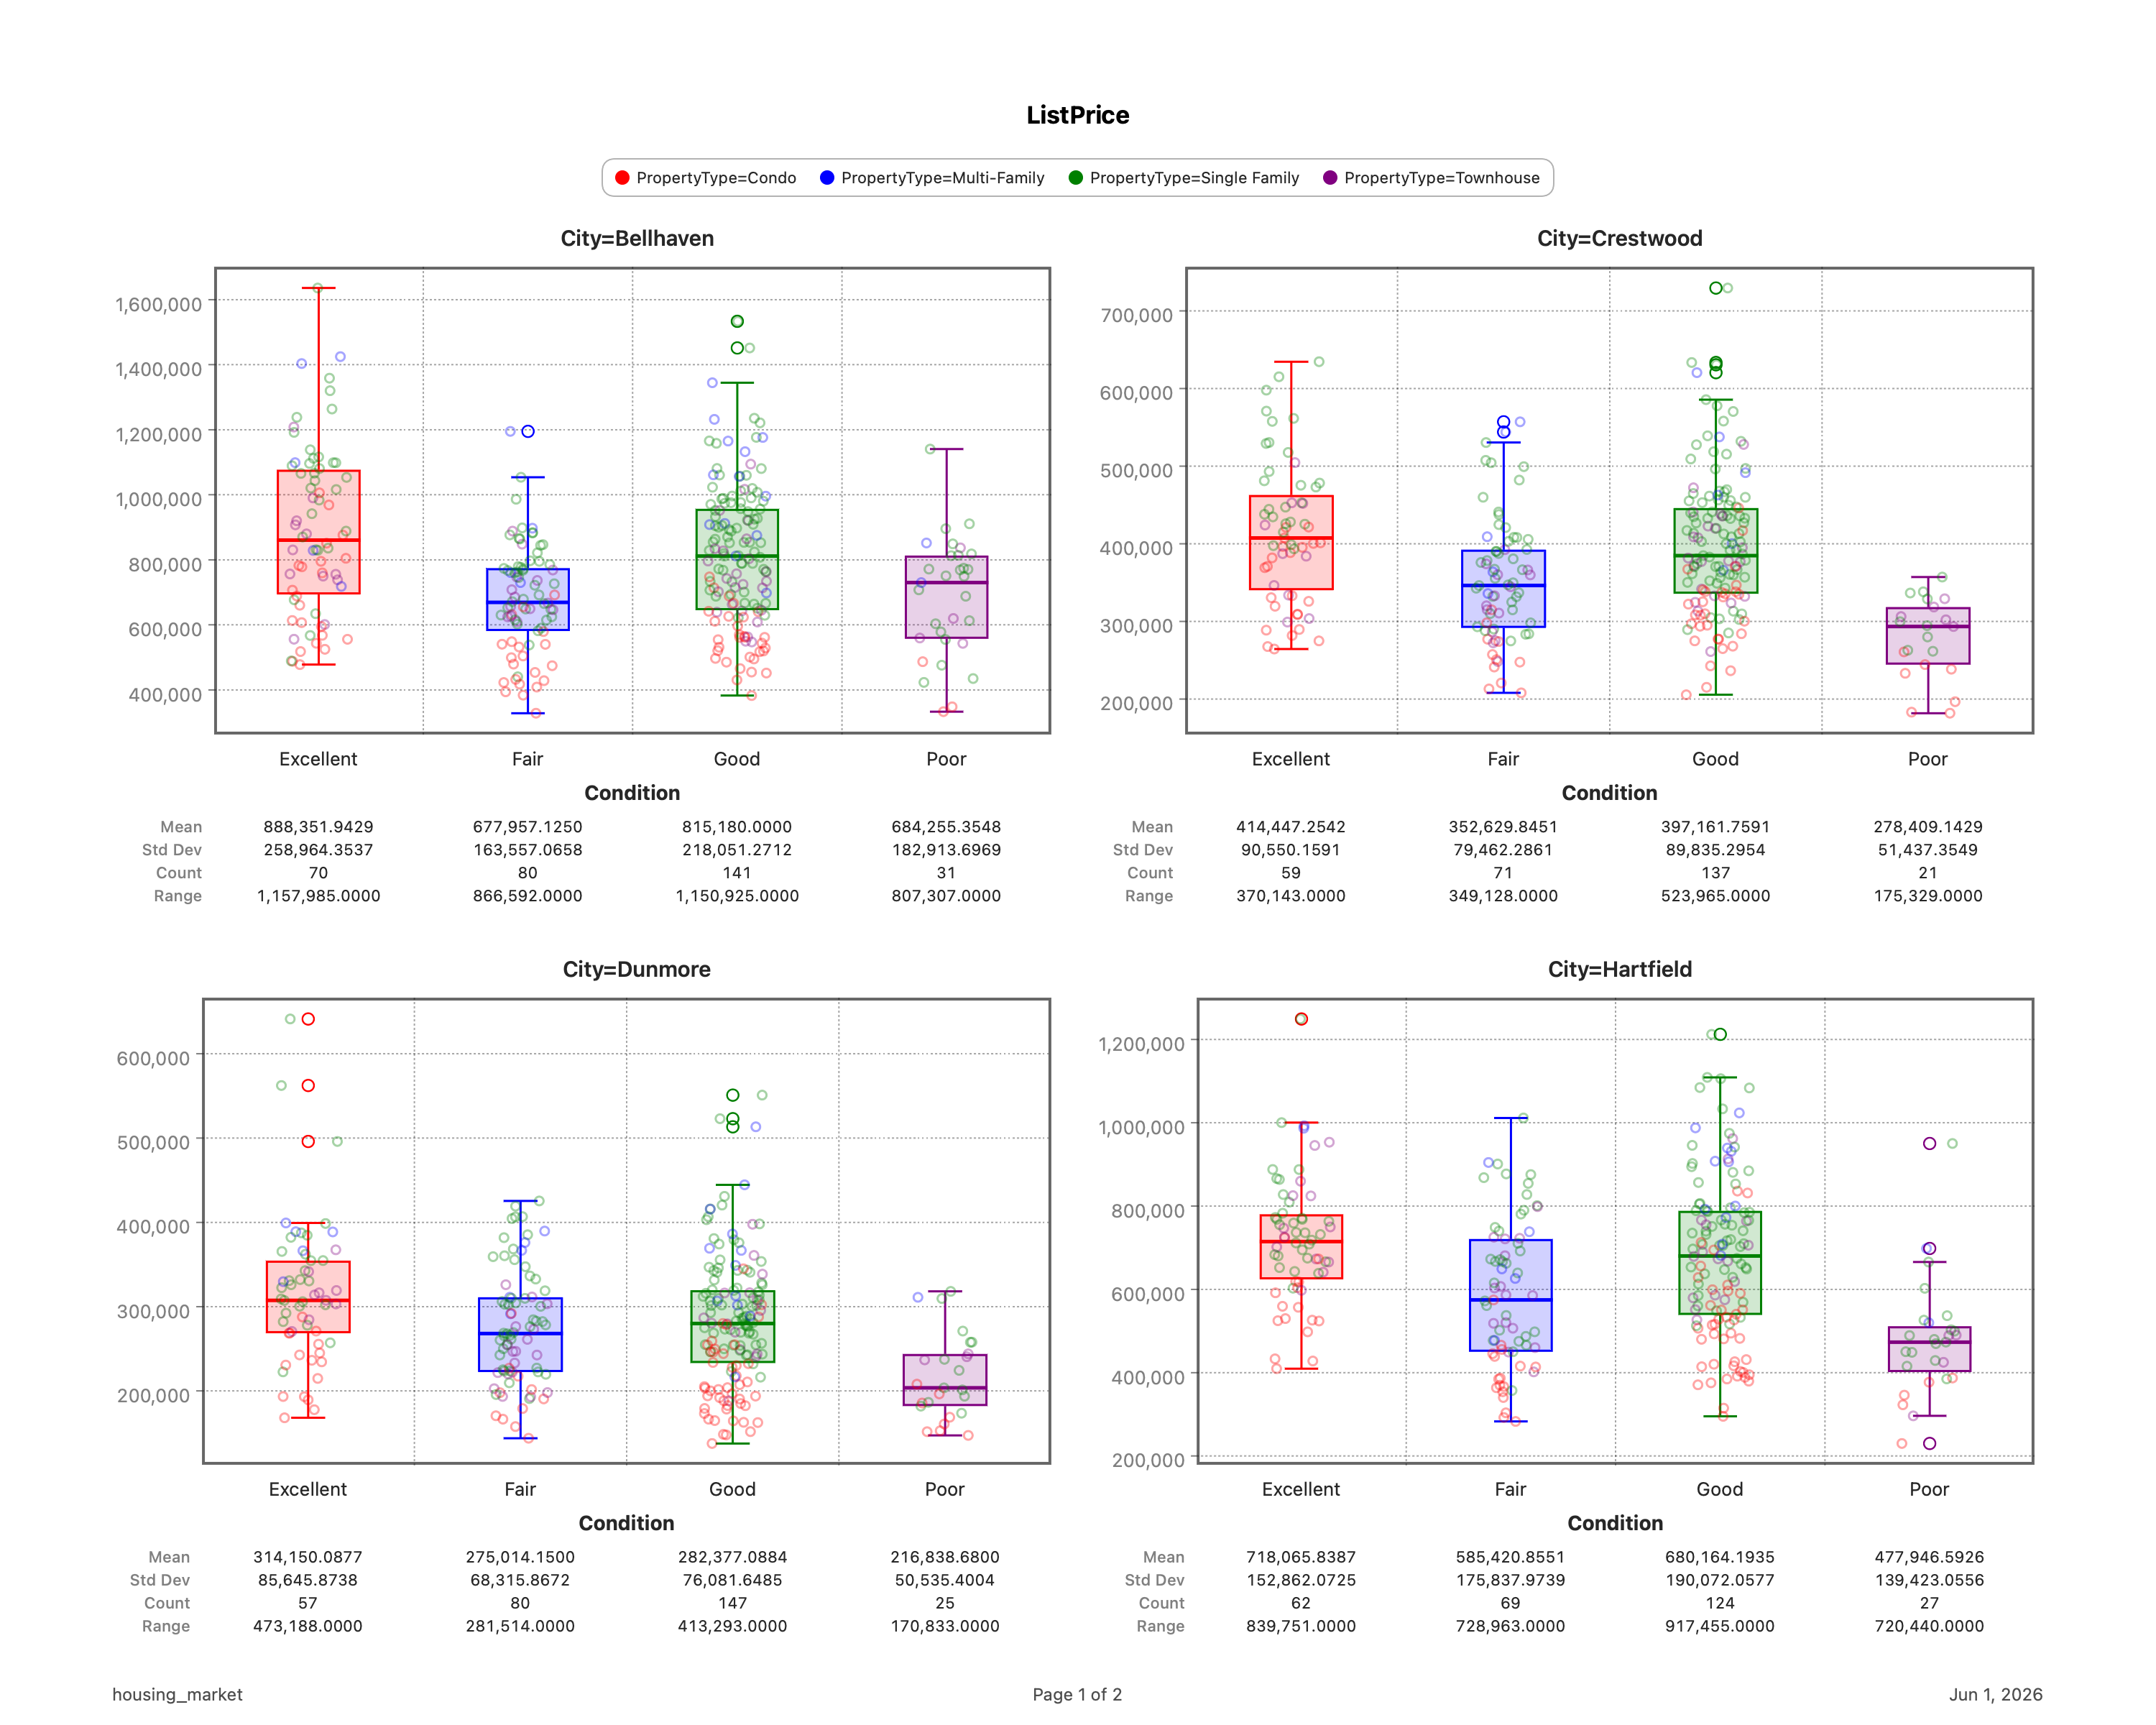
Histograms, box & violin plots, scatter, treemaps, contour, dumbbell, Pareto, mosaic and more — each with live controls and one-click PNG / PDF export.
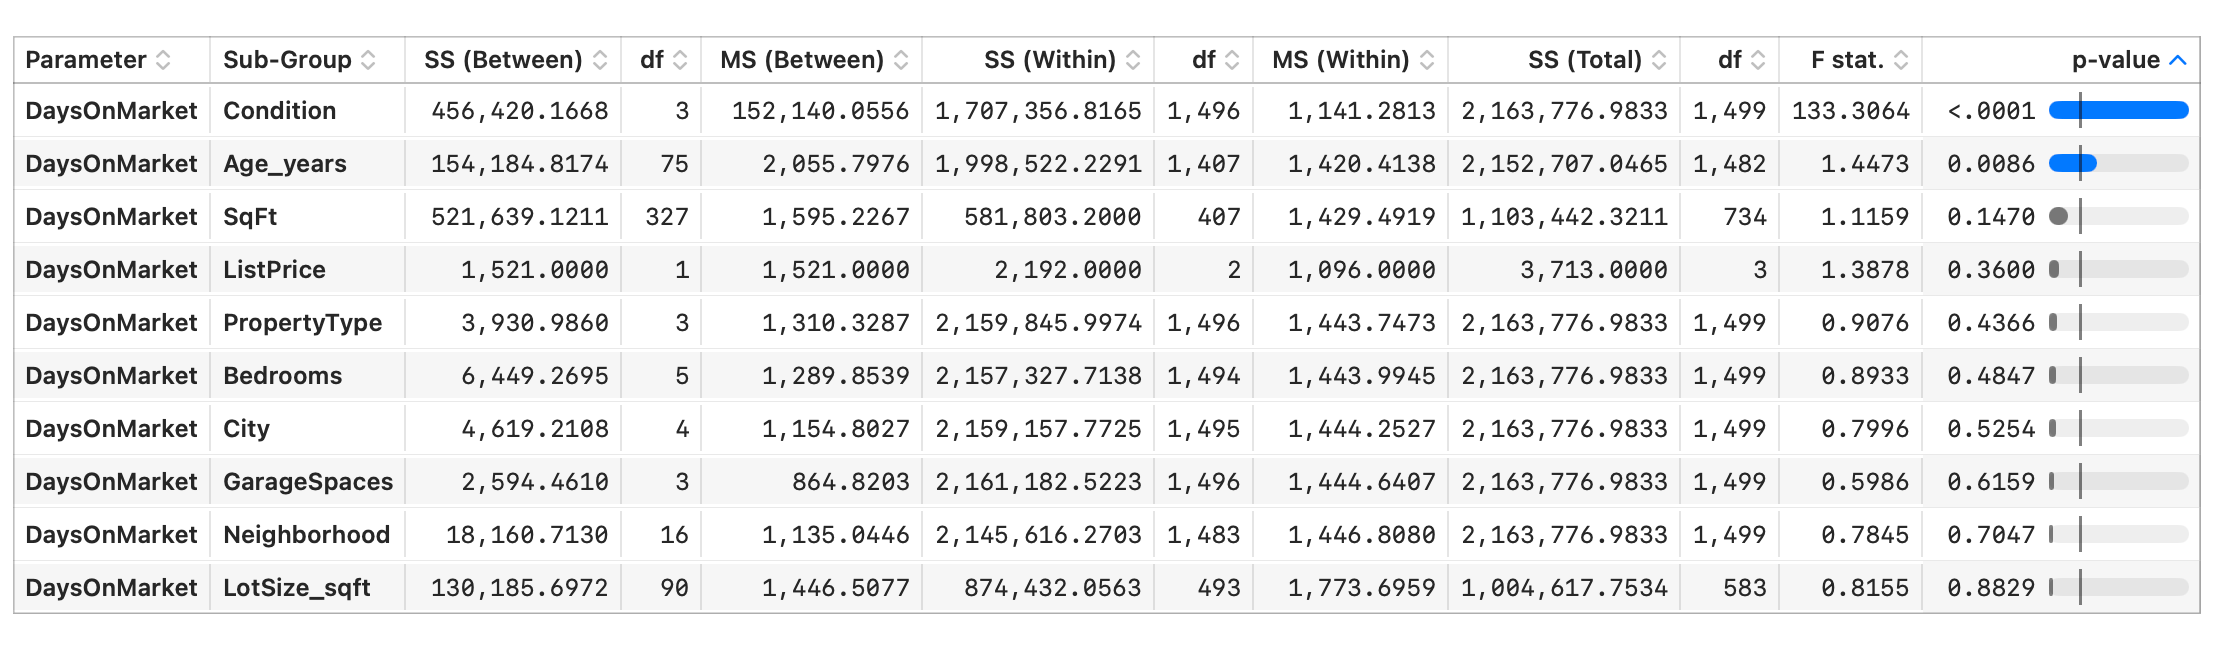
ANOVA, MANOVA, correlation, two-sample and contingency tests, plus linear regression with full diagnostics — with parametric and nonparametric options.
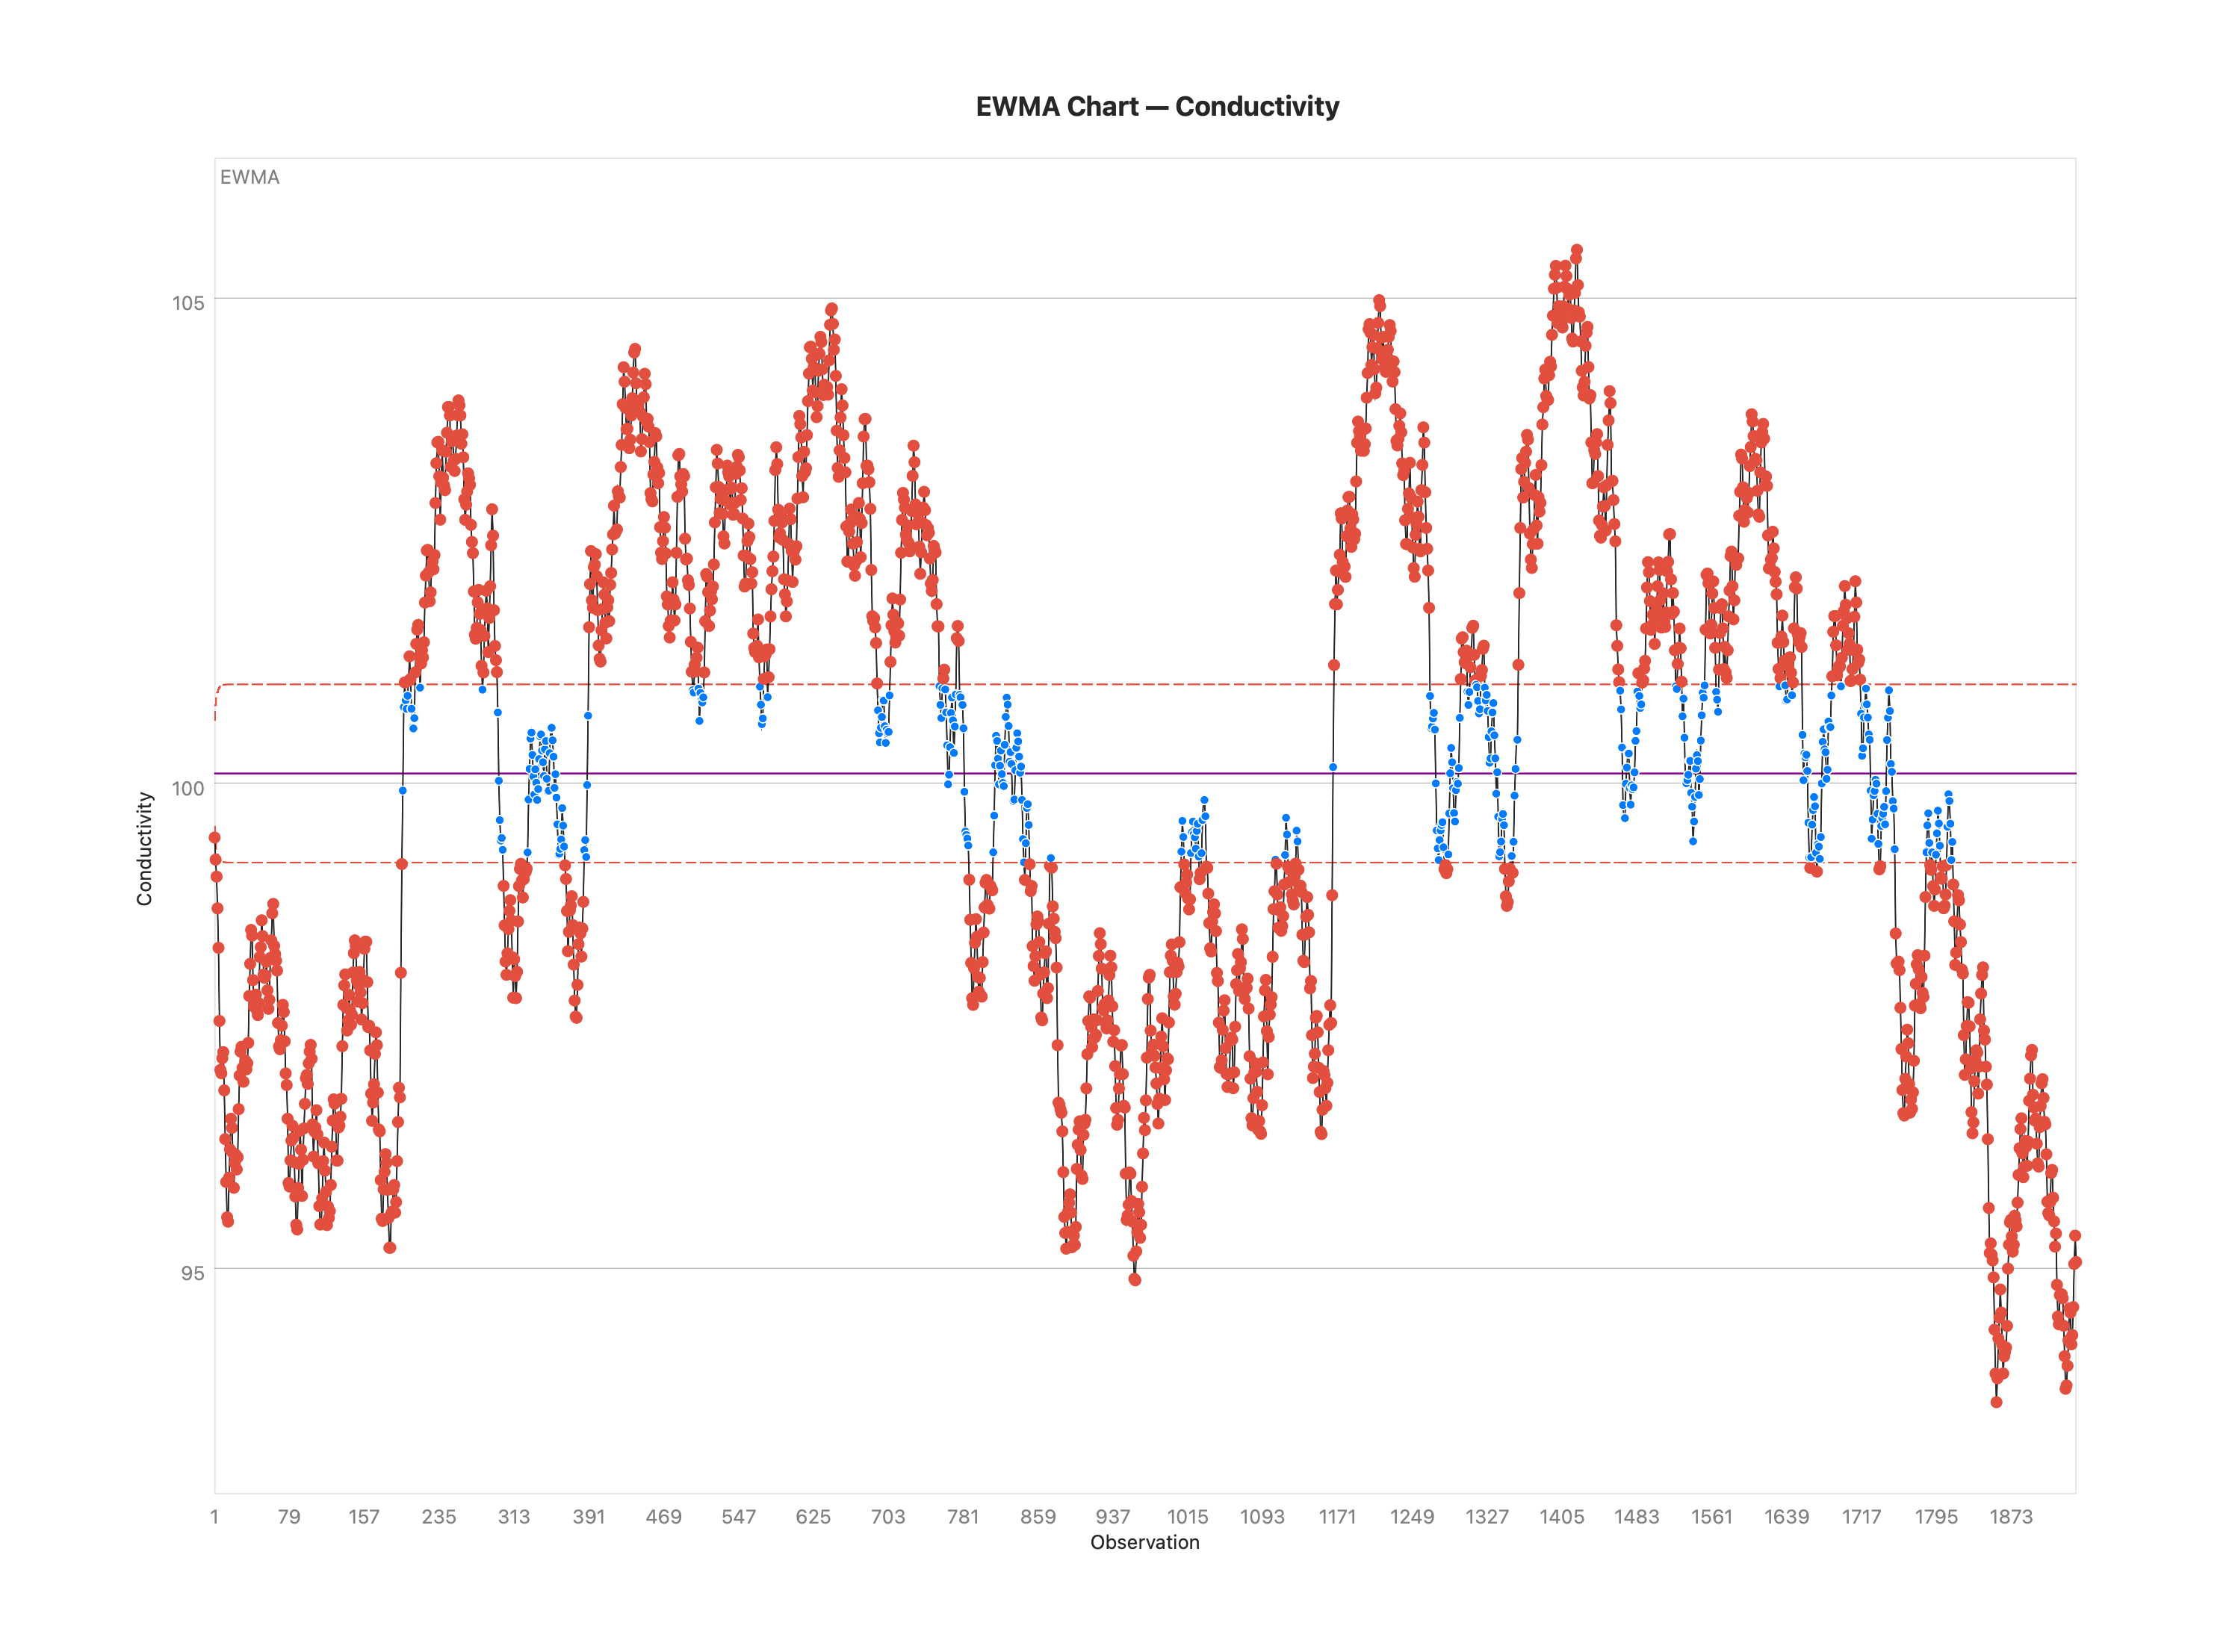
I-MR, X-bar R/S, p/np, c/u, CUSUM and EWMA charts with all eight Nelson rules built in — quality engineering, ready out of the box.
PCA, K-means & hierarchical clustering, decision trees, random forests and boosted trees — pure-Swift, fast, and right next to your data.
The things that matter when your data — and your audience — grow.
A virtualized grid and lazy filtering keep Stratum responsive on datasets up to ~5 million rows.
Scale the entire interface text size for readability, with independent controls for the data grid and reports.
The native .stratum format saves data, analyses, filters and styling together — reopen exactly where you left off.
From a fast data grid to publication-ready charts, reports, control charts and models — here's what the work looks like.
The Stratum Tutorial walks through every major capability with a real dataset, the exact clicks to reproduce it, and the statistics behind the result. The blog adds fresh how-tos, worked examples, and statistics explainers — new posts every week.
Open to everyone — no download required. Look something up, run a quick calculation, or grab a dataset to practice on.

Plain-language definitions, formulas, and how-to-read guidance for the terms you actually use.

P-value, sample size, and effect size — exact answers, right in your browser.

Clean, documented, openly-licensed CSVs to learn and demo with.
 Stratum