 Stratum
What's New in Stratum 1.3
The biggest update since launch, and it lands squarely on the modelling side: polynomial terms you can actually interpret, a rebuilt regression solver checked against the NIST reference datasets, coefficient intervals and Effect Tests, ANOVA that finally reports its means and effect sizes, Type III sums of squares, and reports you can reshape to fit wherever they're going.
Stratum 1.3 is out now. If Stratum is already installed, Stratum ▸ Check for Updates… will offer it; new users get it in the current download. It's a bigger release than 1.1 or 1.2 — most of it aimed at the two analyses people spend the most time in, regression and ANOVA. Here's the tour.
Regression
Fit a curve as a single term, in a basis you can read
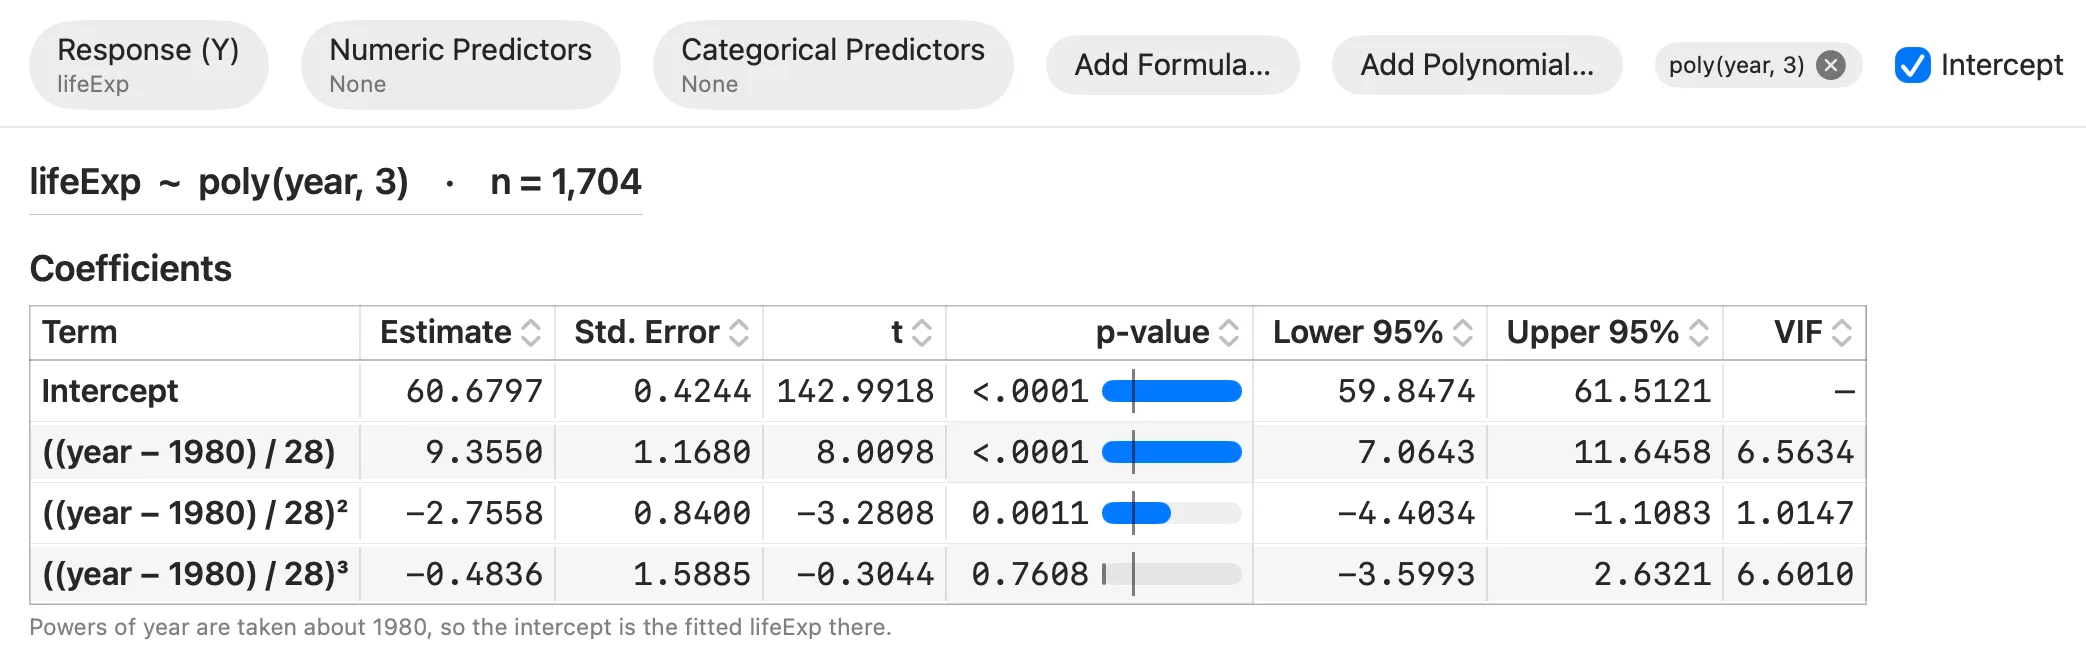
A new Add Polynomial… control fits one column to any degree from 2 to 10 as one term rather than a pile of separate predictors. That matters for the questions built on top of it: Effect Tests can now answer "is a cubic needed here?" in one line, and Best Subsets weighs the whole curve as a single candidate instead of shuffling its powers independently.
You also choose the basis, because the basis is what you end up reading. Centered powers — the default — let you read slope and curvature at the centre of your data, and each row spells out its own substitution, so you see ((year − 1980) / 28)³ rather than an unlabelled cubic term. Orthogonal polynomials give degree-by-degree t-tests the way R's poly() does. Raw powers are there for the cases where raw powers are what you want. Predict… understands polynomial models and expands the degrees for you.
A more accurate solver, checked against the NIST benchmarks
Coefficients, standard errors, leverage and prediction intervals now come from one direct fit rather than a squared-up shortcut — a change with no user-visible control, and a large effect on the hard cases. On the certified NIST Statistical Reference Datasets, results that used to agree to about 6 digits now agree to 14 or more, and the hardest set in the collection fits where it previously returned nothing at all. Speed is unchanged.
If you want to see what's checked against what, our validation record lists every statistic Stratum computes and the reference it's verified against.
Coefficient intervals, a reference level, and Effect Tests
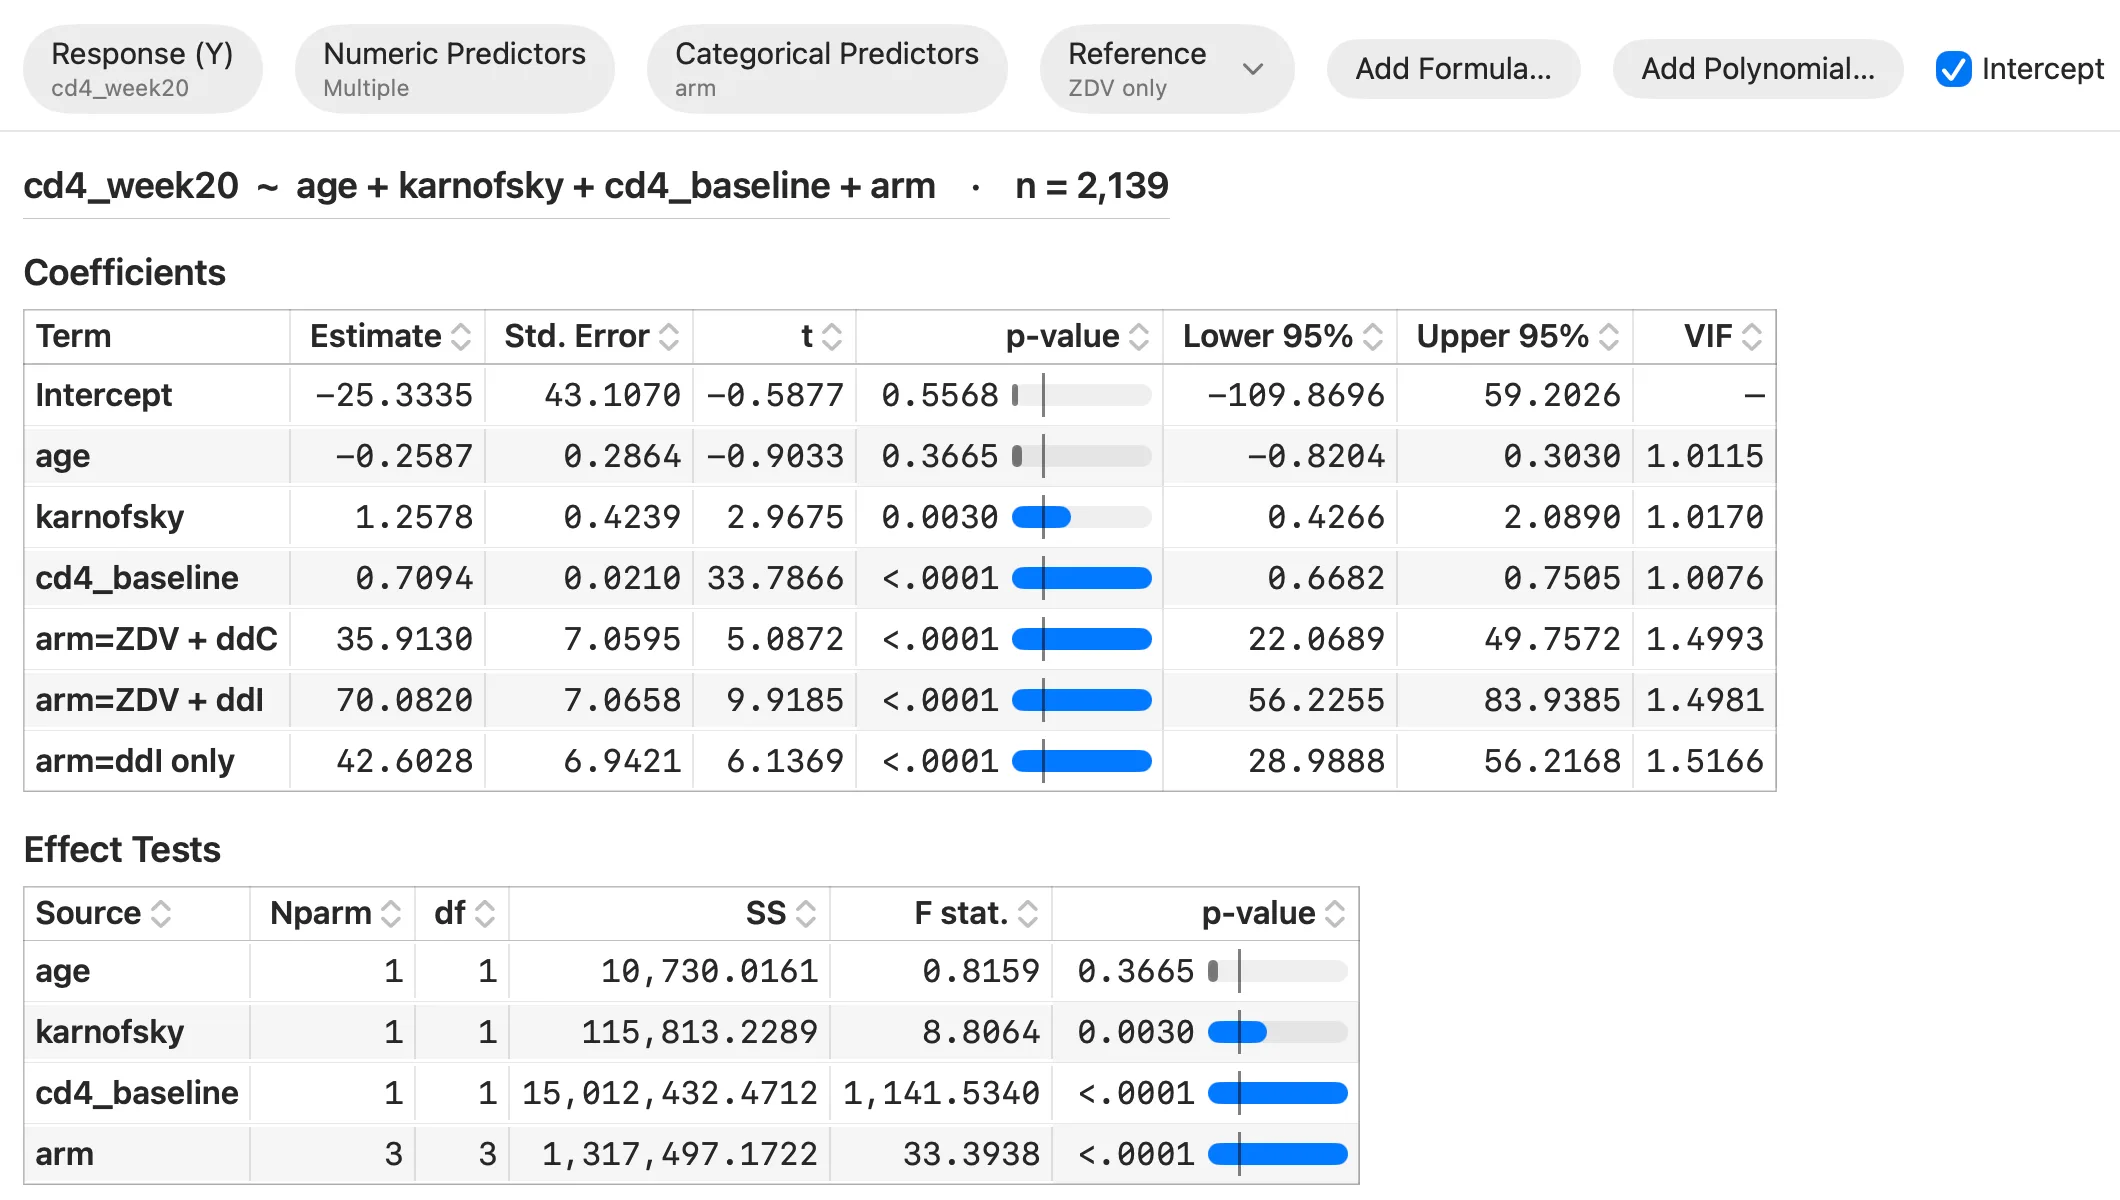
Three things regression tables were missing. Lower and upper bounds now sit beside every estimate at 90 / 95 / 99 / 99.9% or a level you set yourself. A Reference picker sets which level of a categorical predictor the others are compared against — a standard-of-care arm, say, rather than whichever category happens to sort first — the same job as R's relevel() or an SPSS reference category. And a new Effect Tests section reports Source, Nparm, df, sum of squares, F and p for each term: the single test of whether a multi-level factor matters at all, the way JMP and SPSS give it to you.
New to reading these tables? Start with How to Run a Linear Regression.
ANOVA
The reports carry their means — and their effect sizes
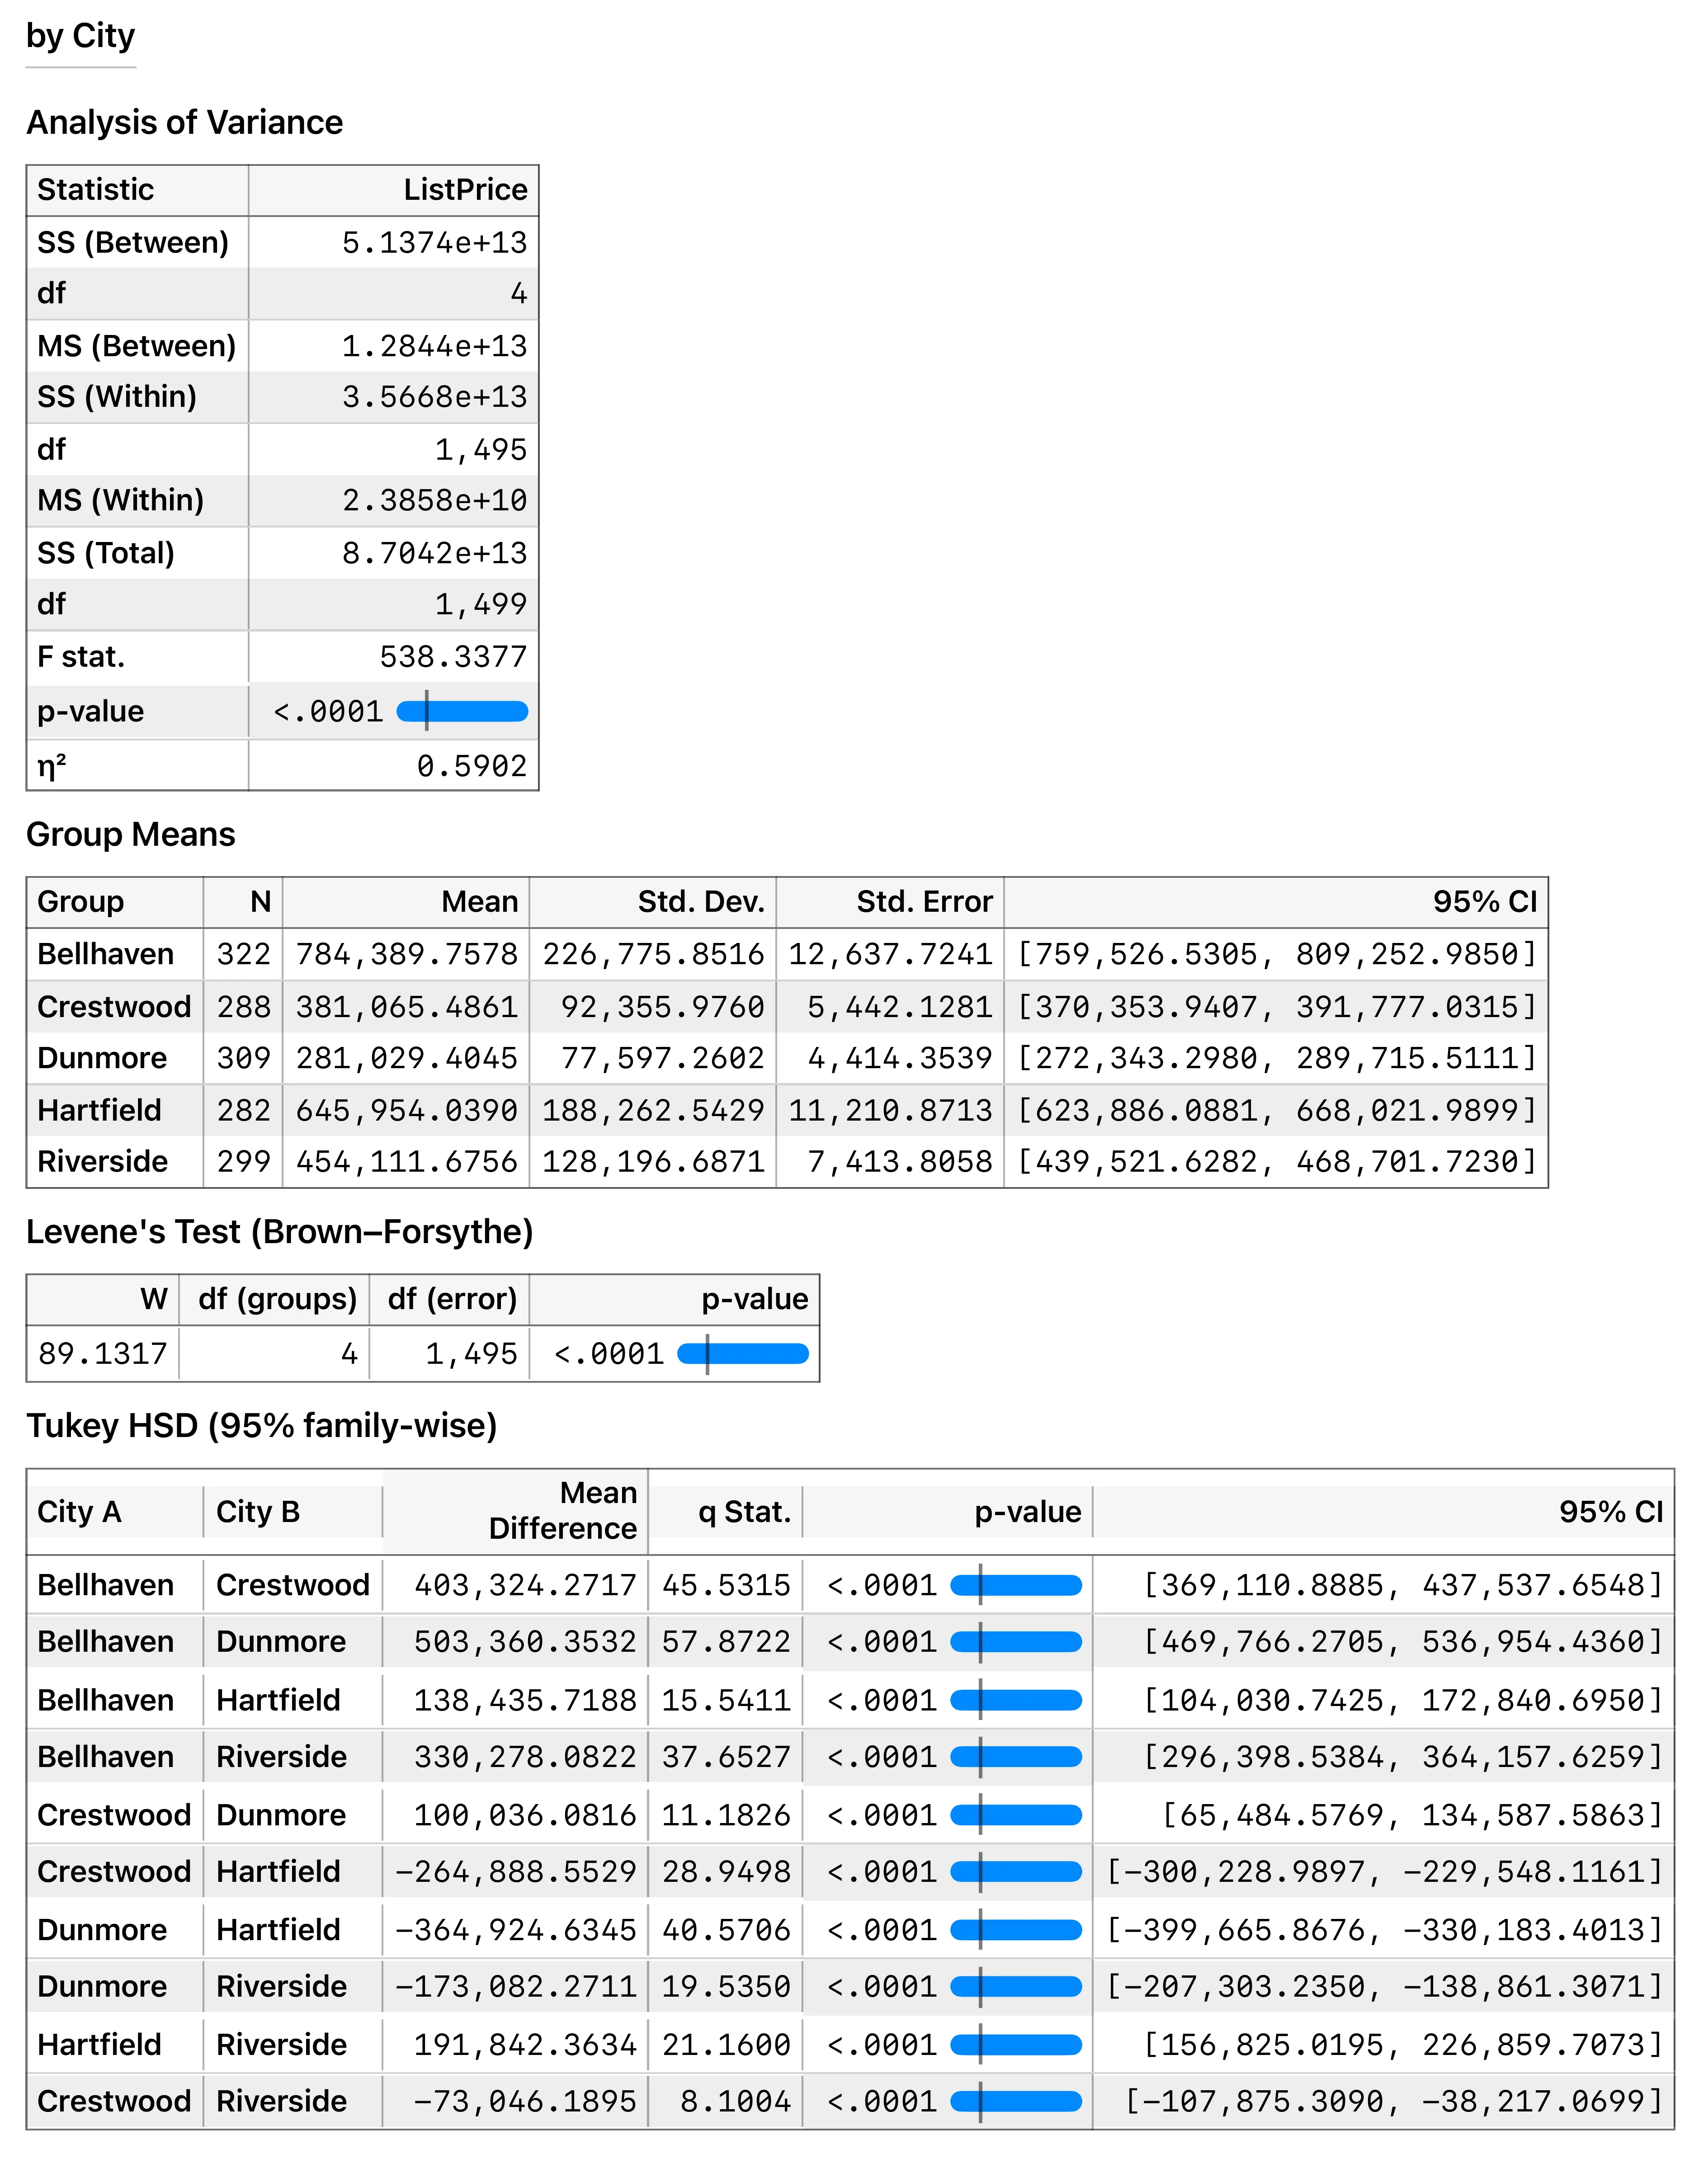
One-Way ANOVA gains a per-group means table (count, mean, SD, standard error, 95% CI), and Two-Way ANOVA a Cell & Marginal Means table covering every A×B cell plus each factor's marginals. You can read which combination is high or low without leaving for a chart. The marginals are least-squares means, as SPSS EMMEANS and JMP report them.
Alongside them, a new Effect Sizes control puts η², ω² and ε² beside the p-value on One-Way ANOVA, partial η² per effect on Two-Way, and partial η² from Wilks' Λ on MANOVA. They're computed from whichever sums of squares the table is currently showing, and they survive switching on Robust Procedure. Your choice is saved with the document and carried into Copy, Export and the printed report.
Levene's test and Tukey HSD are checkboxes now
Both used to be something you went and asked for. Tick either on the One-Way ANOVA bar and it becomes a table stacked beneath the test, covering every response, sub-group and by-variable slice the report holds — sorting, hiding and reordering like any other section, saved with the document, and riding along in Copy, Export, PDF and print without being asked again. Levene's keeps its Center choice (median-centred Brown–Forsythe or the mean-centred original); Tukey's Confidence level is adjustable at 90 / 95 / 99%. If you're new to why these two belong together, ANOVA assumptions covers the ground.
Two-Way ANOVA: choose your sums of squares
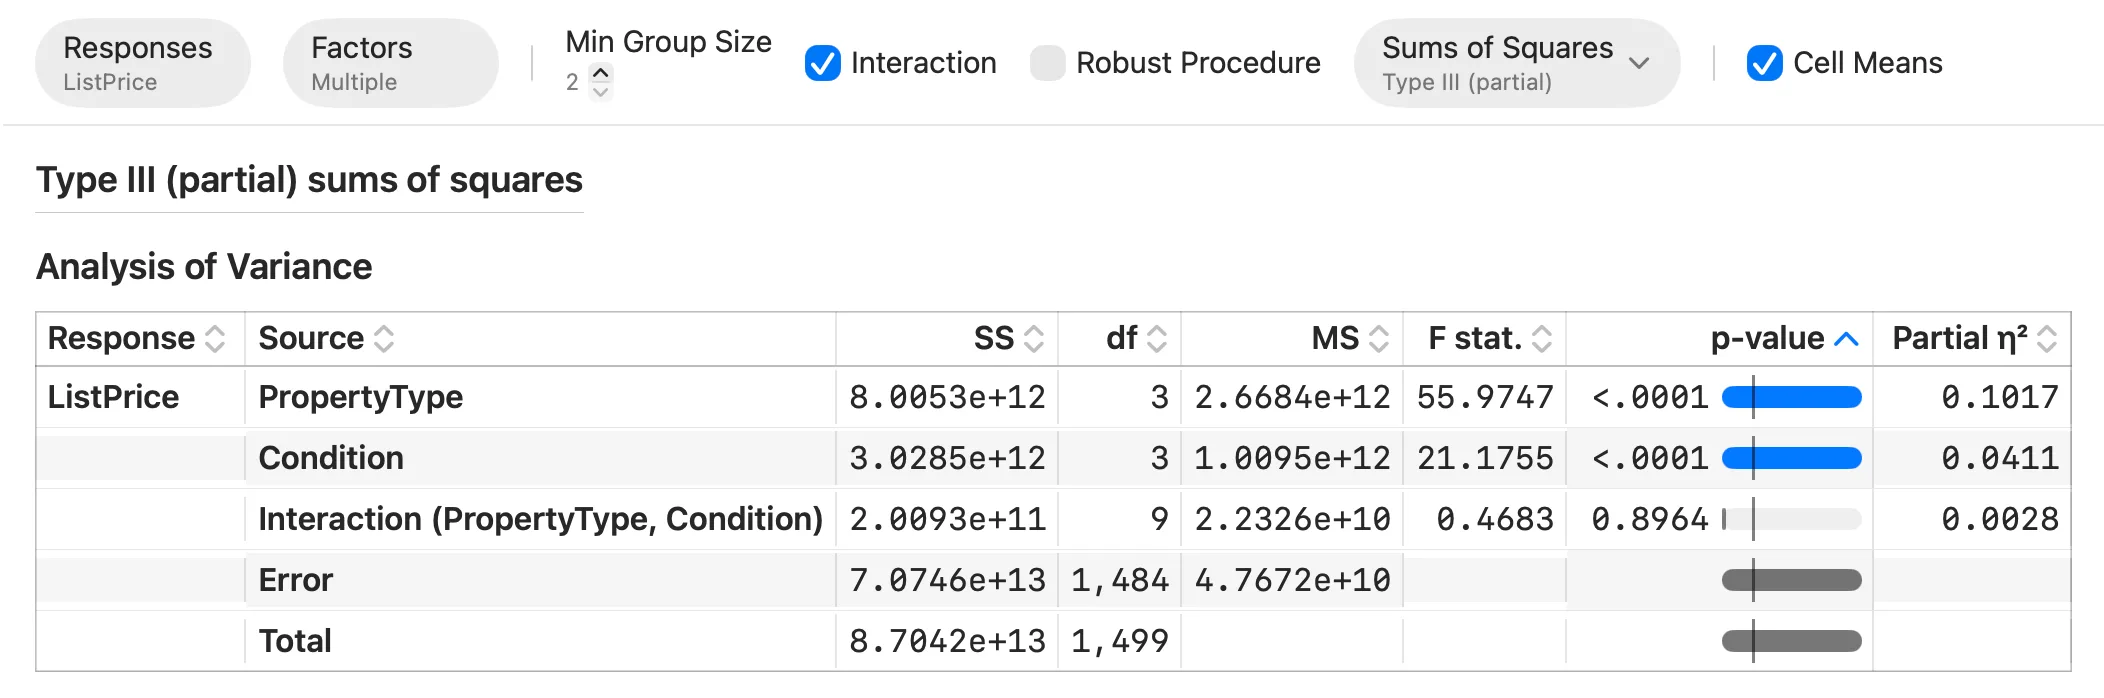
Type III is now the default — the SPSS and JMP convention, and car::Anova(type = 3) in R — with Type I (sequential) available from the new Sums of Squares control. With unbalanced cells the two disagree, sometimes sharply, so the report names the convention it used in a heading above the table.
Process Capability, correlation, and contingency tables
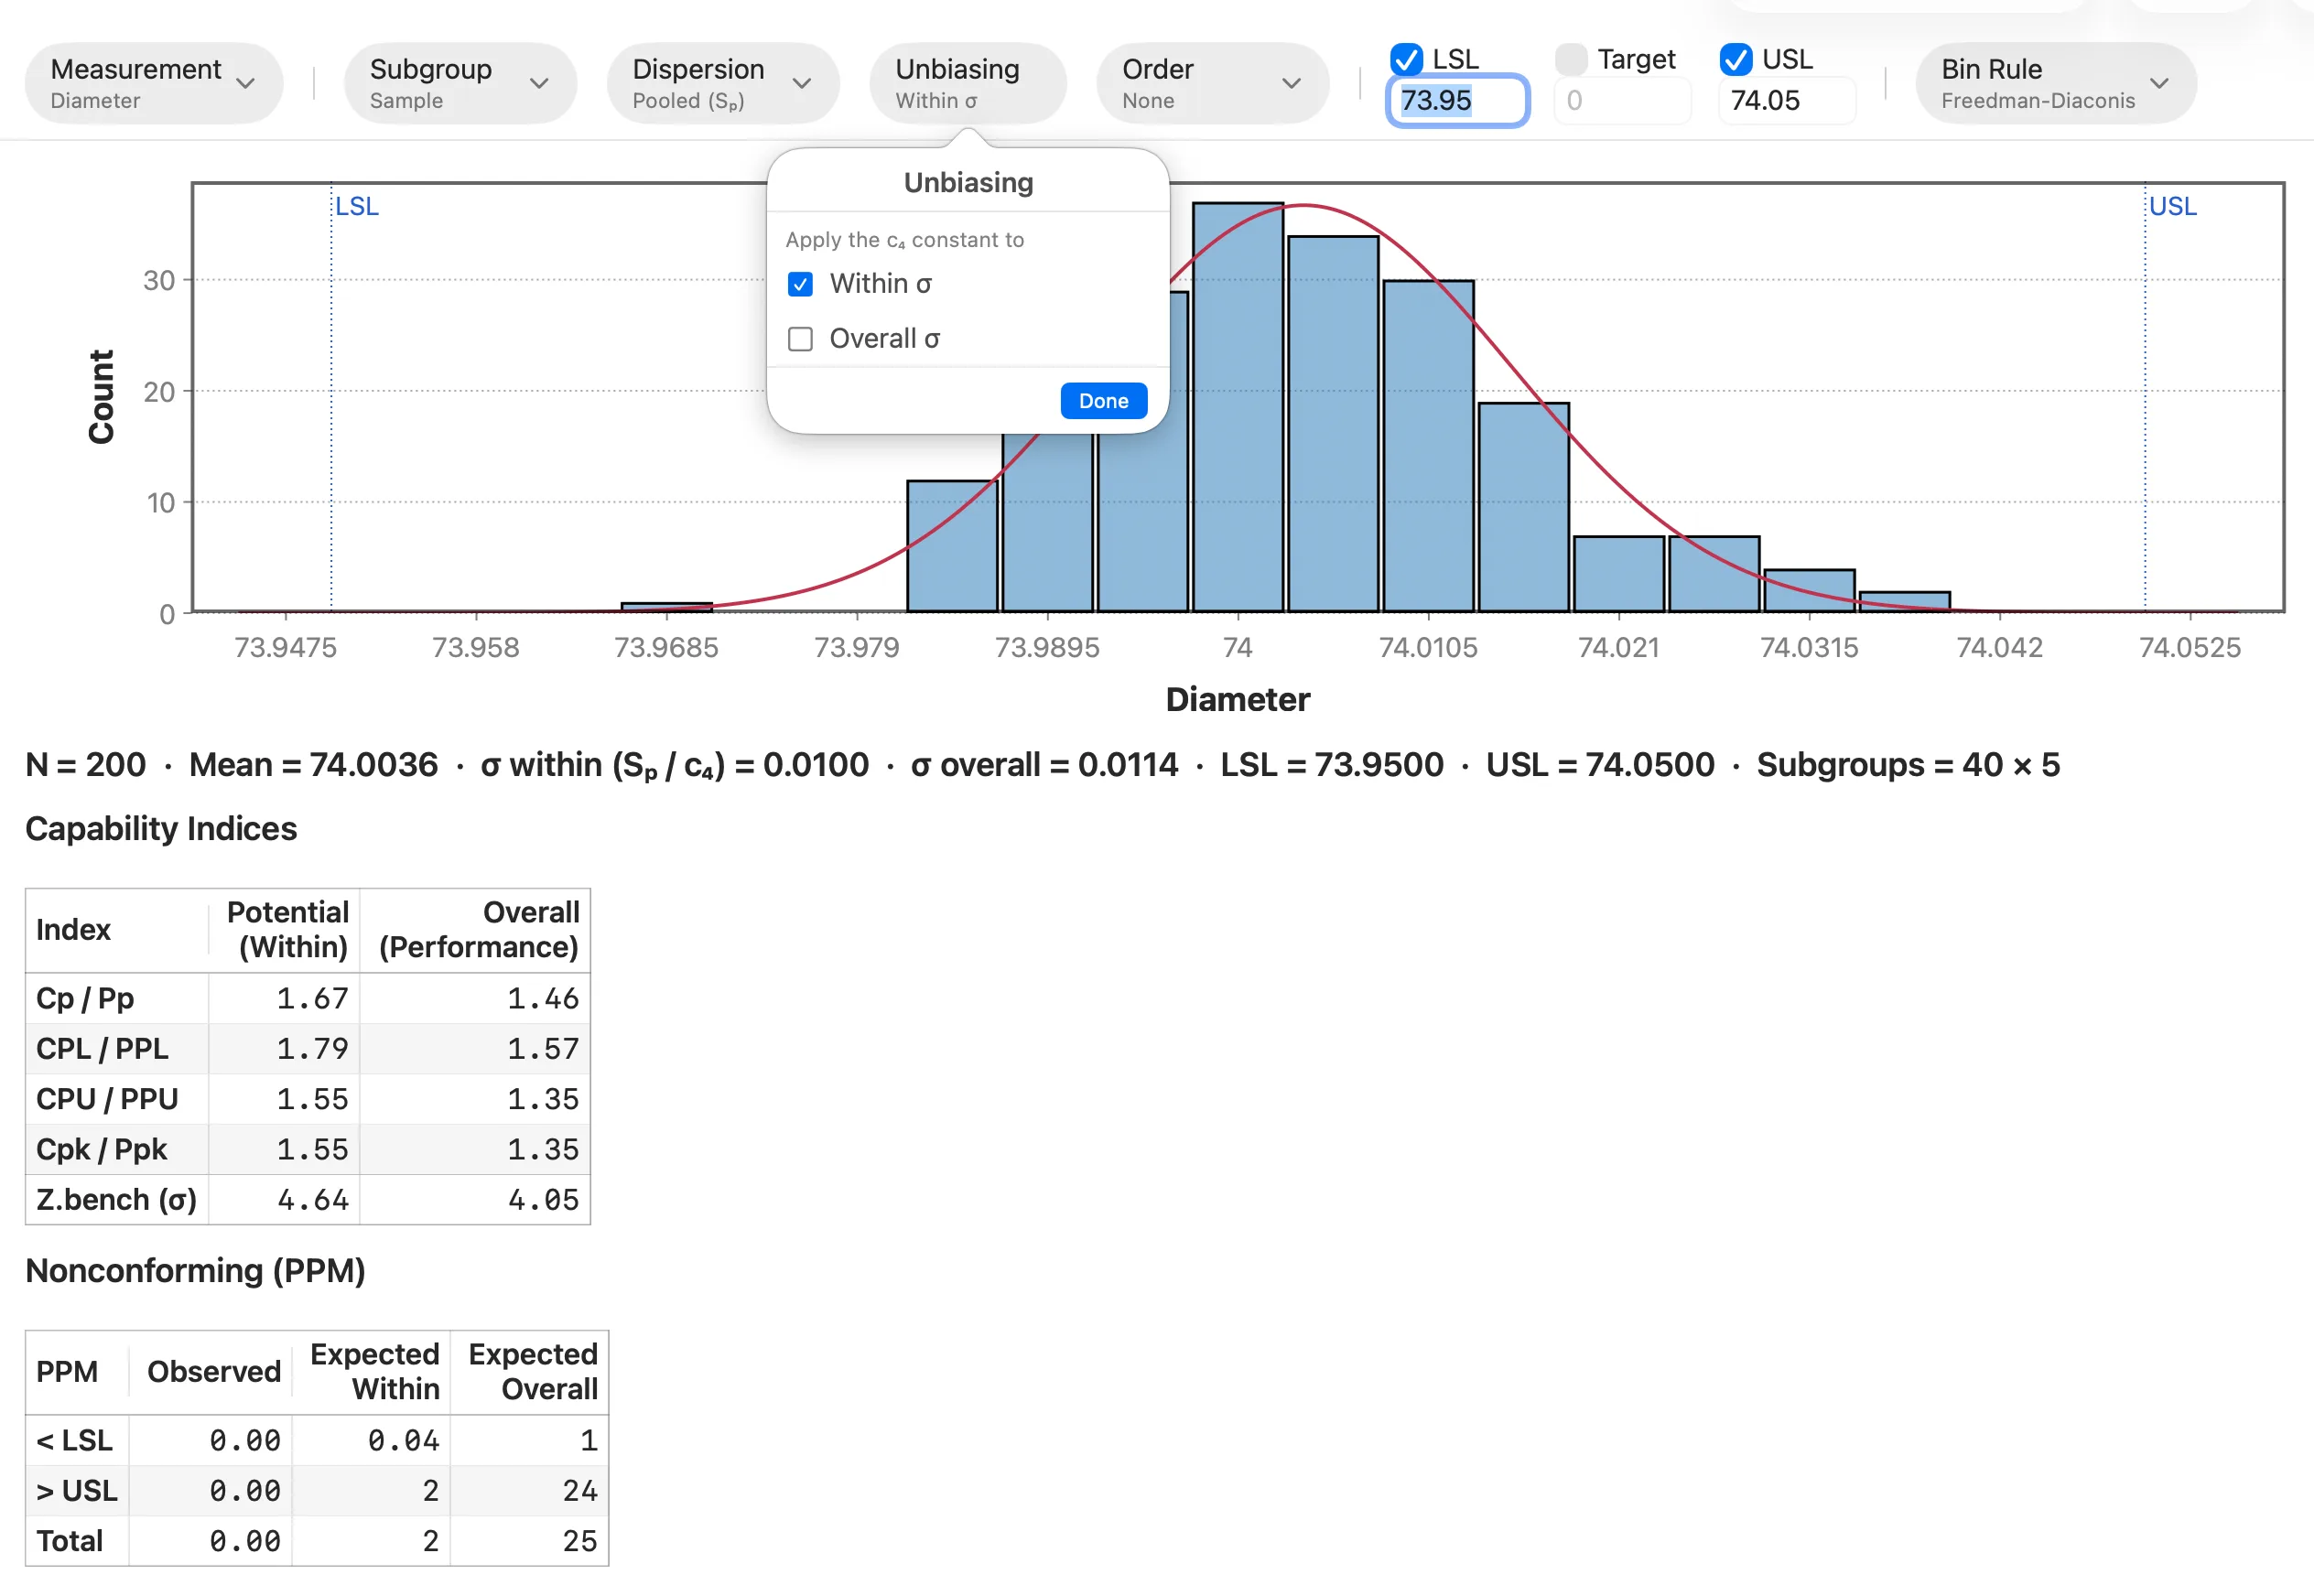
A pooled within-sigma, and c₄ unbiasing as a choice
Dispersion gains Pooled (Sp), which weights each subgroup by its degrees of freedom instead of averaging subgroup spreads equally — the estimator Minitab reports for capability, and what Auto now picks whenever real subgroups exist. A new Unbiasing control exposes the c₄ constant for each sigma separately, so overall and within can be unbiased independently. Capability assumes a stable process to begin with — What is a control chart? covers that half.
Correlation cells that show p and n, not just r
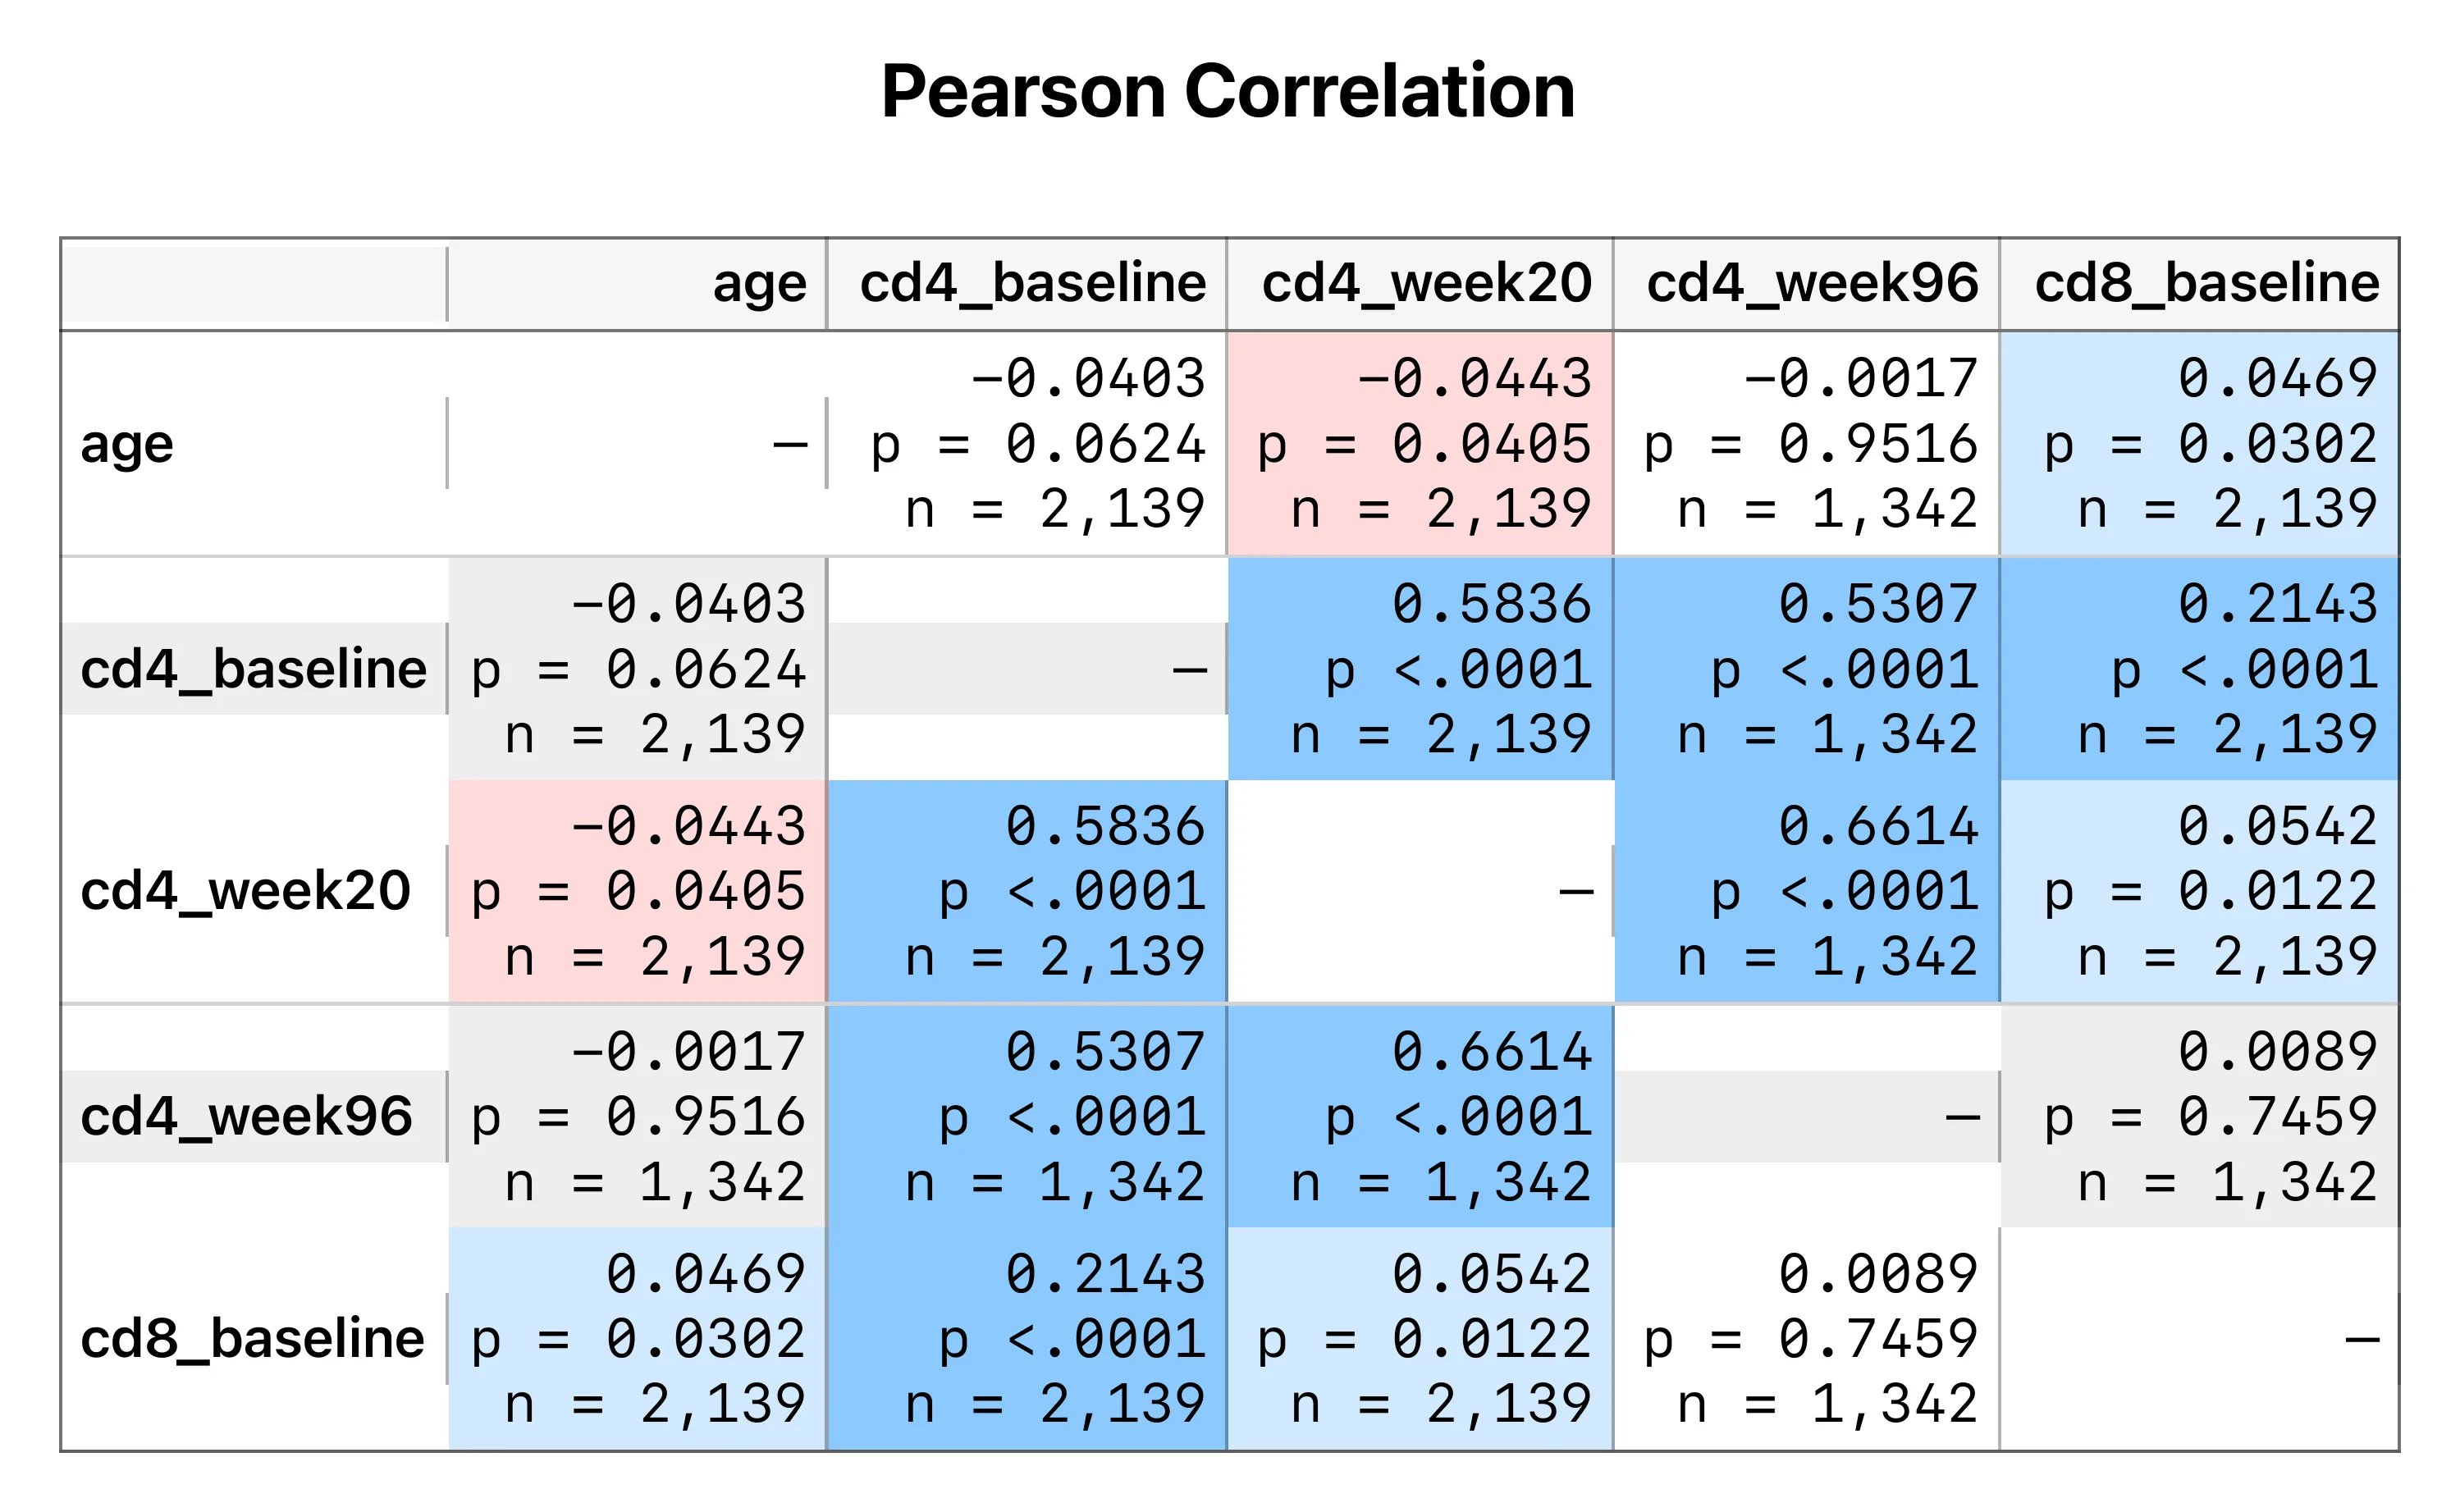
A Cell contents control prints the coefficient alone, with its p-value, with p and the pair's n, or with its 95% confidence interval — the stacked r / Sig. / N reading SPSS produces. Stratum's correlation is pairwise, so n genuinely varies from cell to cell and is worth showing. Every choice carries into Copy, PDF, CSV, TSV, Markdown and HTML. If you’re choosing between coefficients in the first place, Pearson vs Spearman is the primer.
Contingency percentages by row and column
Percentages used to be of the table total only. Row percentages read the rate within each group directly, so a responder-by-treatment table shows each arm's response rate in place rather than making you divide. Pick the basis alongside the existing Expected-count and Sparse-cell options.
Reports you can shape, and copy that lands right
Transpose, reorder, hide
Two-Sample, One-Way ANOVA and MANOVA can now be transposed into a tall strip that fits on a slide. Drag a column header to reorder any report, and right-click one to hide it — Std Dev, df, interval bounds — restoring it from the same menu. Order and visibility are remembered per report, and per section of a stacked report.
Reports say how many rows they actually used
Regression, PCA and MANOVA analyse complete cases. They now note "1,842 of 2,348 rows used (complete cases)" beneath the table — only when rows were actually set aside — and it travels into every export. Missing data quietly shrinking your sample is a good thing to find out about on the page rather than three steps later.
Copy a report and it pastes correctly wherever you put it
⌘C / Ctrl+C now places two representations on the clipboard at once: a formatted table for Word, Pages, Excel and Outlook, and column-aligned plain text for a text editor or a terminal, with a rule under the header the way a printed report reads. Whichever application you paste into takes the one it understands, so you no longer set the export format to match your destination first. Edit ▸ Copy As still copies exactly the one format you ask for.
Choose Stratum's language without changing your computer's
Preferences ▸ Interface ▸ Language now offers System or any of the ten languages Stratum ships in, and it moves the interface, the help book and the licence agreement together — so you can't end up with French menus and an English manual. About Stratum shows which language Stratum resolved to (Français (fr)) and whether that came from the system or from your choice.
.stratum document, and nothing leaves your machine.
How to get it
Existing users: choose Stratum ▸ Check for Updates… and the in-app updater takes it from there. New to Stratum? The download is already on 1.3, and the free 25-lesson tutorial is the fastest way in. Everything here is in every copy — Mac and Windows alike.