 Stratum
Stratum vs Excel for Statistical Analysis
Excel is where most analysis starts — and for a lot of people, where it shouldn't end. Here's an honest look at where it runs out of road for statistics, where it's still the best tool, and what changes when you use one built for the job.
Excel is a spreadsheet — a brilliant, general-purpose grid of cells. You can do statistics in it, and for a quick average or a one-off t-test it's perfectly fine. But "can" and "should" diverge quickly once the analysis gets real. This isn't an argument that Excel is bad software; it's about using the right tool for the job, and knowing where the spreadsheet stops being it.
Where Excel runs out of road
- Inferential statistics are thin and bolted on. The Analysis ToolPak covers a handful of tests with terse output and no diagnostics. Want ANOVA with a Tukey post-hoc, regression with VIF and Cook's distance, MANOVA, or a nonparametric test? You're hand-writing formulas or leaving the app.
- The charts aren't statistical. Excel does bar and line charts well, but box plots, violins, Q-Q plots, ECDFs, mosaics, Pareto charts, and SPC control charts are awkward or simply absent — and those are exactly the charts that explain a distribution.
- It strains at scale. Past a few hundred thousand rows Excel slows noticeably; its hard ceiling is 1,048,576 rows. Plenty of real datasets are larger than that.
- Formulas are fragile and hard to audit. Analysis lives in thousands of hand-entered cell references — famously easy to get subtly, silently wrong, and painful for anyone else to verify.
- The Mac version lags. Excel for Mac has historically trailed the Windows build on the very analysis features you'd reach for, the ToolPak included.
A concrete example: a one-way ANOVA with post-hoc
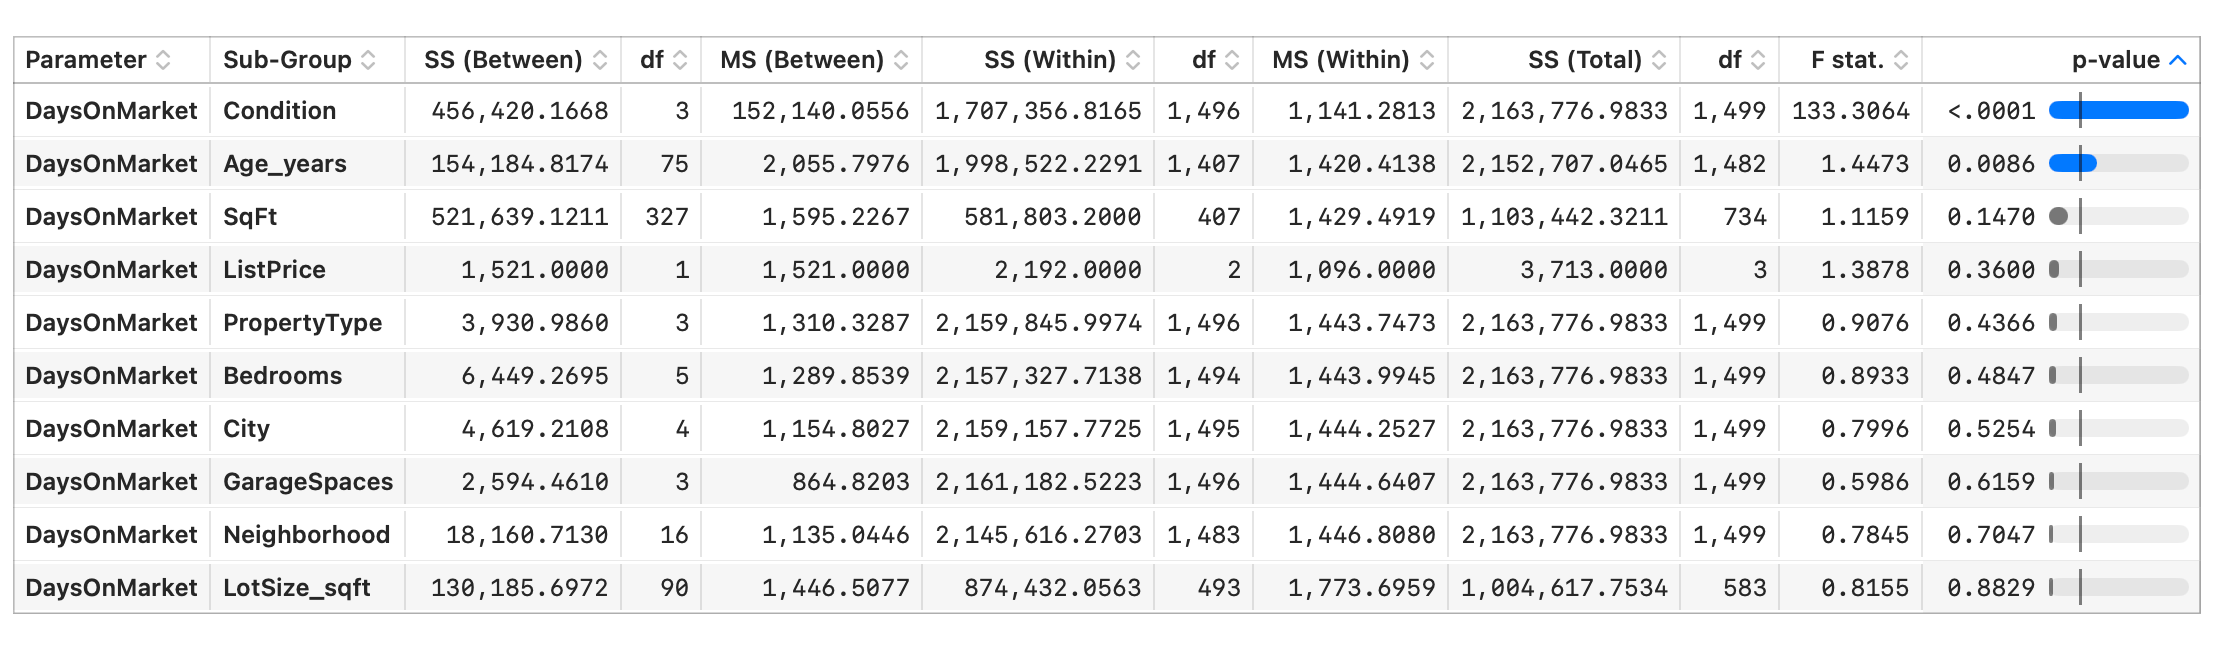
Say you're comparing a measurement across four groups. In Excel you'd run the ToolPak's single-factor ANOVA, get an F and a p-value — and then stop, because the ToolPak has no post-hoc test. To find which groups differ you'd hand-build Tukey HSD across cells, with no built-in critical values, and hope you referenced the right ranges. In a dedicated tool you pick the response and the factor, read the F and p, then right-click for Tukey HSD and Levene's test. Same analysis; one is a chore you can get subtly wrong, the other is three clicks with the diagnostics attached.
Feature-by-feature
| Excel for Mac | Stratum | |
|---|---|---|
| Inferential tests | Limited (ToolPak) | t-tests, ANOVA + Tukey, MANOVA, correlation, chi-square, regression with full diagnostics |
| Post-hoc / diagnostics | None built in | Tukey HSD, Levene's, VIF, leverage, Cook's distance |
| Statistical charts | Bar / line; box plots awkward | 30+ incl. box, violin, density, Q-Q, Pareto, mosaic, heatmap, control charts |
| Machine learning | None built in | PCA, k-means & hierarchical clustering, decision trees, random forests, boosted trees |
| Scale | ~1M-row ceiling, sluggish before | Smooth to ~5 million rows |
| Reproducibility | Loose cell formulas | Re-editable analyses saved inside the document |
| Privacy | Often cloud-tied | 100% native and offline |
| Platform | Cross-platform; Mac build trails | Native to Mac & Windows |
A few traps unique to doing stats in Excel
Beyond missing features, statistics in a spreadsheet has some failure modes that bite quietly:
- Quartiles depend on which function you picked. Excel ships two percentile/quartile methods (
.INCand.EXC) that give different answers; grab the wrong one and your box plot's box moves without warning. - Blanks and text in a range are handled inconsistently. Some functions skip them, some treat a blank as zero — and a single stray non-numeric cell can quietly change a mean or a count.
- No real concept of missing data. "Not measured" and "zero" look the same to most formulas, so missing values silently distort summaries unless you hunt them down by hand.
- Formulas drift when you copy them. A relative reference dragged one row too far, or a range that didn't grow when you added data, produces a number that looks fine and is wrong — with nothing to flag it.
A dedicated tool sidesteps these by typing columns at import, treating missing values as first-class, and computing each statistic with one documented method — so the result is the same every time and there's no cell arithmetic to audit.
Where Excel is still the right tool
Plenty, and it's worth being honest about it. Excel is unbeaten for data entry and storage, for quick arithmetic and what-if models, for sharing a table with someone who'll open it anywhere, and for financial and business spreadsheets full of bespoke formulas. If your "analysis" is a sum, an average, a lookup, or a pivot table, Excel is the fastest path and you should use it. The case for a dedicated tool starts when the questions turn statistical.
Moving over is painless
You don't migrate, and you don't relearn from scratch. Stratum opens your existing .xlsx and .csv files directly — drag one in and it imports as a typed dataset, with numeric and categorical columns detected automatically. Your spreadsheets stay exactly where they are; Stratum is simply where you take them when a real analysis question comes up. Most people keep both: Excel for the ledger, Stratum for the statistics.
Download Stratum See all features →
Frequently asked questions
Can Excel for Mac do ANOVA and regression?
Via the Analysis ToolPak, Excel offers a limited set of tests with sparse output and no diagnostics (no VIF, leverage, Cook's distance, or post-hoc tests). For serious inferential work, a dedicated stats app is far less error-prone.
How many rows can Excel handle?
A worksheet maxes out at 1,048,576 rows, and performance degrades well before that. Stratum is built to stay responsive on datasets up to roughly 5 million rows.
Do I have to convert my Excel files to use Stratum?
No — Stratum opens .xlsx and .csv files directly. Drag the file in and it's imported as a typed dataset, ready to chart and test.
Is Excel ever the better choice?
Yes. For data entry, quick arithmetic, what-if models, pivot tables, and sharing a plain table, Excel is excellent. Reach for a stats app when the question becomes inferential or the charts need to be statistical.
What's the best statistics software for Mac if not Excel?
It depends on your work, but a native app for Mac & Windows that covers descriptive stats, inferential tests with diagnostics, statistical charts, and machine learning in one place — like Stratum — avoids both Excel's limits and the overhead of R or Python.