 Stratum
Stratum vs GraphPad Prism
GraphPad Prism is beloved in the life sciences. So when does a broader, native stats app for Mac & Windows like Stratum make more sense? Here's an honest comparison.
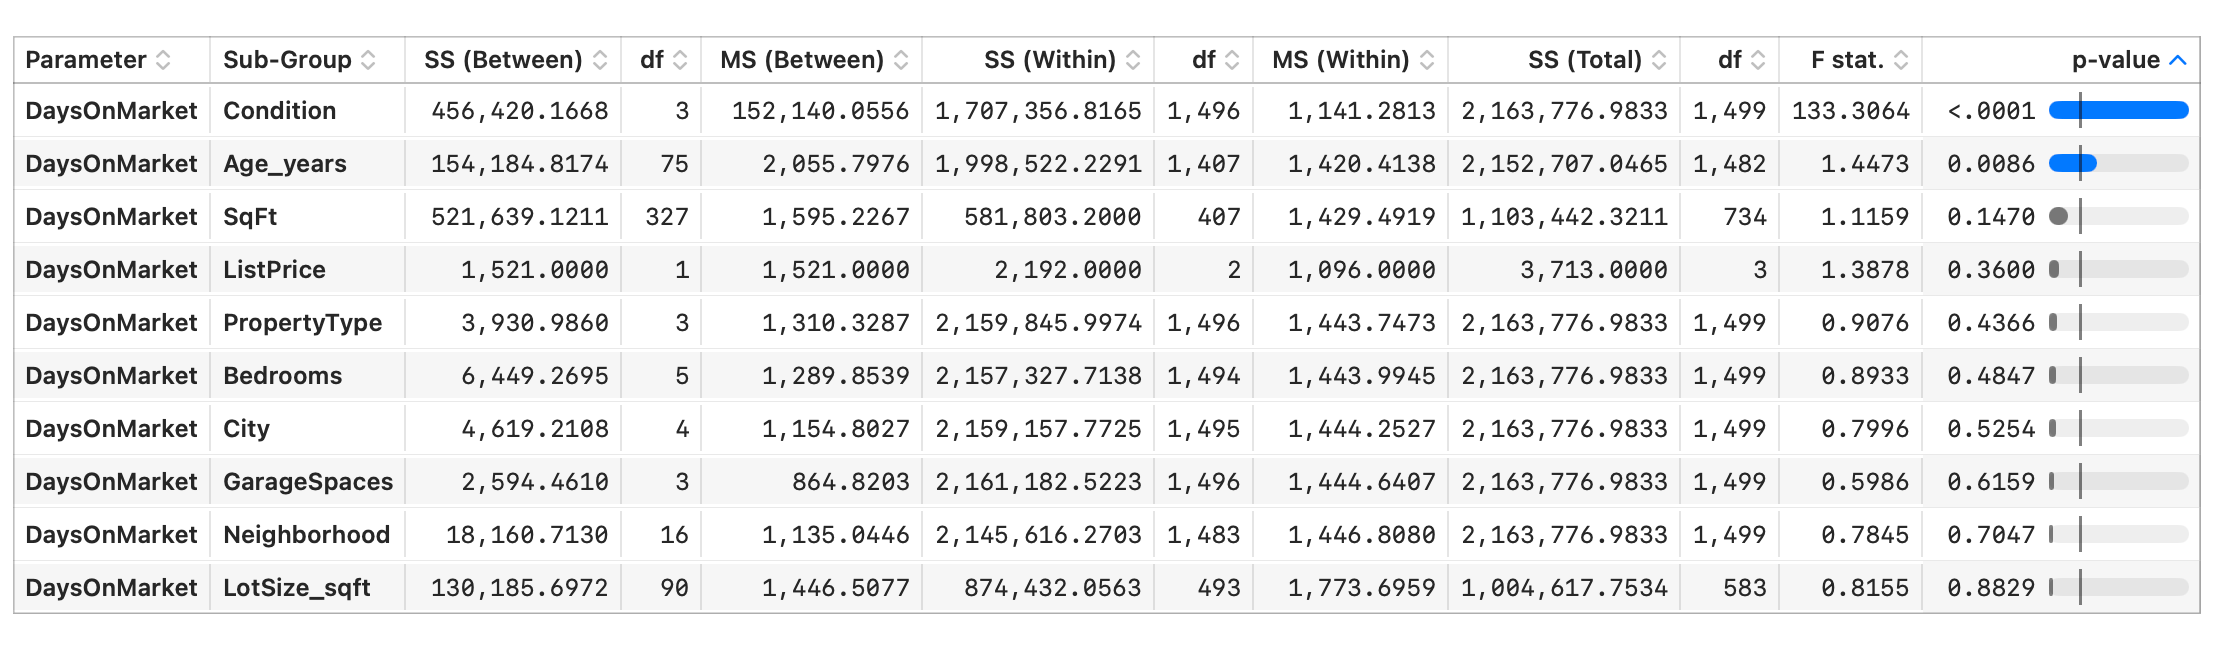
GraphPad Prism is a fixture in biology and medical research, prized for guided analyses and publication-quality graphs tuned precisely to that world. Within its niche it's excellent. The question is whether your work matches Prism's focus — or whether you'd be better served by a broader, lighter, more general tool.
Where Prism shines
The lab and the life sciences. Prism's strengths are nonlinear and dose–response curve fitting (its signature), survival analysis (Kaplan–Meier), and graphs styled to journal conventions. Its analysis “wizards” walk you to the right test for common experimental designs, which is a real help for bench scientists who aren't statisticians. If that's your daily work, Prism is purpose-built and hard to beat.
Where a broader native app fits
Prism is deliberately specialized — which is a limitation the moment your work steps outside the lab. A general-purpose native app covers more ground:
| GraphPad Prism | Stratum | |
|---|---|---|
| Focus | Biostatistics & lab science | General-purpose statistics & charting |
| Pricing | Premium subscription | One-time, lower cost |
| Scale | Modest datasets | Up to ~5 million rows |
| Inferential breadth | Deep in its niche | t-tests, ANOVA + Tukey, MANOVA, correlation, chi-square, regression w/ diagnostics |
| Quality & ML | Limited | SPC control charts; PCA, clustering, trees, forests |
| Curve fitting | Nonlinear / dose–response | Linear regression (not specialized nonlinear) |
| Best for | Dose–response, survival, lab graphs | Everyday analysis across fields |
Different jobs, not a head-to-head
This isn't really a rivalry; the two suit different work. Prism is a specialist's tool for the lab; Stratum is a generalist's tool for everyday analysis. If you're outside the life sciences, or you need machine learning and statistical process control alongside your statistics, Stratum is the better day-to-day fit — and if you're a bench scientist who also wrangles operational or survey data, the two happily coexist.
Trying it
Stratum imports your existing spreadsheets directly, so you can run a real analysis in minutes. For the specialized curve-fitting that defines Prism, keep Prism; for everything else on your computer, see how far a broader tool gets you.
Download Stratum See all features →
Frequently asked questions
Is there a general-purpose alternative to Prism for Mac?
Yes — Prism is focused on biostatistics. A broader native app like Stratum covers general statistics, charts, SPC, and machine learning for work outside the lab, at a one-time price.
What is GraphPad Prism best at?
Life-science statistics and graphs: nonlinear and dose–response curve fitting, survival analysis, and publication-ready plots, with guided analysis wizards for common experimental designs.
Does Stratum do nonlinear curve fitting like Prism?
No — Stratum does linear regression with full diagnostics and a broad chart and modeling set, but it isn't a specialized nonlinear curve-fitting package for kinetics or dose–response. That's Prism's niche.
Is Stratum good for biology or medical research?
For general analysis — descriptive stats, group comparisons, regression, charts — yes. For dose–response curves and survival analysis specifically, Prism remains the specialist tool.
Which should I choose, Prism or Stratum?
Prism for dose–response, survival, and lab graphs. Stratum for general-purpose statistics, charts, SPC, and machine learning across fields at a one-time price.