Minitab alternative · SPC included
Stop renewing a subscription you have to ask the price of: Stratum is one-time, Professional at $249, and runs as natively on a Mac as on Windows — so everyone works in the same app. Capability intervals come from the exact noncentral t, not the normal approximation most packages settle for.
Minitab won’t quote a price without a sales call — its pricing page is a contact form. Whatever the number turns out to be, it returns every year, and access stops when you stop paying.
Five years, five bills — and no software left if you stop.
Bought once. The version you buy keeps working forever, online or off, on Mac and Windows alike.
$249 for Professional — once, and it's yours.
| Minitab | Stratum | |
|---|---|---|
| Pricing | Annual subscription — price on request | One-time (Professional $249) |
| Platform | Windows-first | Native to Mac & Windows |
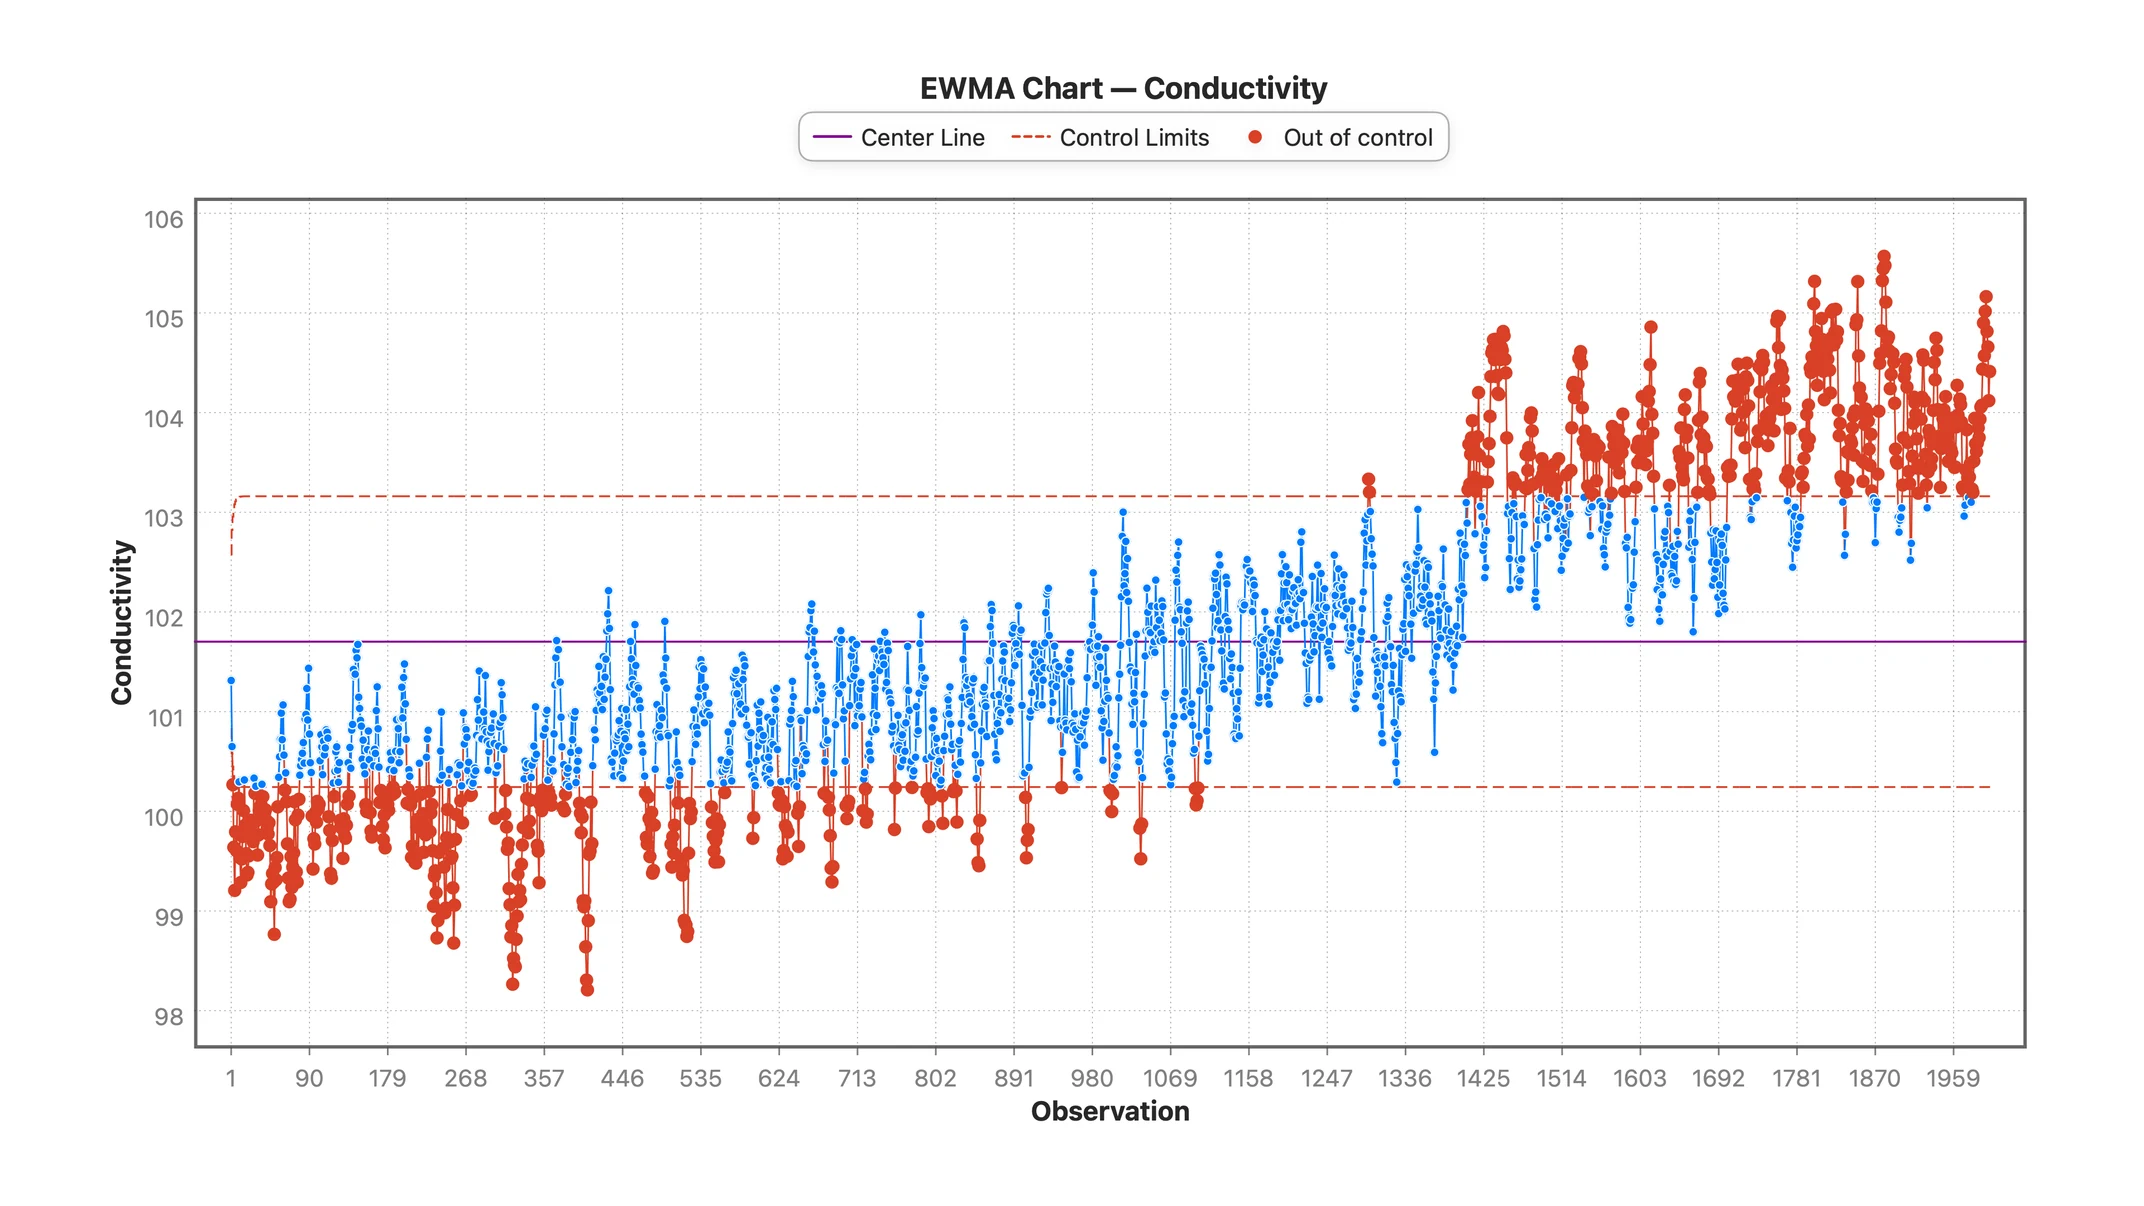
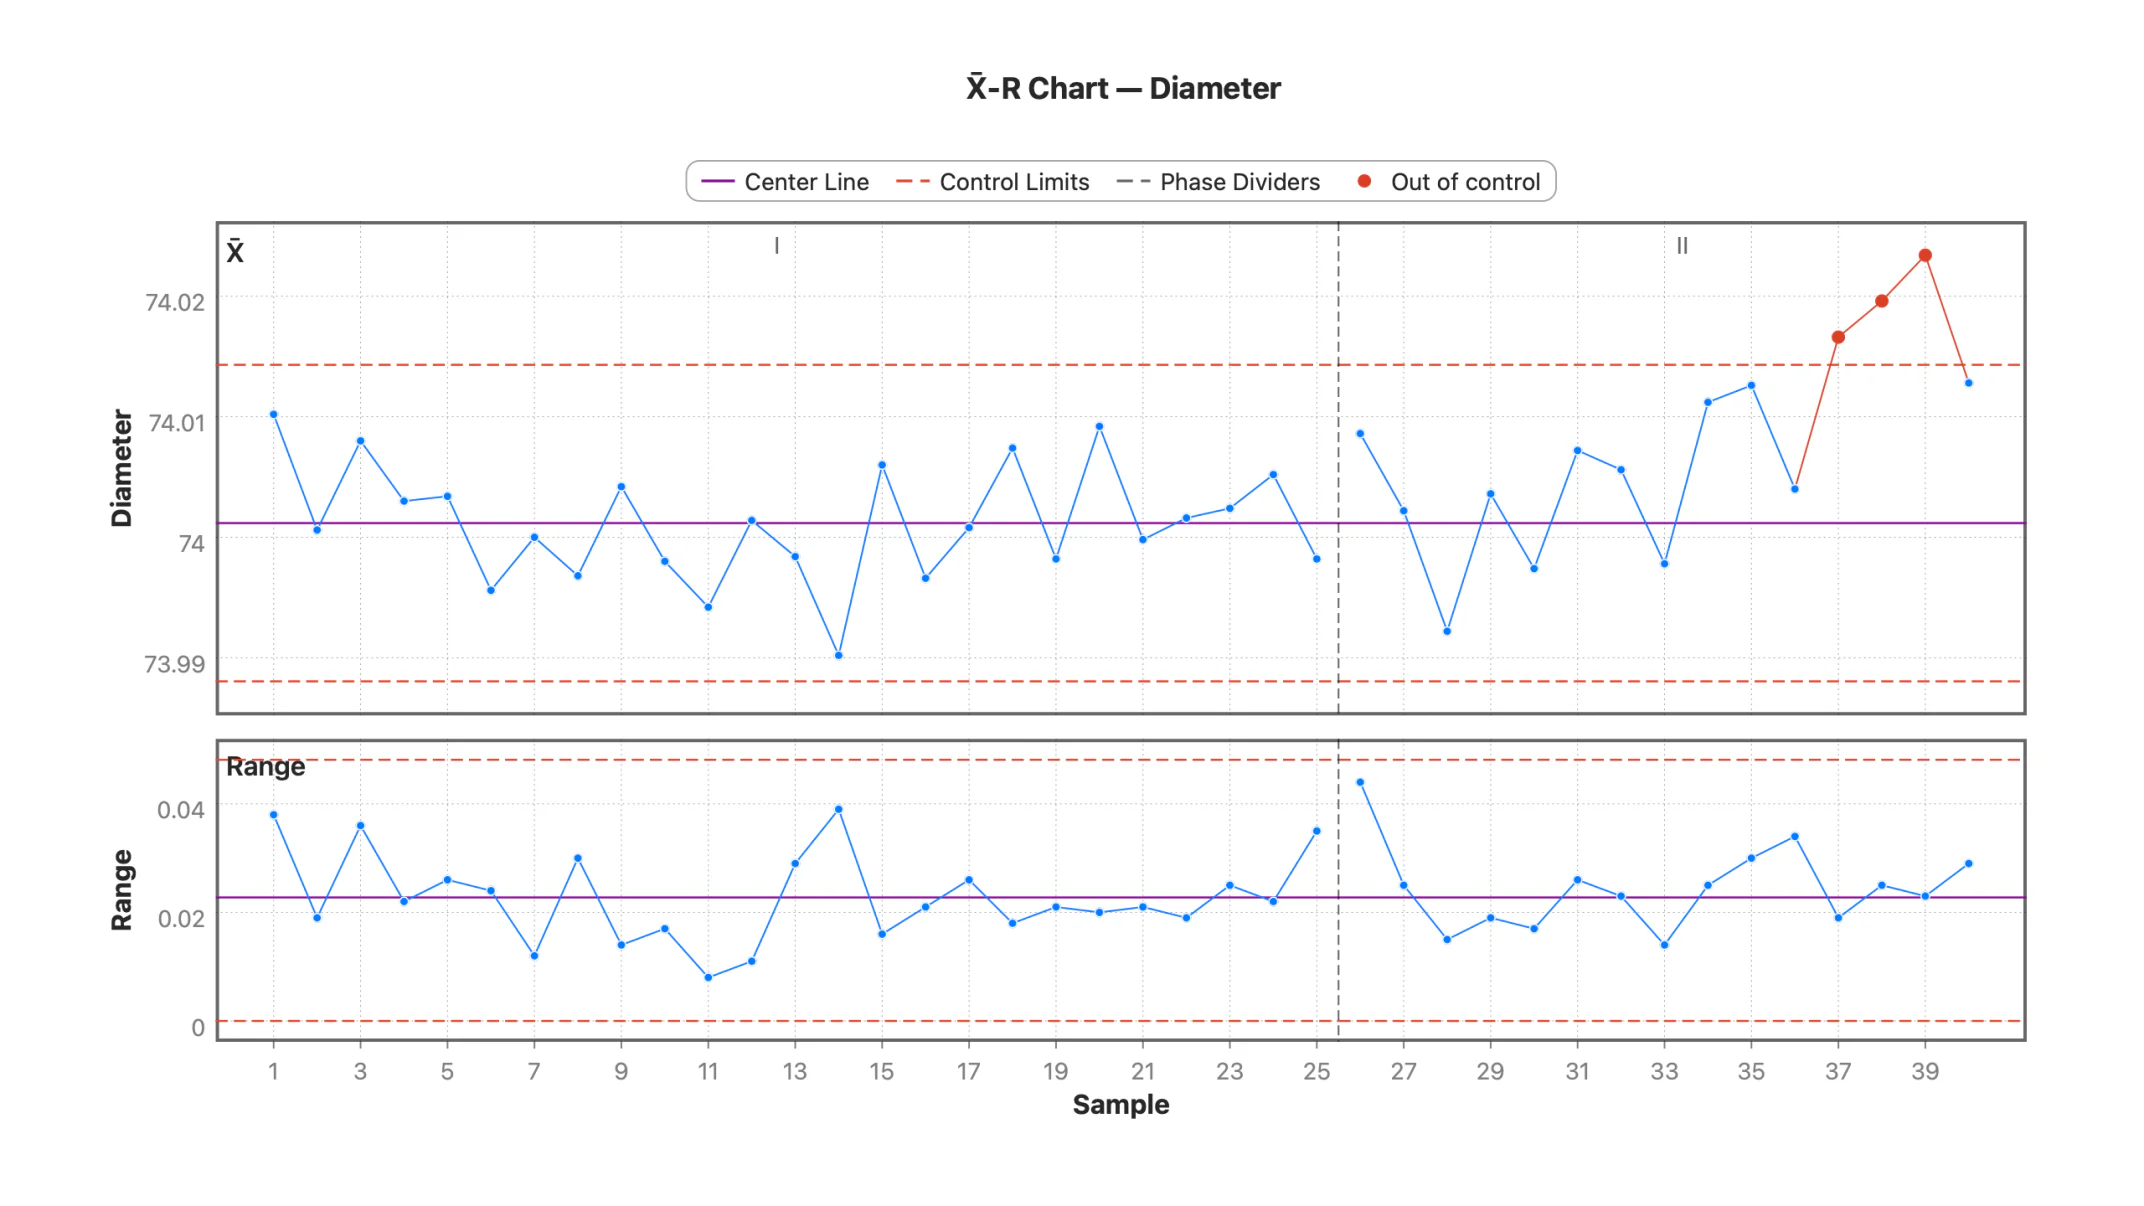
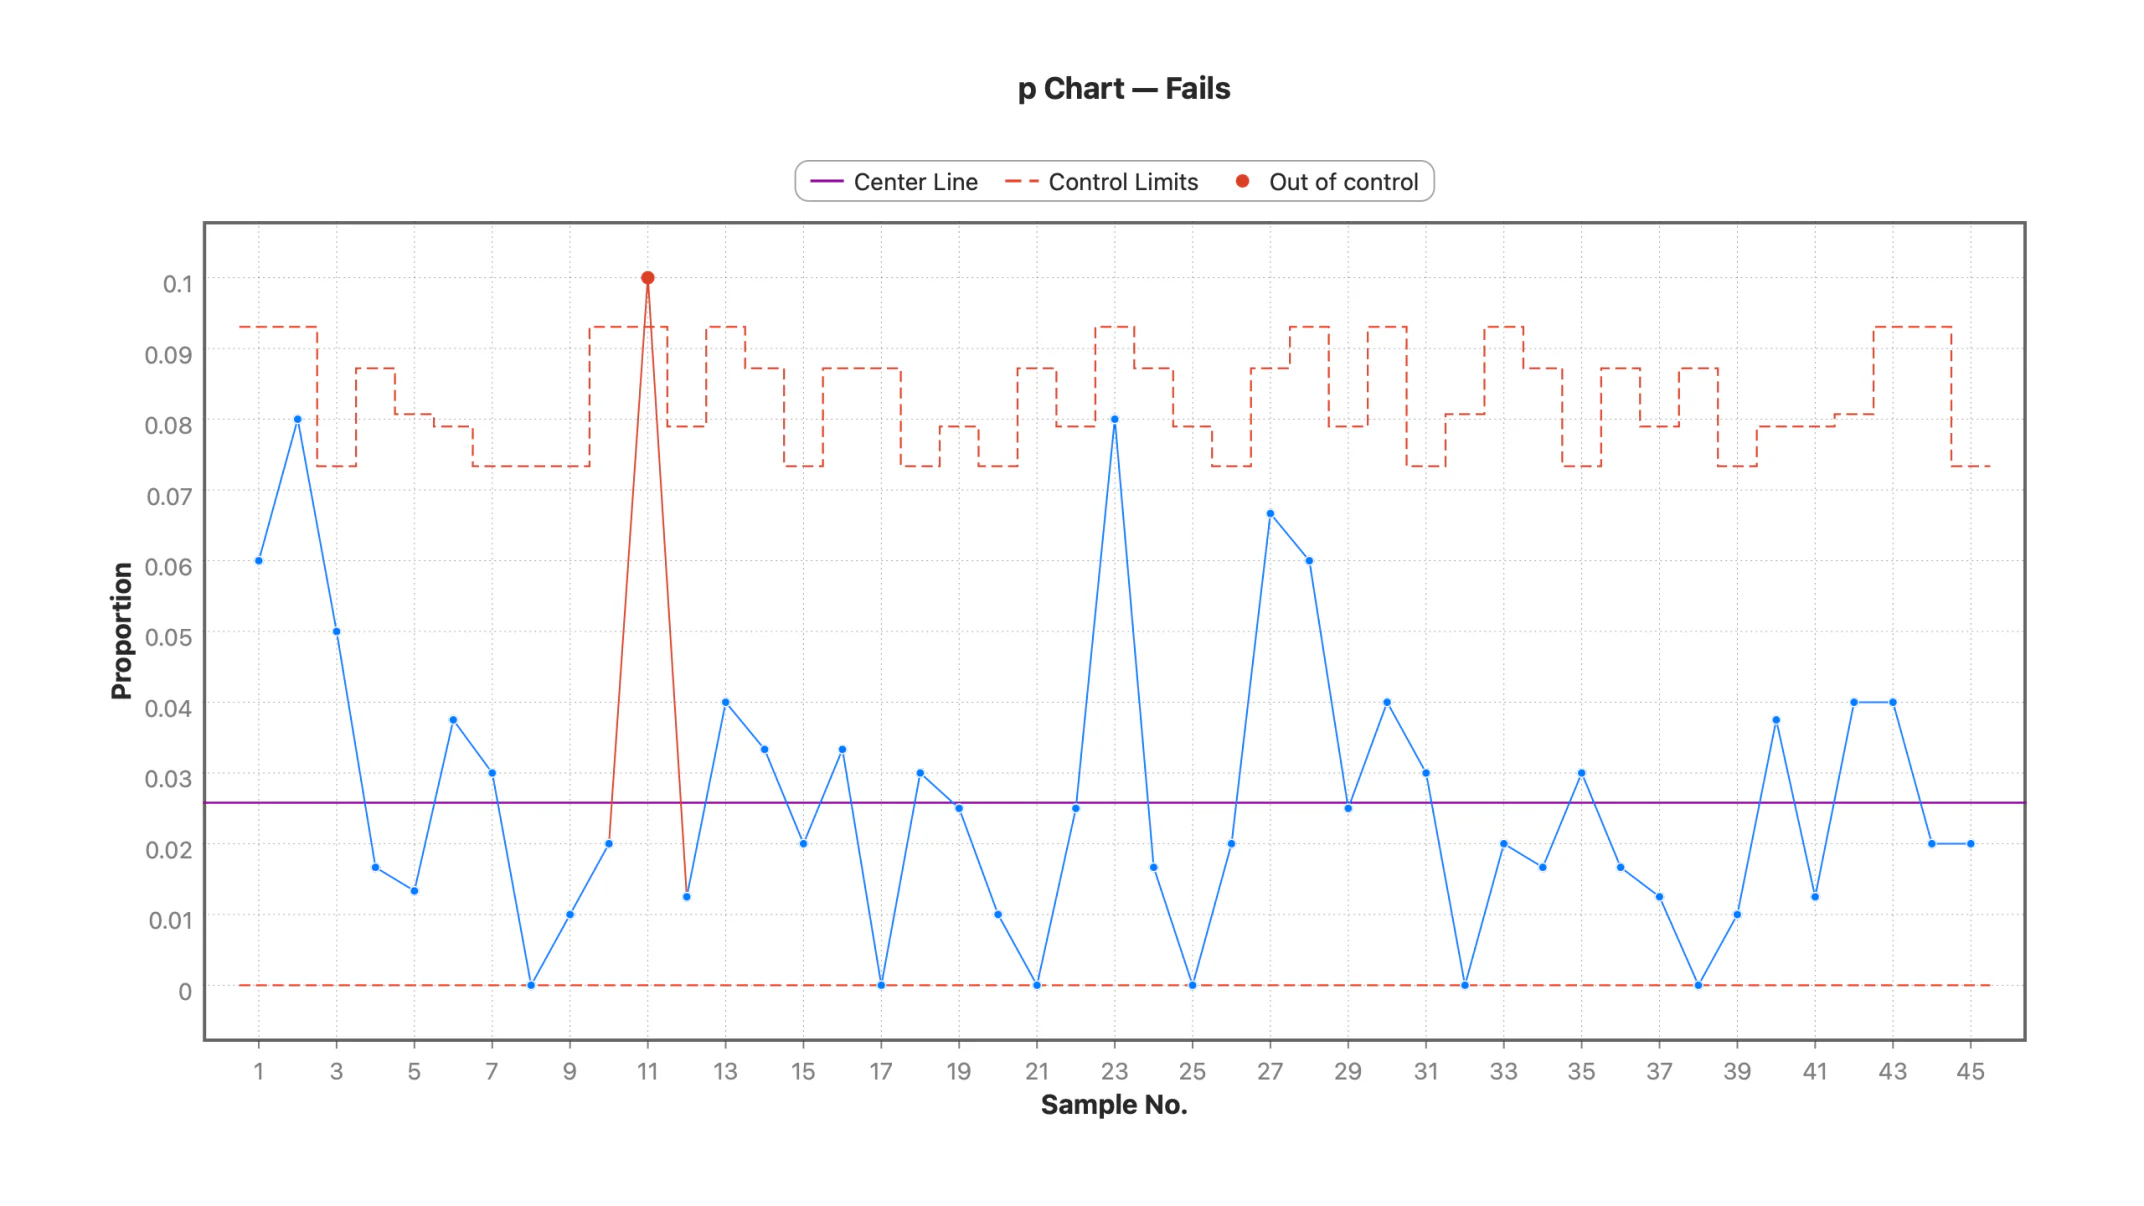
| SPC control charts | Yes | I-MR, X̄-R, X̄-S, p, np, c, u, CUSUM, EWMA (Professional) |
| Out-of-control rules | Yes | All eight Nelson rules, toggled per chart, with a Western Electric preset |
| Phases & stages | Yes | Phase I baseline carried forward, or limits re-estimated per stage |
| Given control limits | Yes | Historical and standard values accepted in place of estimates |
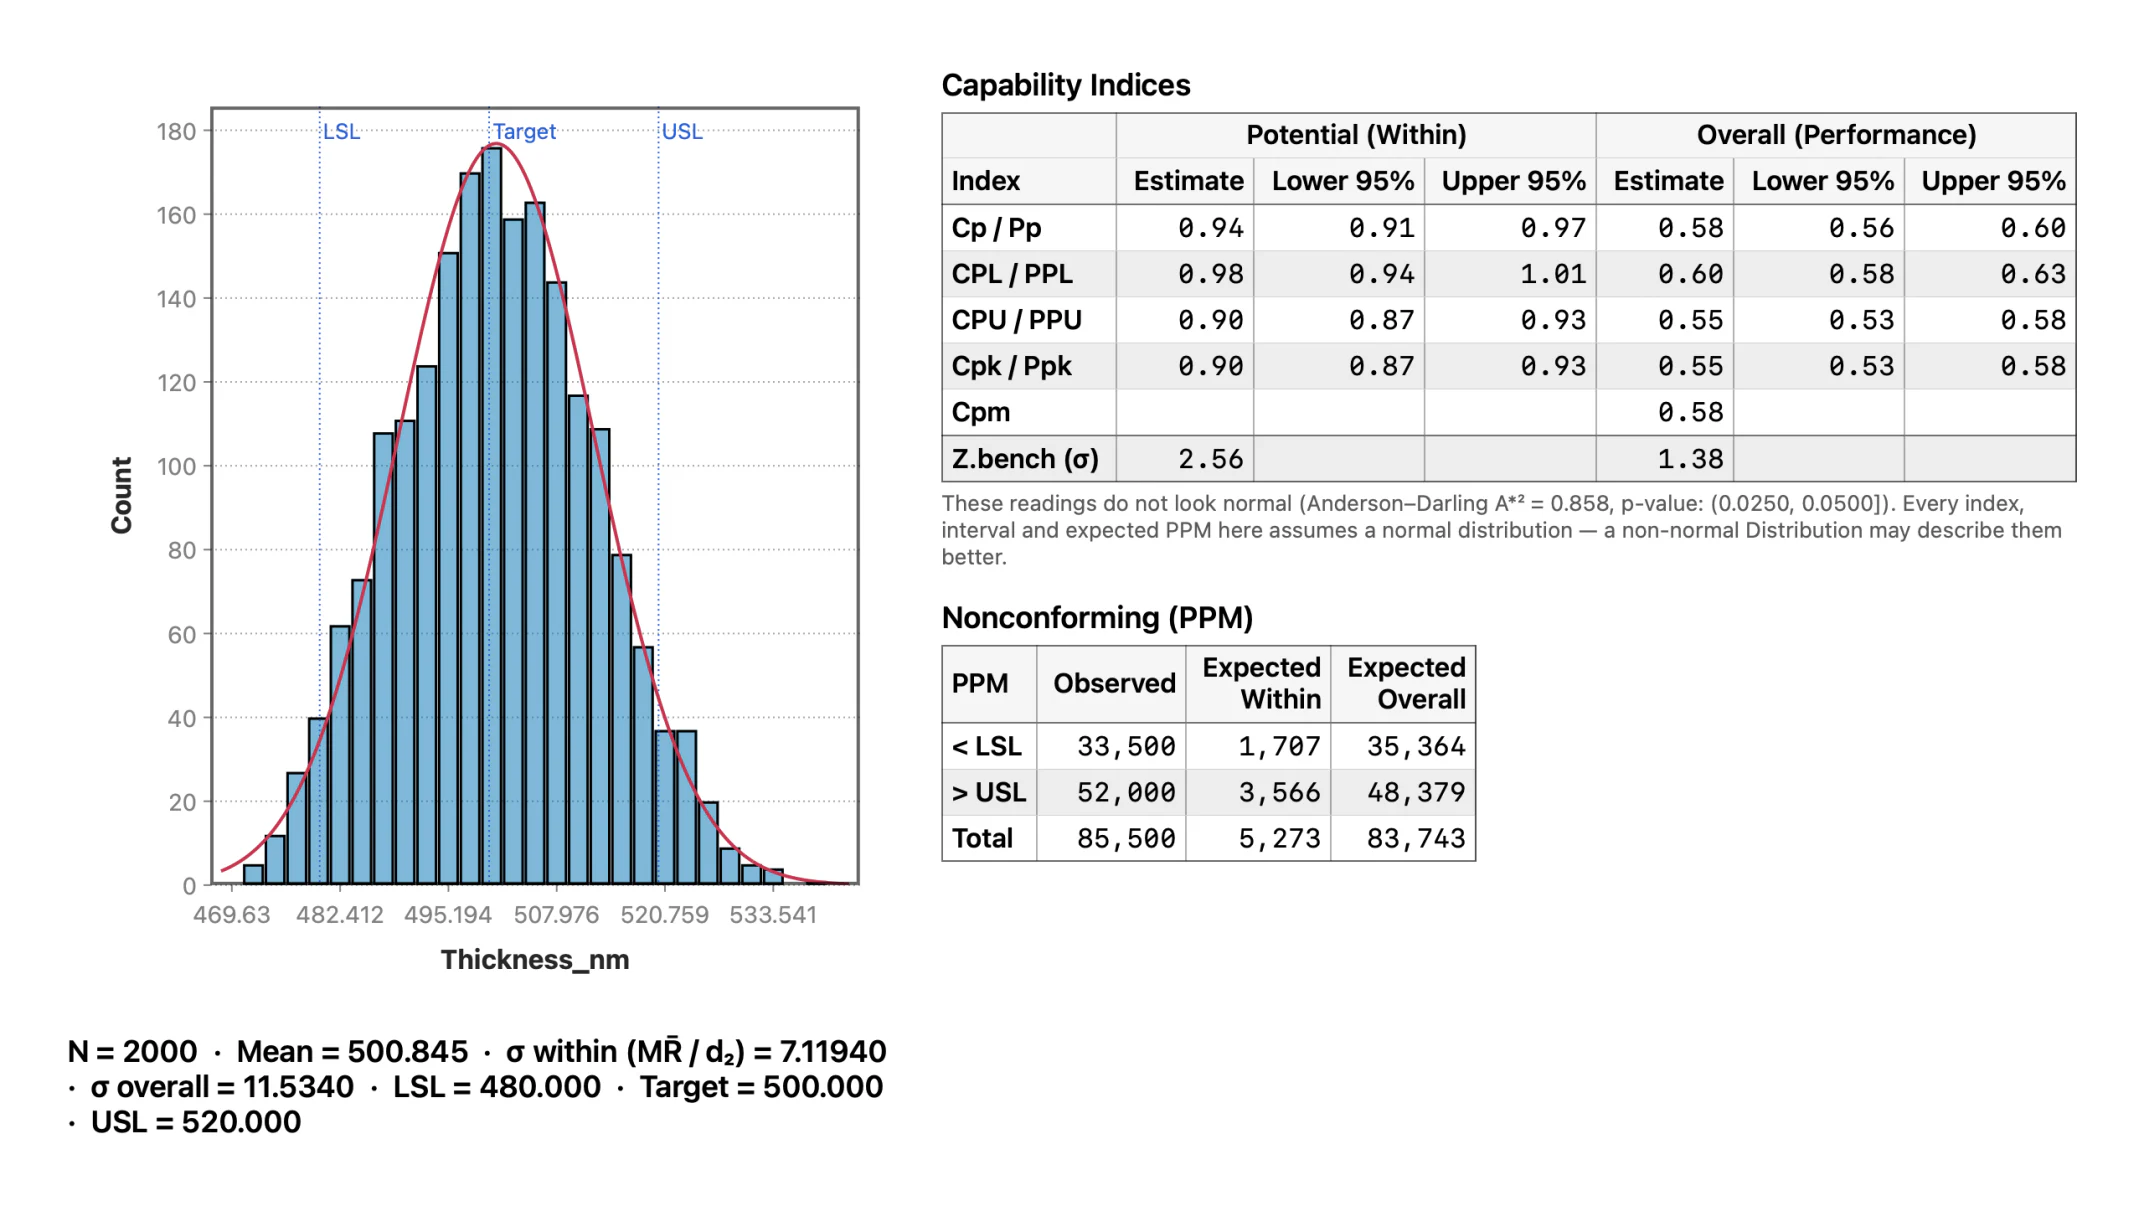
| Process capability | Yes | Cp, Cpk, CPL, CPU, Cpm, Pp, Ppk, PPL, PPU, PPM and Z-bench (Professional) |
| Capability intervals | Bissell normal approximation | Exact noncentral t — the form that approximation stands in for |
| Non-normal capability | Yes | Lognormal, Weibull, exponential — percentile indices to ISO 22514-2 |
| Linked selection | Brushing on graphs | One row selection across the datasheet and every chart — select the out-of-control points and they light up everywhere |
| Everyday stats & charts | Yes | 30+ charts, ANOVA and MANOVA, regression with diagnostics, contingency |
| Numerical validation | Methods and formulas documented | Published validation record — the outside tool named for every statistic, including the gaps |
Summary — mean, SD, quartiles, skewness and kurtosis for every column at once, with counts and percentages.
Two-Sample — Student's t, Welch and paired, with Mann-Whitney and Wilcoxon in the same report.
Correlation — Pearson, Spearman and Kendall matrices with confidence intervals and multiple-comparison correction.
One-Way ANOVA — SS, df, MS, F and p, with Tukey HSD post-hoc comparisons and Levene's test.
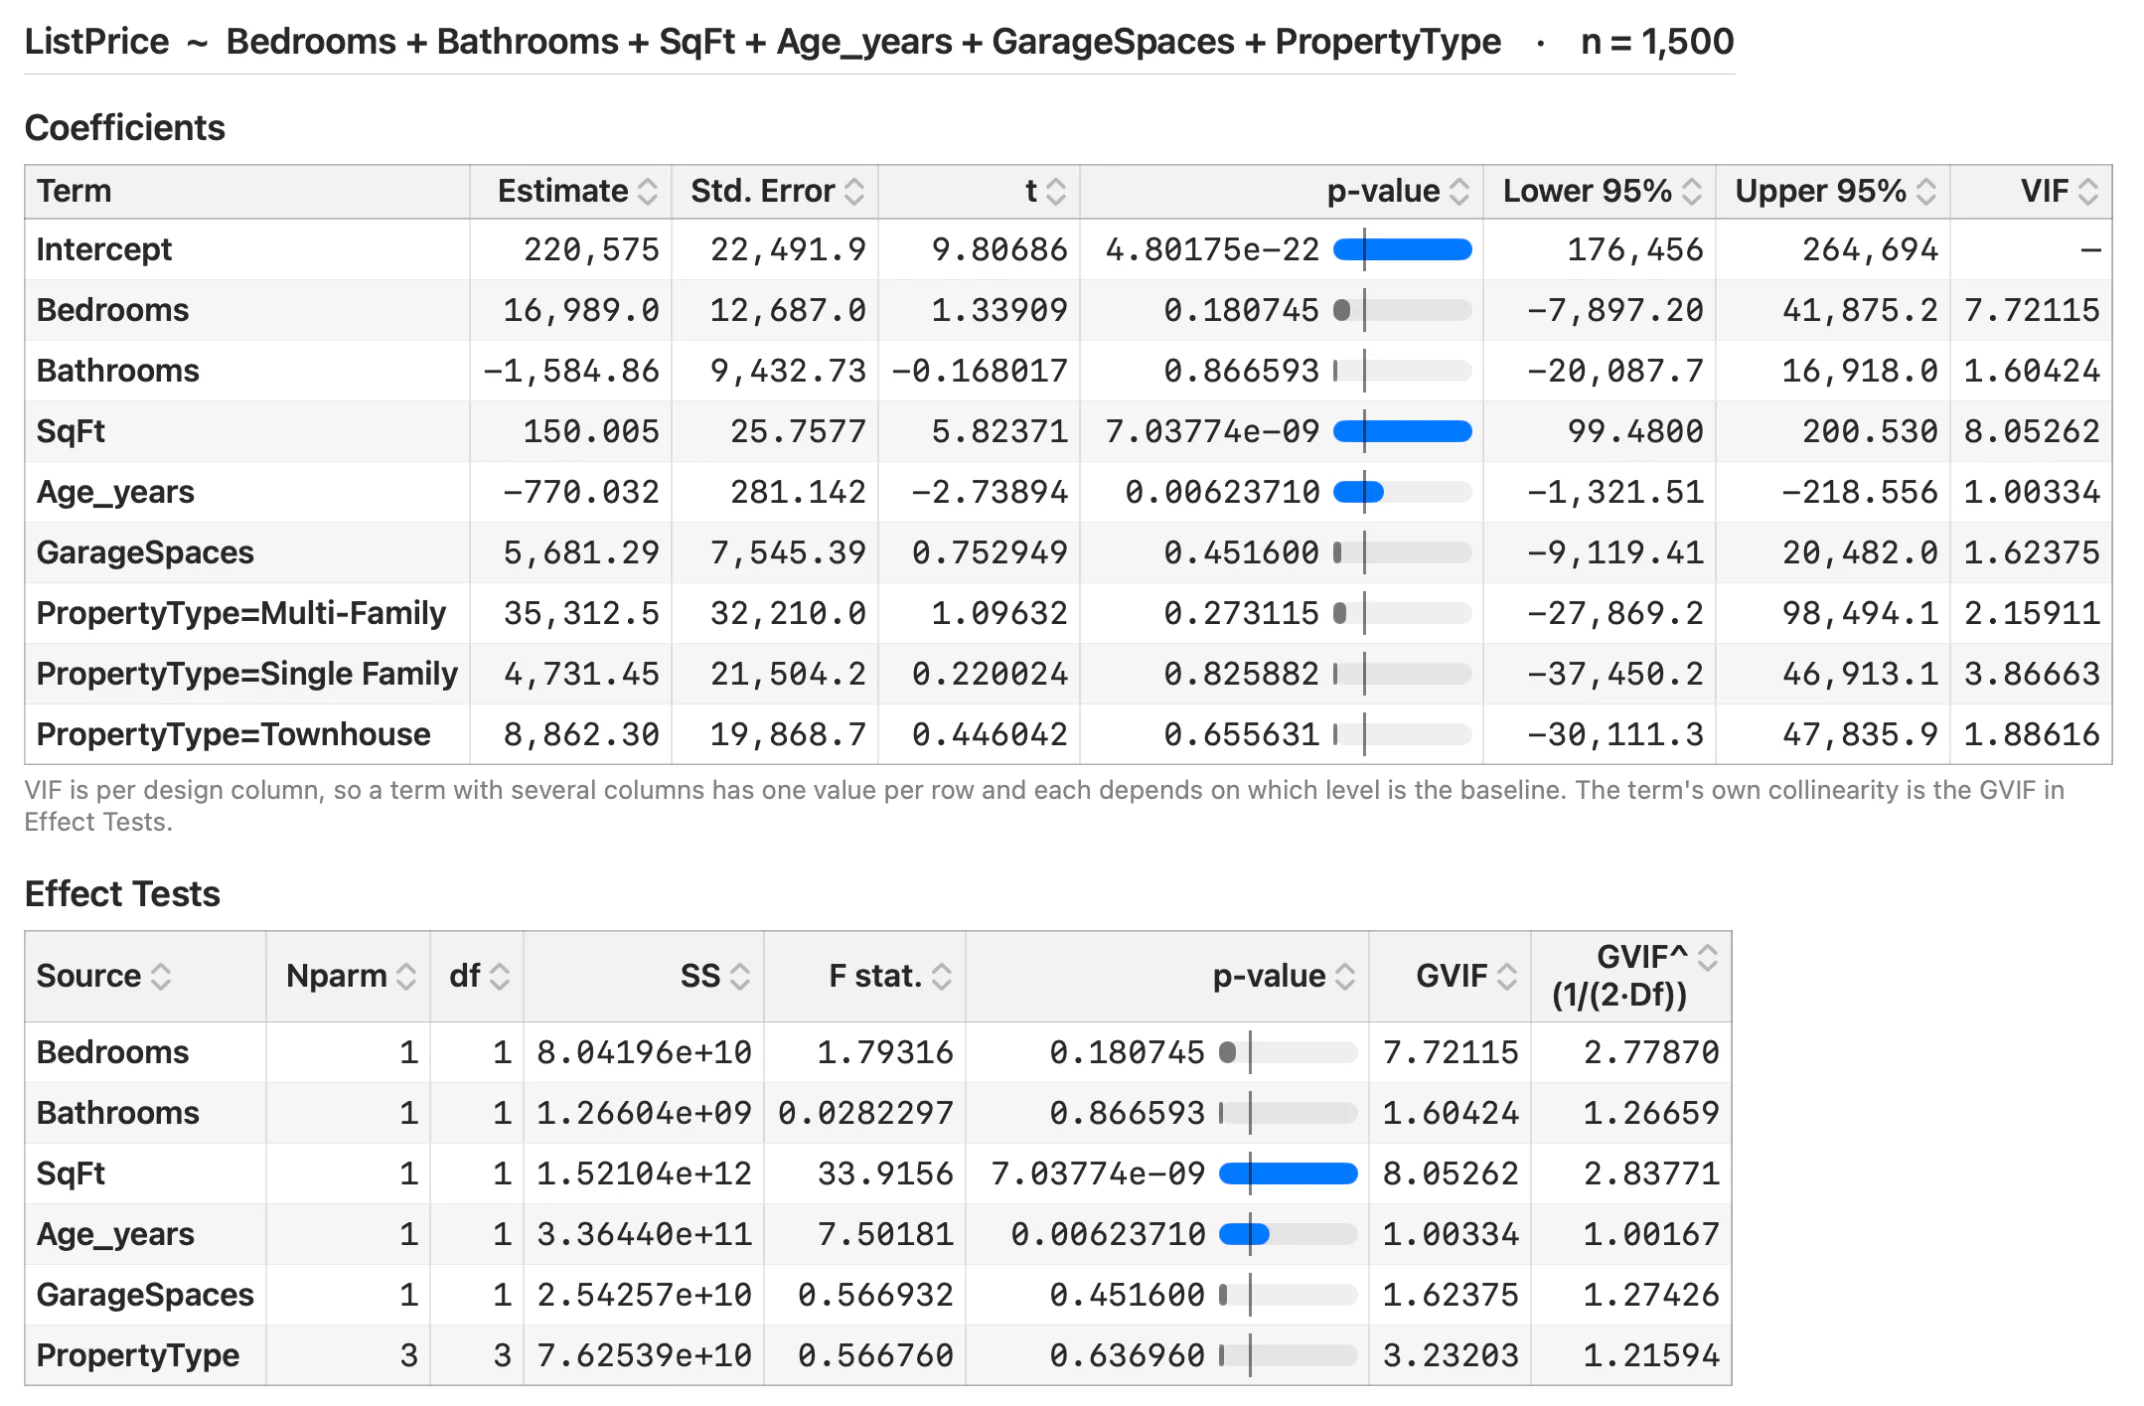
Linear Regression — coefficients with CIs, VIF, leverage, Cook's D, best-subsets, R², AIC and BIC.
Contingency Table — chi-square, expected counts, row / column percentages and a mosaic plot.
Principal Components — loadings and variance explained, with a scree plot and biplot.
Clustering — K-means and hierarchical, with dendrograms.
Control Charts — I-MR and X̄ with control limits and all eight Nelson rules.
Attribute Charts — p and c charts with variable-width limits for unequal subgroup sizes.
CUSUM & EWMA — tabular CUSUM with FIR head start, and EWMA with time-varying limit widths.
Process Capability — Cp, Cpk, Pp, Ppk and PPM, with within and overall sigma reported side by side.
30+ chart types — histogram, box, violin, density, ECDF, Q-Q, scatter with OLS/LOESS, treemap, mosaic, Pareto and more.
Point-and-click throughout — and equally native on a Mac, where Minitab is Windows-first.
Stratum's Professional edition includes SPC control charts and full process-capability analysis (Cp, Cpk, Pp, Ppk, and PPM) alongside the everyday toolkit — descriptive statistics, ANOVA, correlation, contingency tests, and regression with diagnostics — plus data mining (decision trees, random forests, boosted trees, clustering) and multivariate methods (PCA, correspondence analysis, MANOVA). Import your .csv, .xlsx, fixed-width ASCII, SPSS .sav or Stata .dta and try it on your own process data first.
Yes — both are in the Professional edition. Nine control charts with all eight Nelson rules and Phase I/II staging, and capability reporting Cp, Cpk, CPL, CPU, Cpm, Pp, Ppk, PPL, PPU, PPM and Z-bench, each with a confidence interval, plus a capability histogram.
The indices match. The confidence intervals can differ in the second decimal, because Stratum inverts the exact noncentral t where Minitab uses Bissell's normal approximation to it. The validation record documents the difference and the reference values behind it.
No — Stratum is a one-time purchase. You can upgrade from Standard to Professional later.
 Stratum