Feature tour
Stratum covers the full arc of data work — import, wrangle, explore, test, model, and present — without ever leaving a single, fast, native window.
Get data in, shape it the way you need, and keep it reproducible.
CSV/TSV with automatic delimiter detection and ≥90% type inference, plus native Excel (.xlsx) import.
100+ functions — math, strings, dates, binning, recoding, lag/lead, per-column aggregates — in re-editable, live-recomputed columns.
A persistent, dockable panel with All / Any / None compound logic, multi-key sort, and a master enable switch.
Join, stack (wide↔tall), split, aggregate (group-by), deduplicate and sample — all non-destructive.
Z-score, min–max, ranks and percentile ranks; map and lump categorical levels in a click.
Save data, analyses, filters and styling together in one .stratum file.
A chart type for every question — distributions, relationships, comparisons and composition — each with live controls and clean export.
Histograms, box & violin plots, density & ridgeline, ECDF, dot/strip, and Q-Q plots.
Scatter with OLS/LOESS fits, bubble charts, trend lines, rectangular/hex heatmaps, and smooth contour plots.
Dot plots, dumbbell (DNA) charts, and slopegraphs — compare values across items, groups and stages.
Pie/donut, stacked & grouped bars, Pareto, mosaic, and treemaps for parts of a whole.
Parallel-coordinates plots for many-variable rows, plus PCA scree and biplot views.
The tests you actually use, with parametric and nonparametric options.
Full descriptive reports; Pearson & Spearman matrices with CIs, p-values and correction.
Two-sample t / Welch / paired, Mann-Whitney & Wilcoxon, one- and two-way ANOVA with post-hoc, MANOVA.
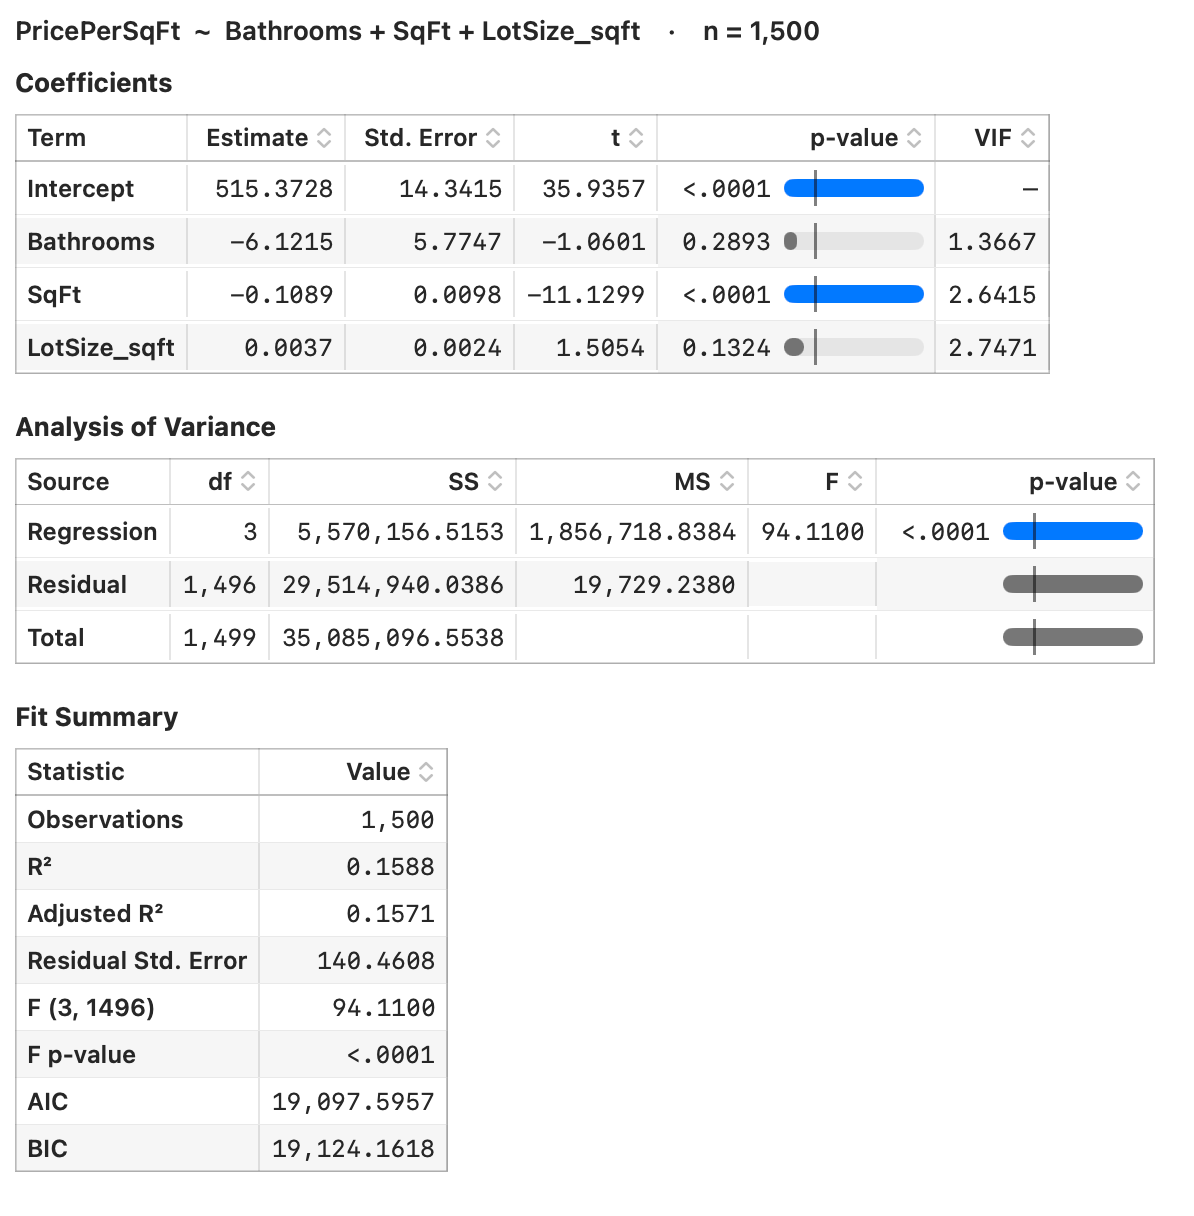
Chi-square contingency & differences analysis; linear regression with VIF, leverage, Cook's D and best-subsets.
From the factory floor to predictive models — built in.
I-MR, X-bar R/S, p/np, c/u, CUSUM and EWMA, with all eight Nelson rules and out-of-control highlighting.
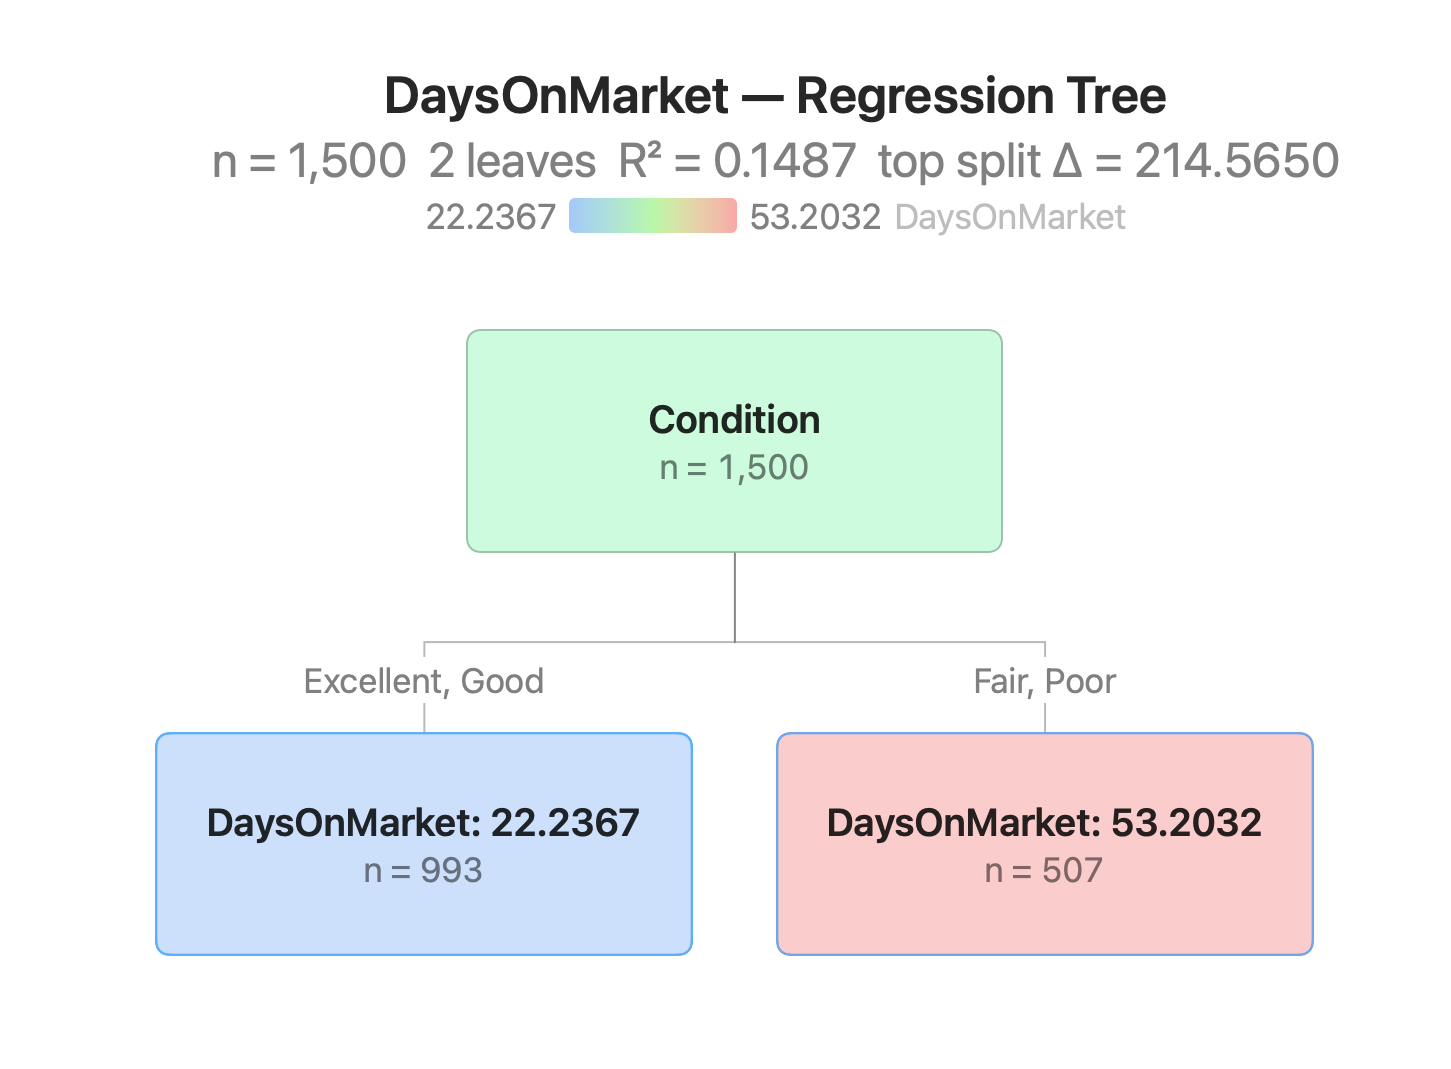
Decision trees, random forests and boosted trees — pure-Swift, with feature importance and prediction columns.
Principal components with scree & biplot; K-means and hierarchical clustering with dendrograms.
Designed to stay fast and legible, and to produce work you can hand off.
A virtualized grid and lazy filtering keep large datasets responsive.
Independent text-size controls for the interface, the data grid and reports.
Charts to PNG/JPEG/PDF; reports to CSV/TSV/Markdown/HTML/PDF — all print-ready.
 Stratum