The Stratum Tutorial · 25 lessons
A free, self-paced course. Each lesson pairs a real dataset with a feature of Stratum: what it's for, the exact clicks to reproduce it, and the statistics behind the result.
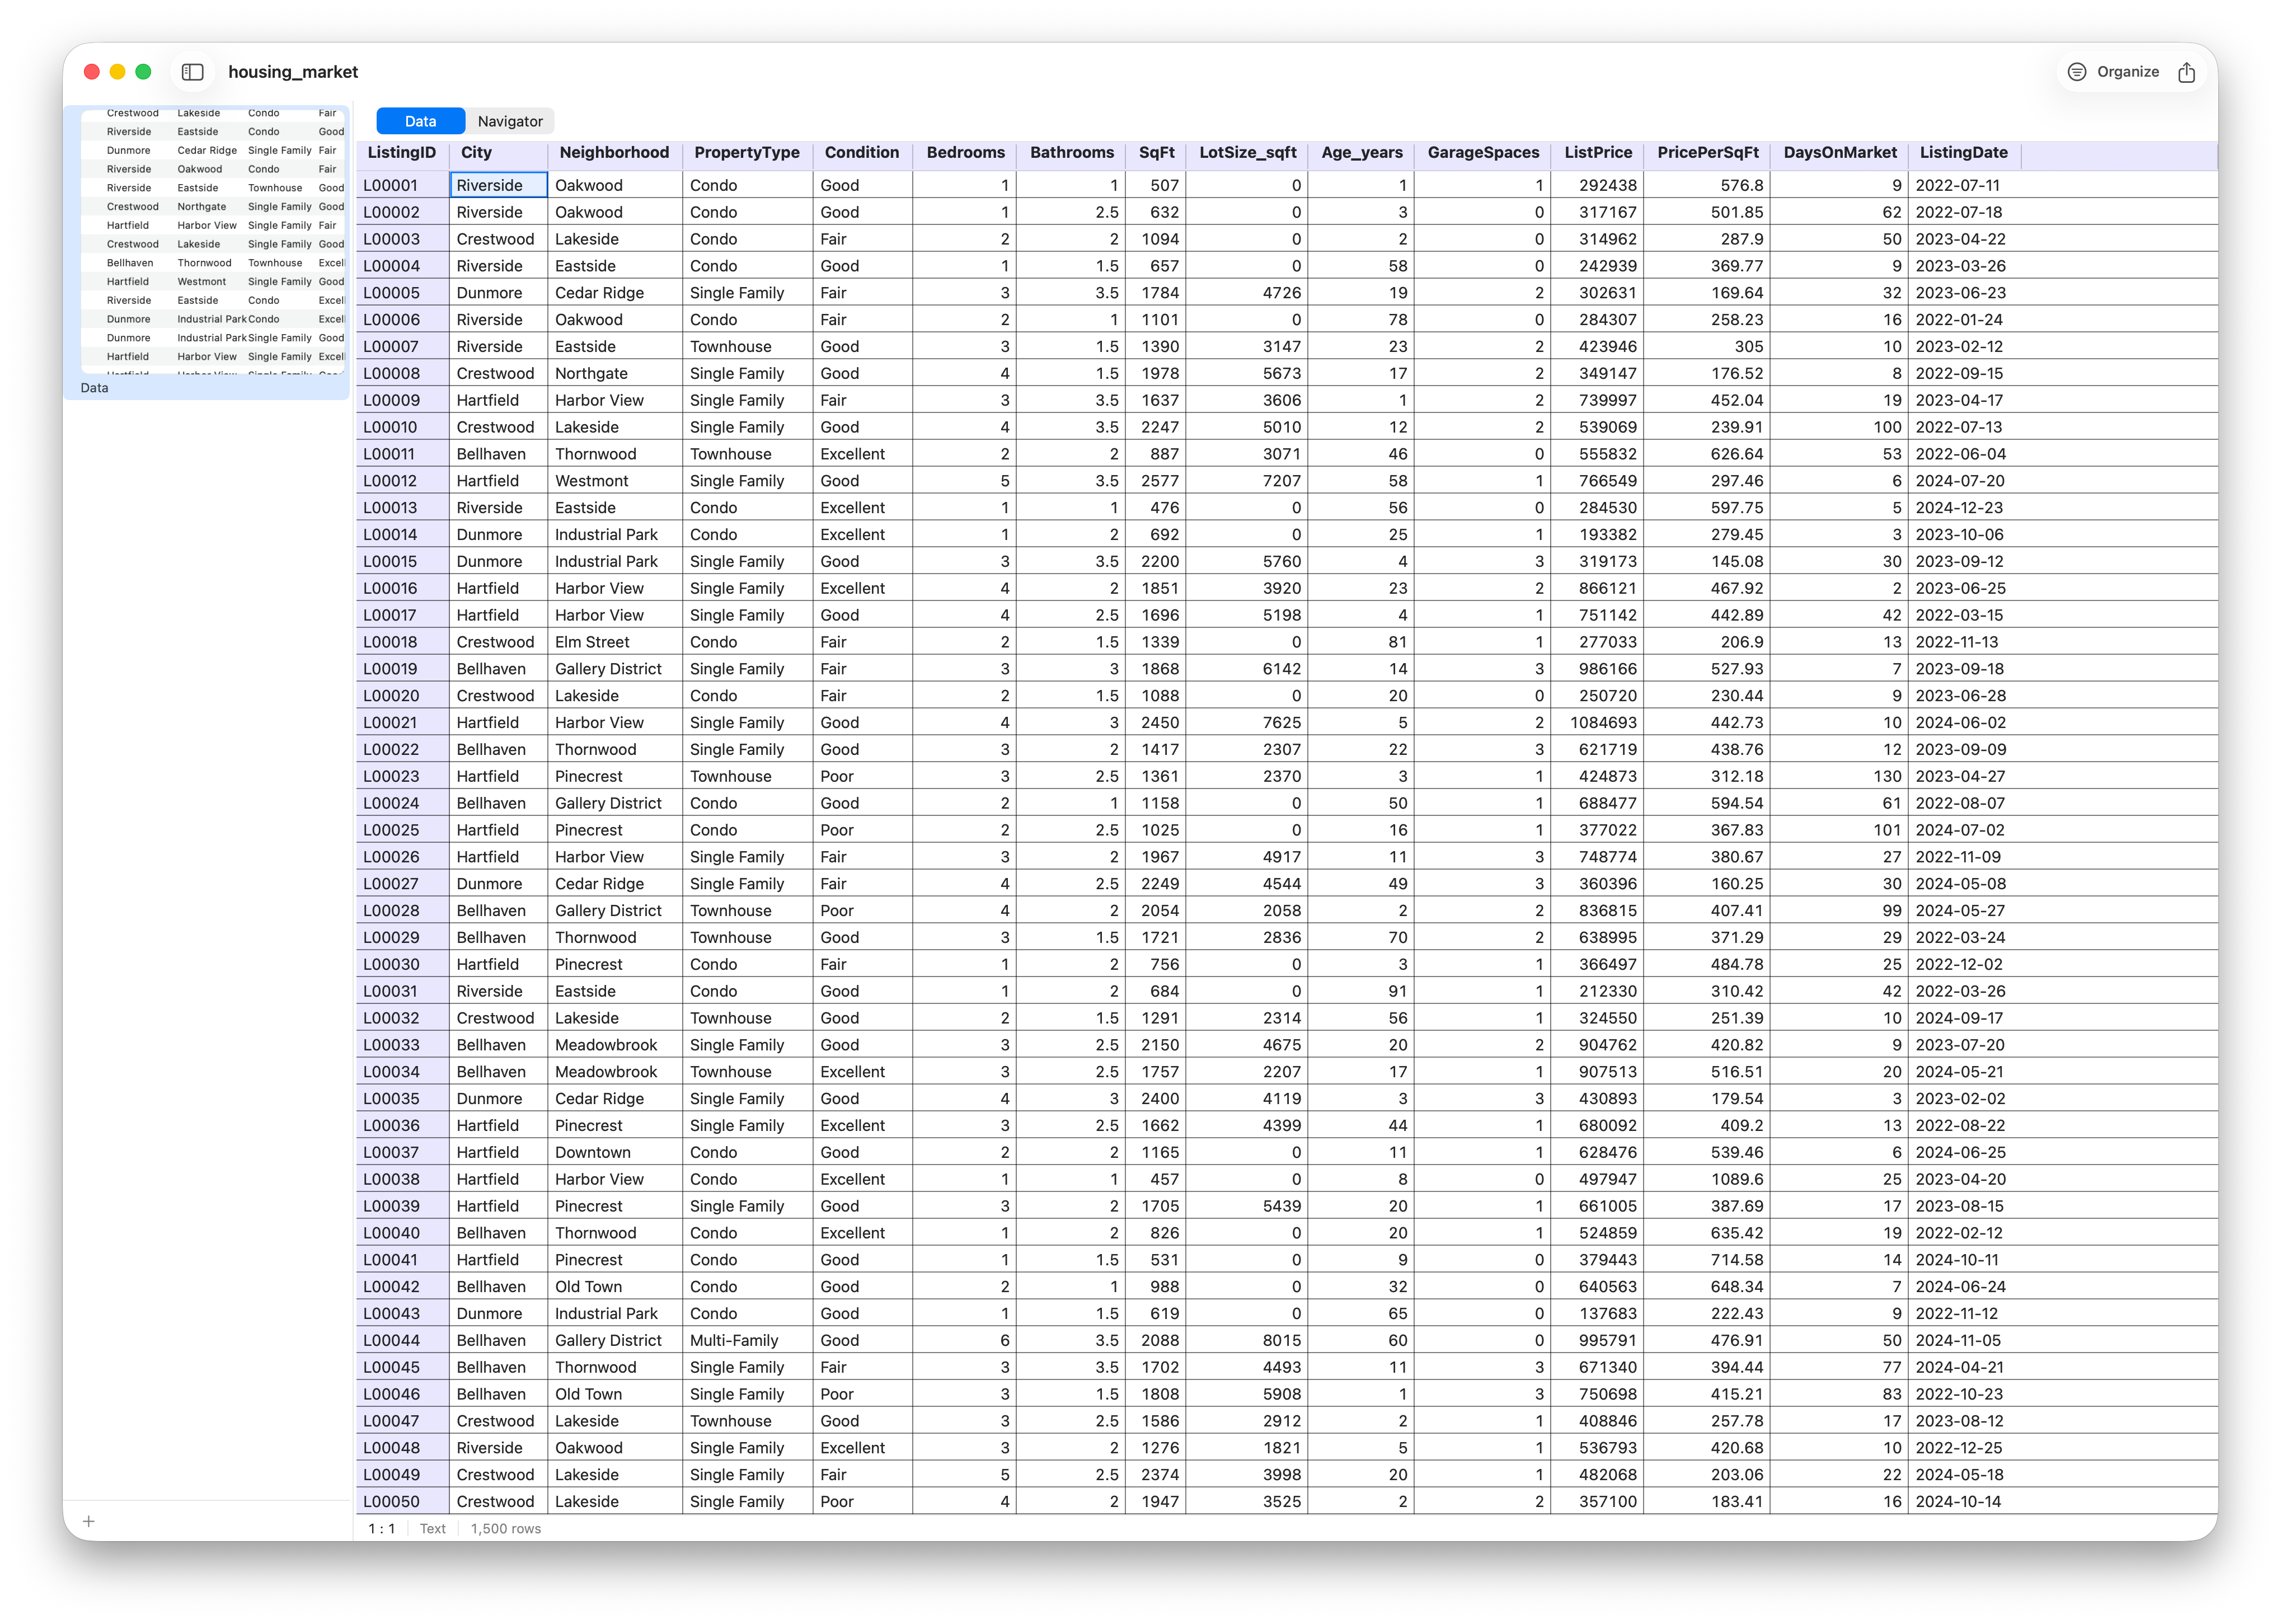
Get data into Stratum in seconds and read your first summary.
Housing dataset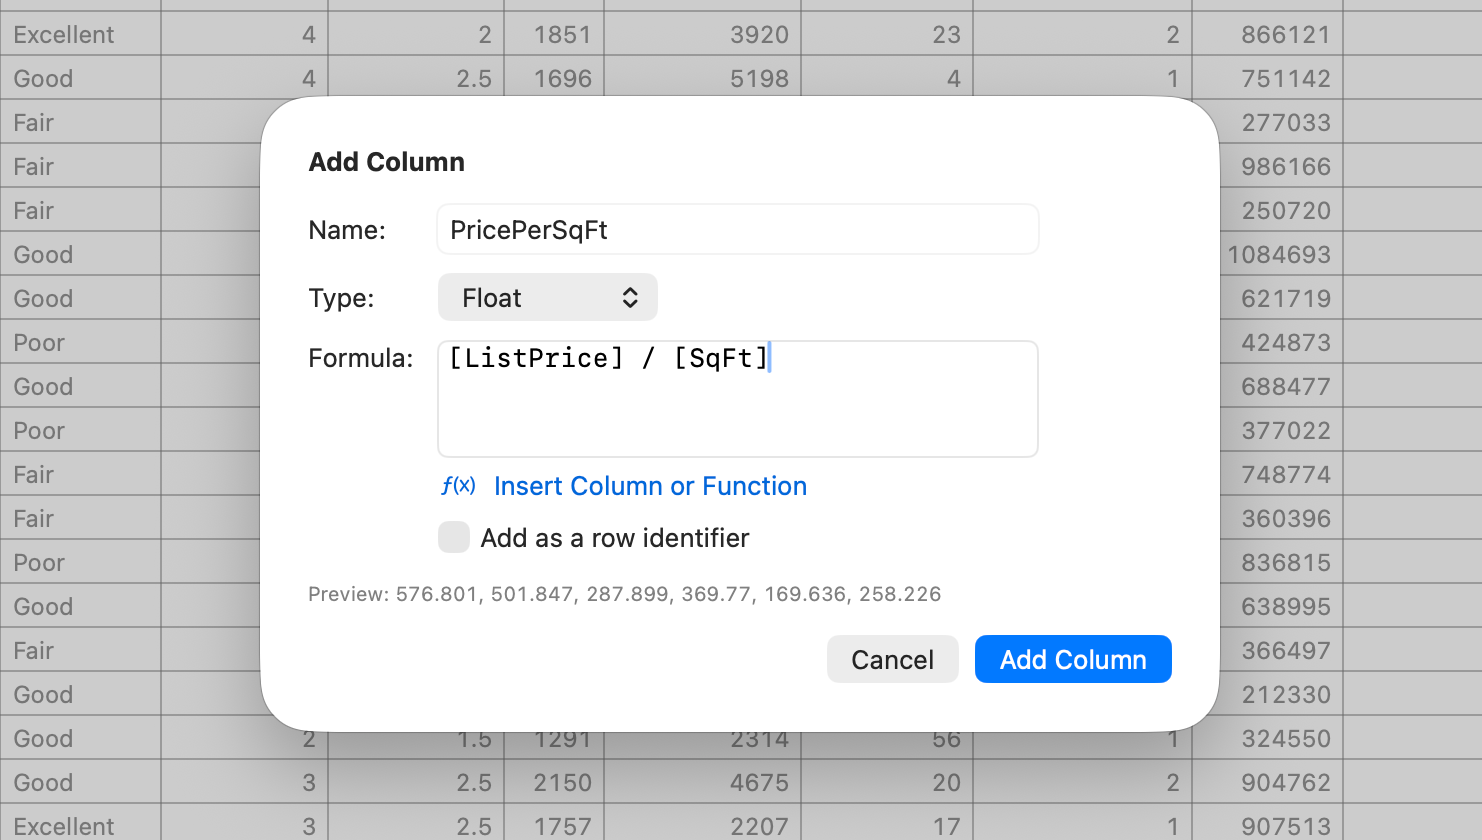
Derive new variables with 100+ functions — no SQL required.
Housing dataset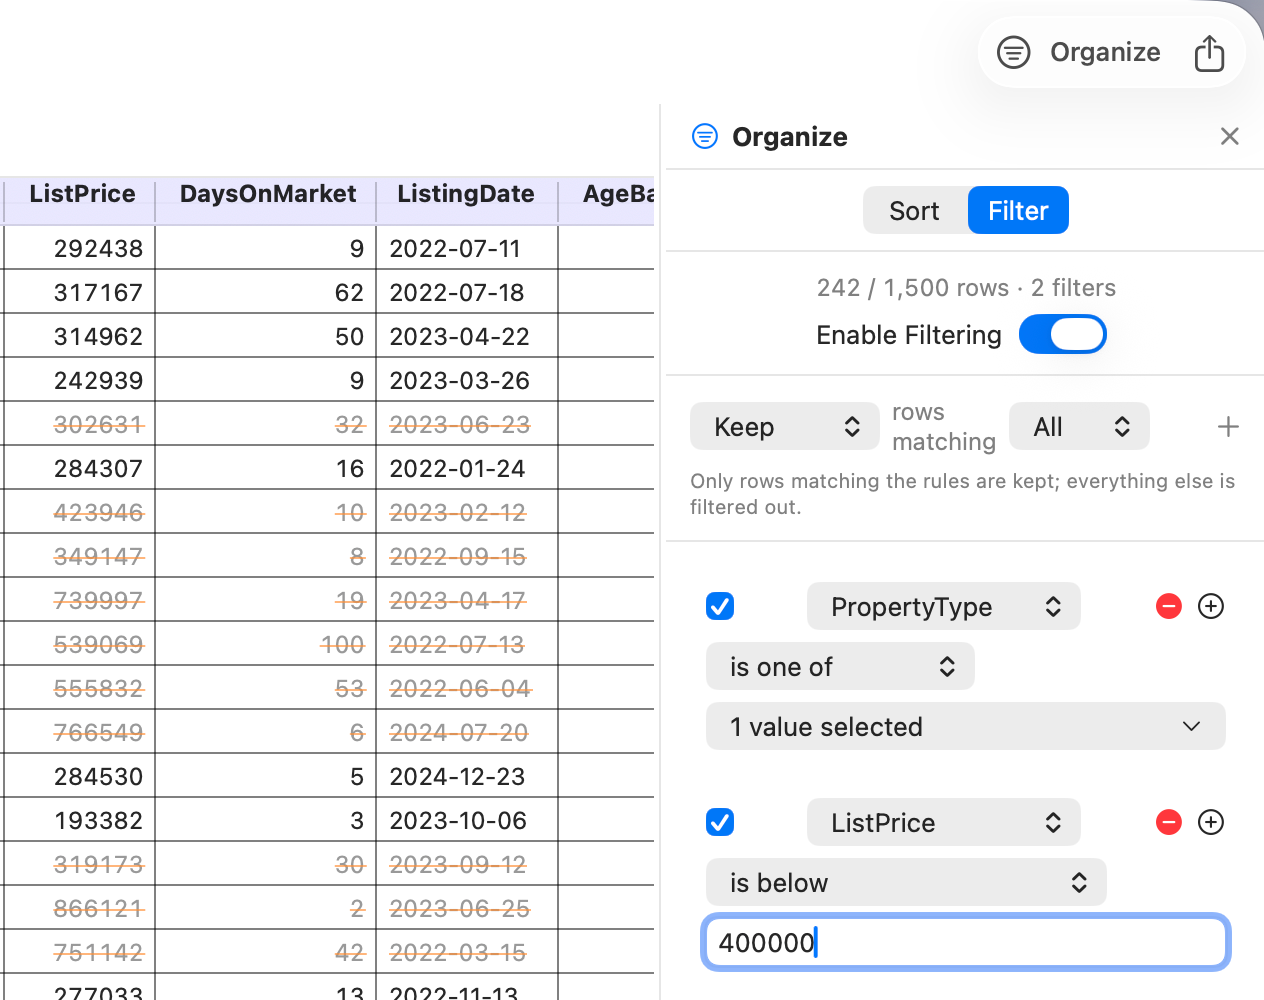
Slice data interactively with the dockable Filter Inspector.
Housing dataset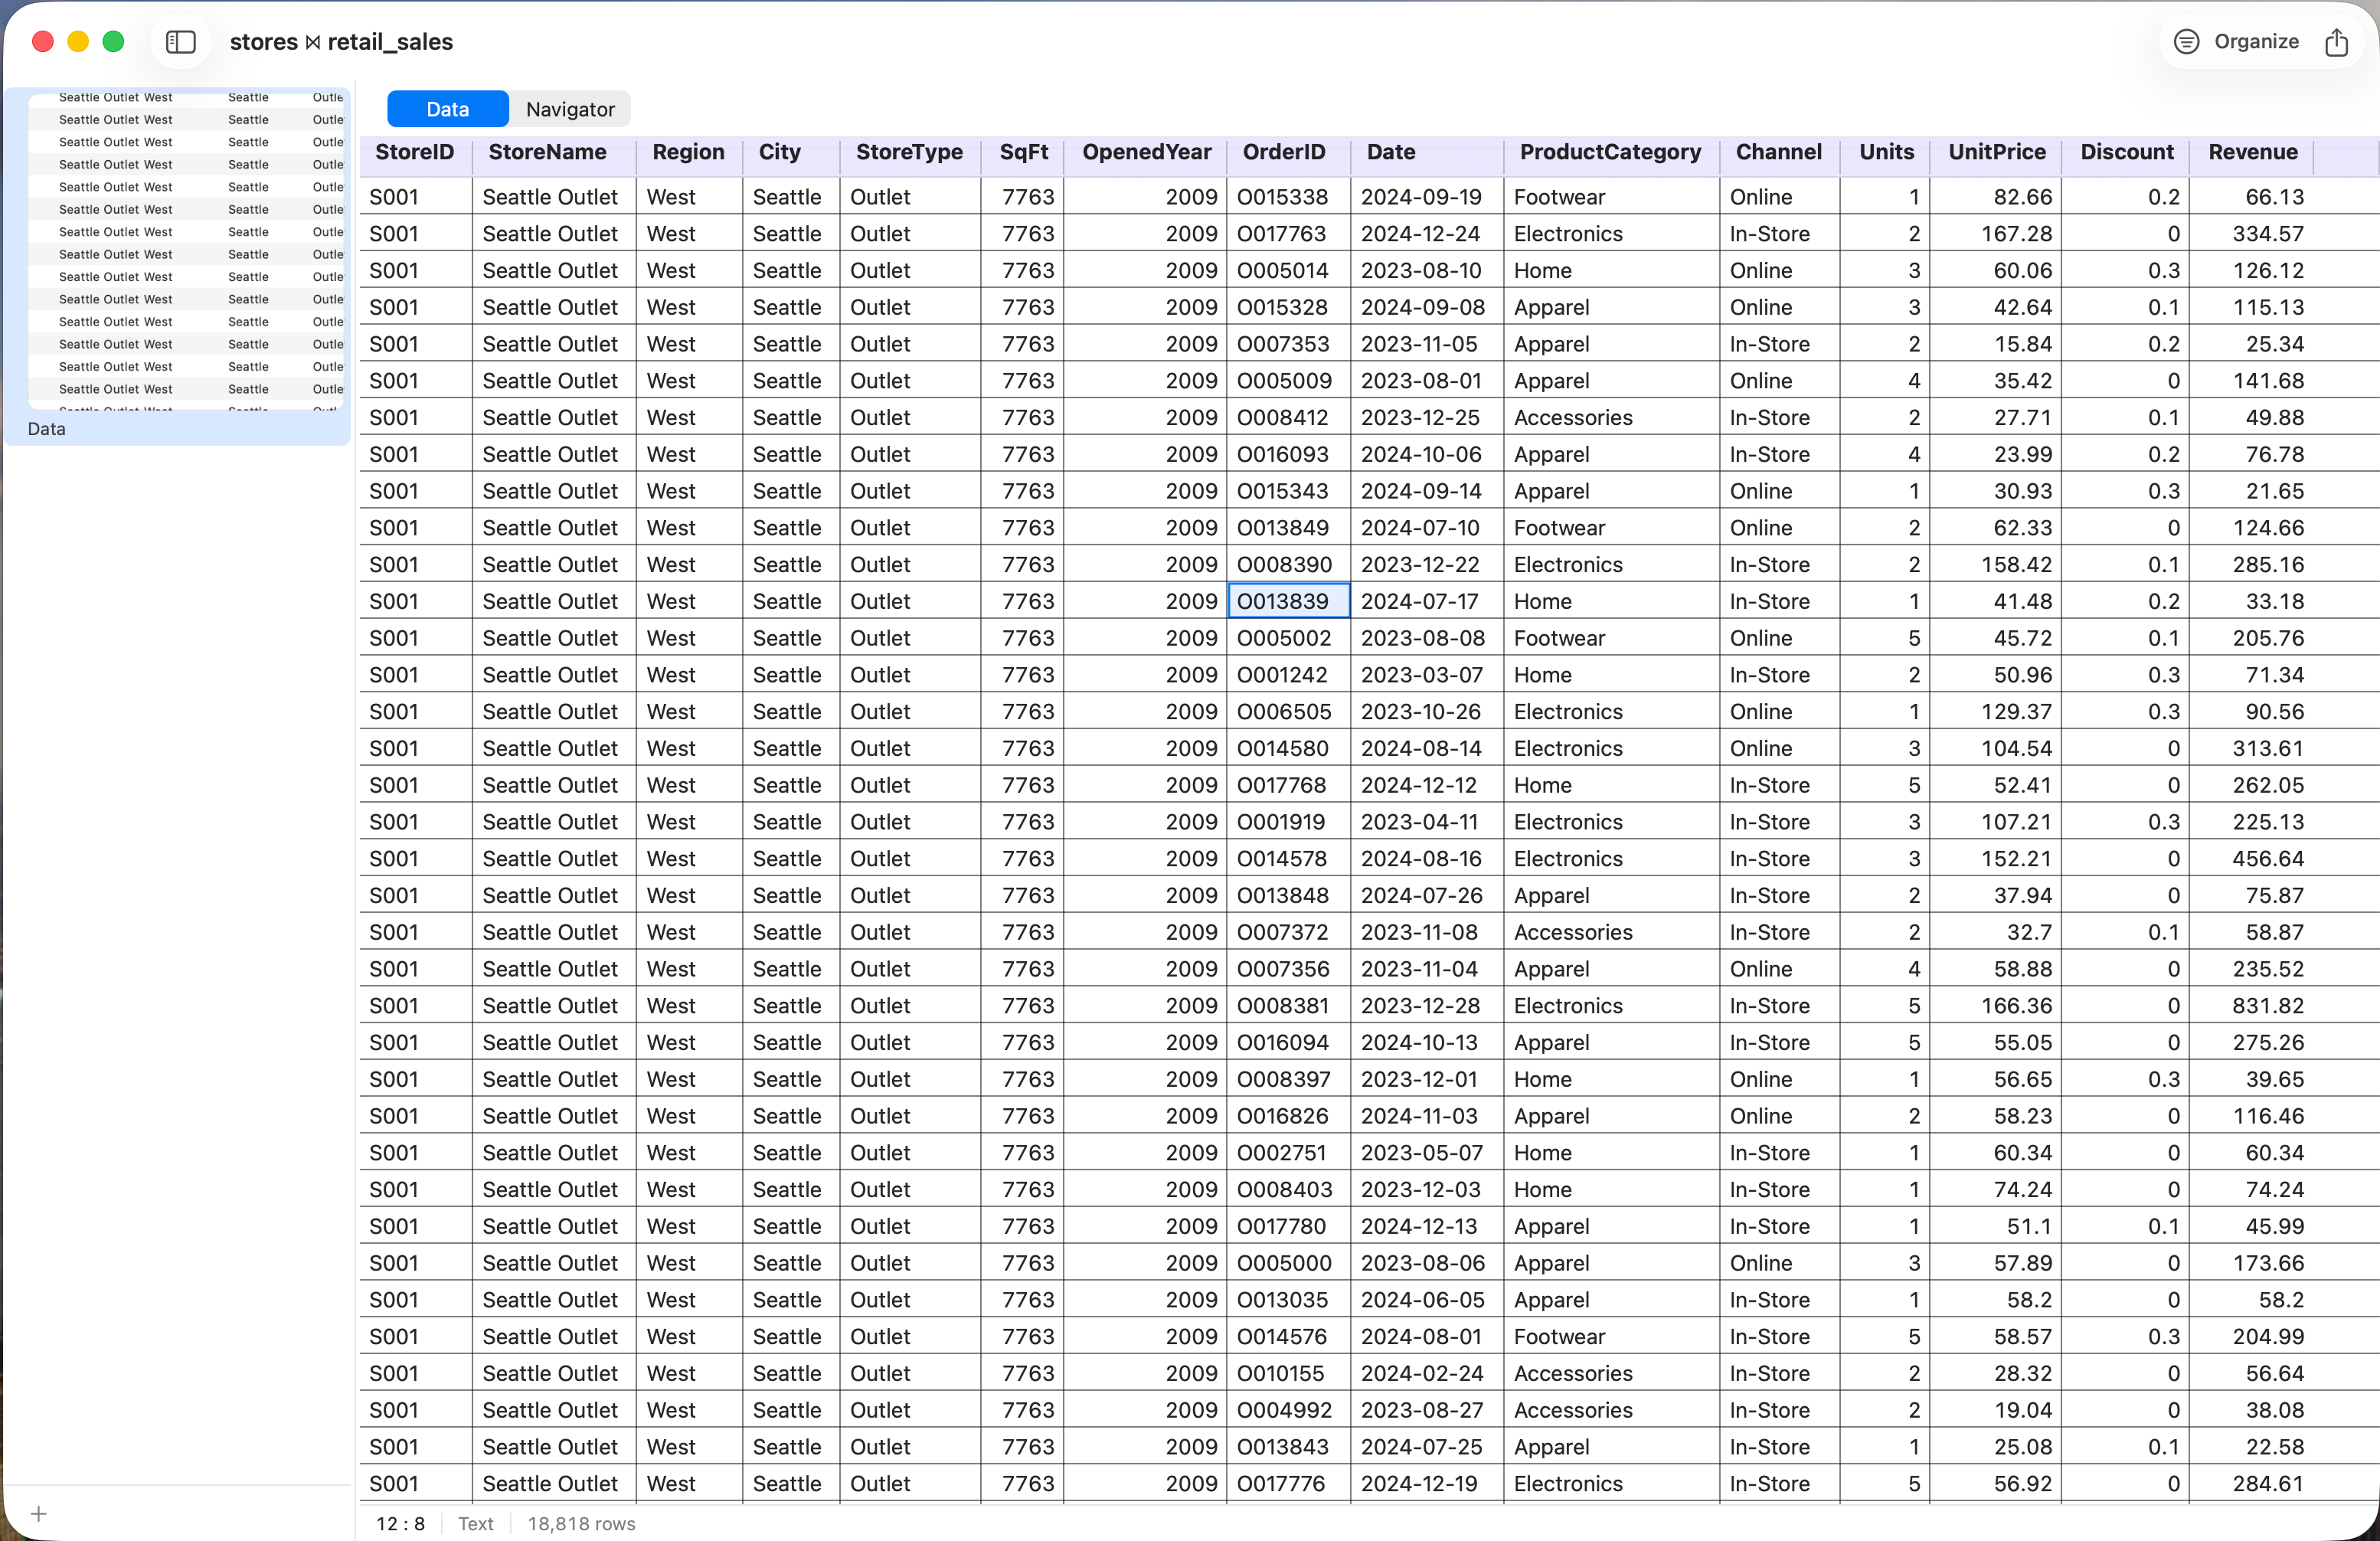
Join, stack, aggregate, dedup and sample — all in-app.
Retail dataset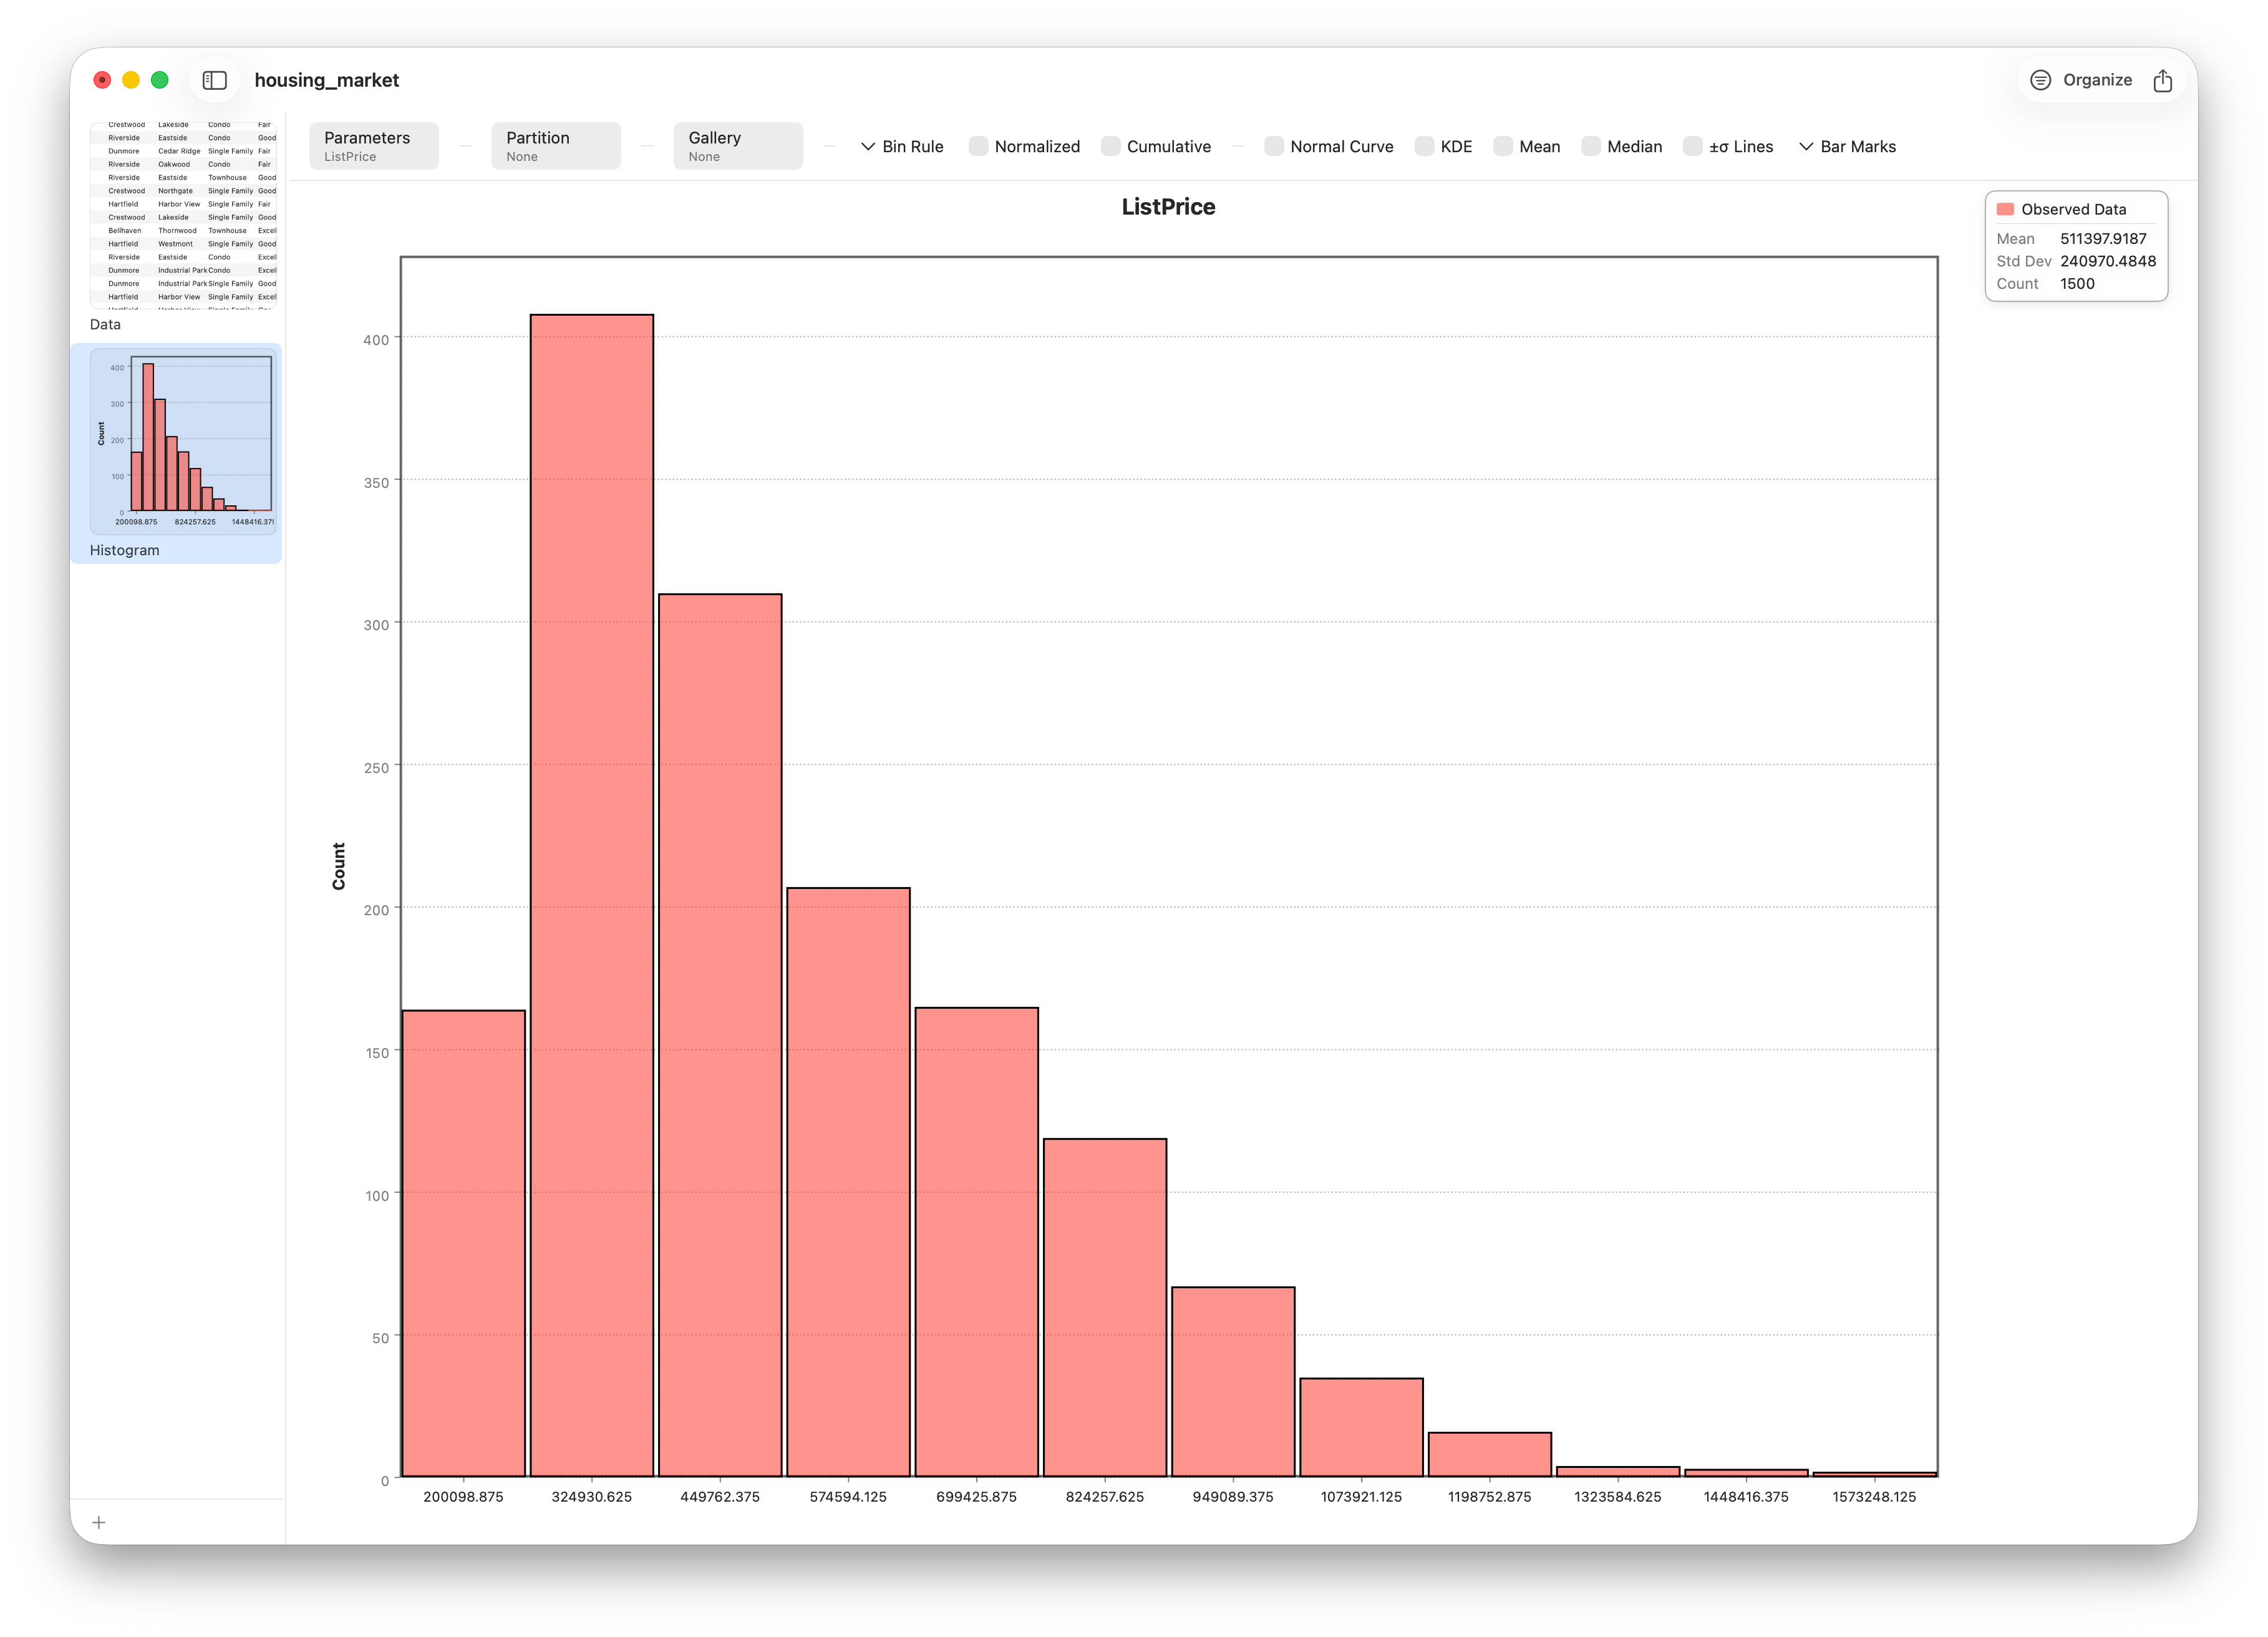
Read the shape of a variable with bins, KDE and normal overlays.
Housing dataset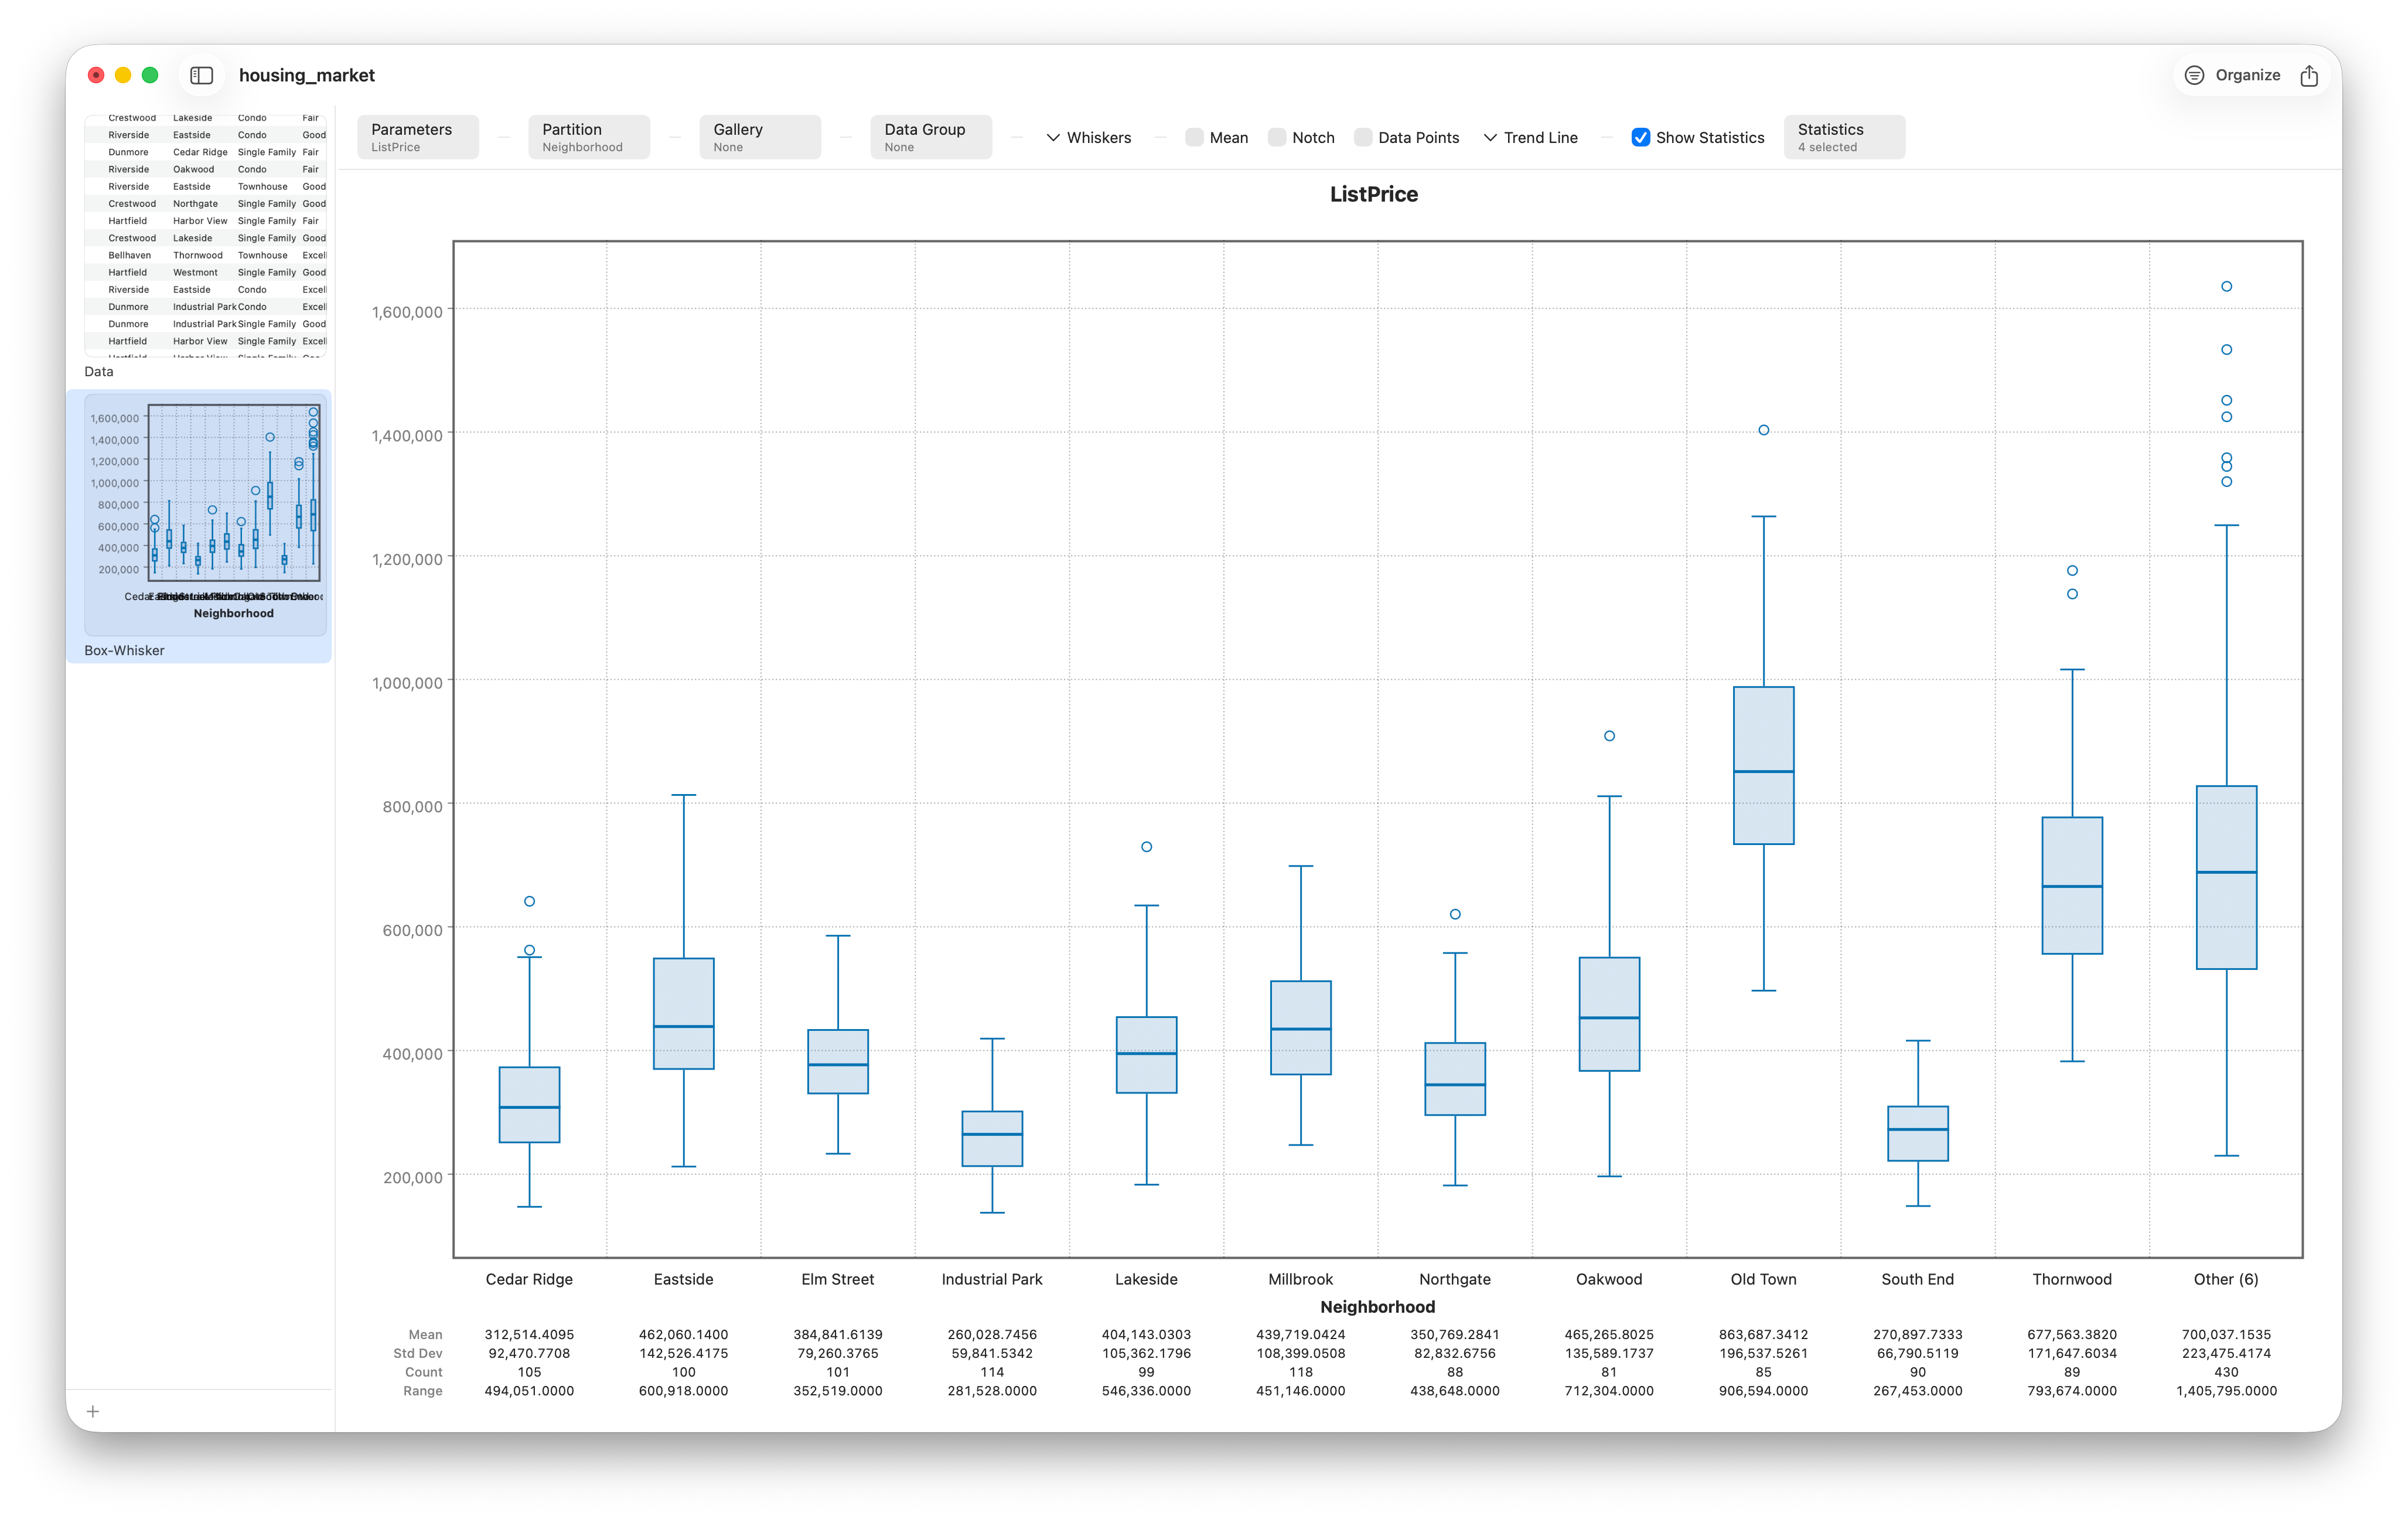
Compare groups and spot outliers.
Housing dataset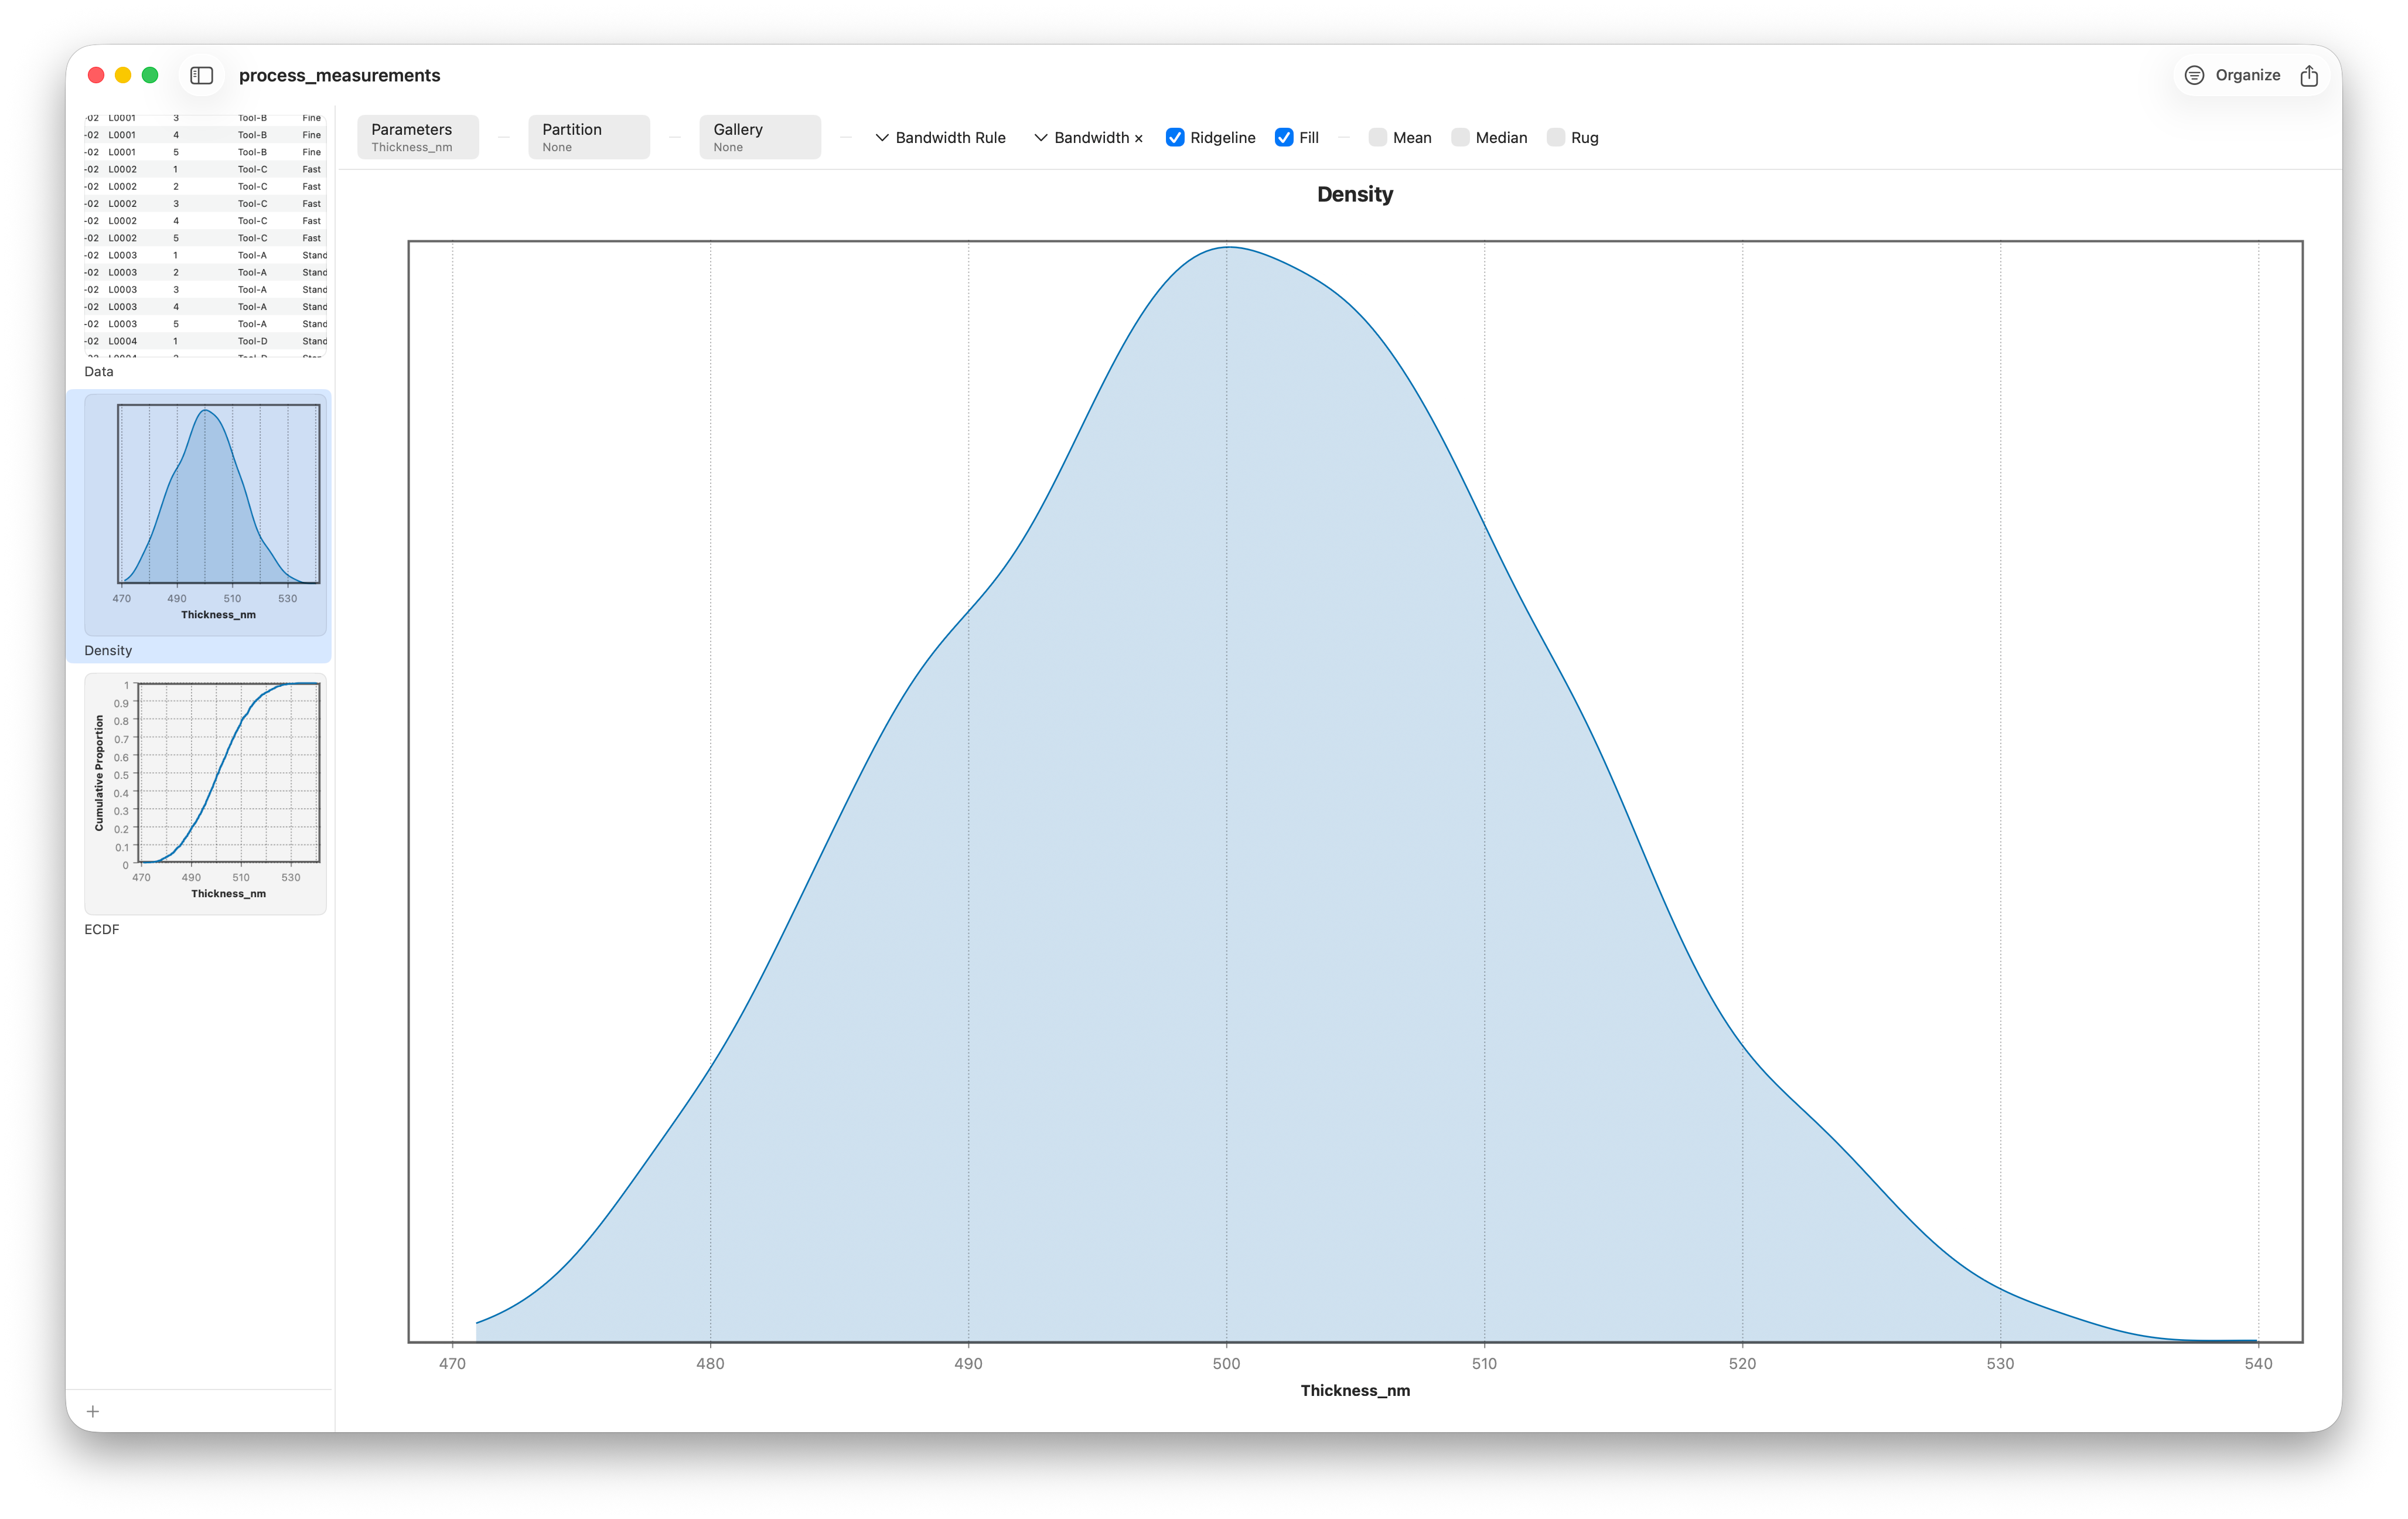
Smooth and cumulative distribution views.
Process dataset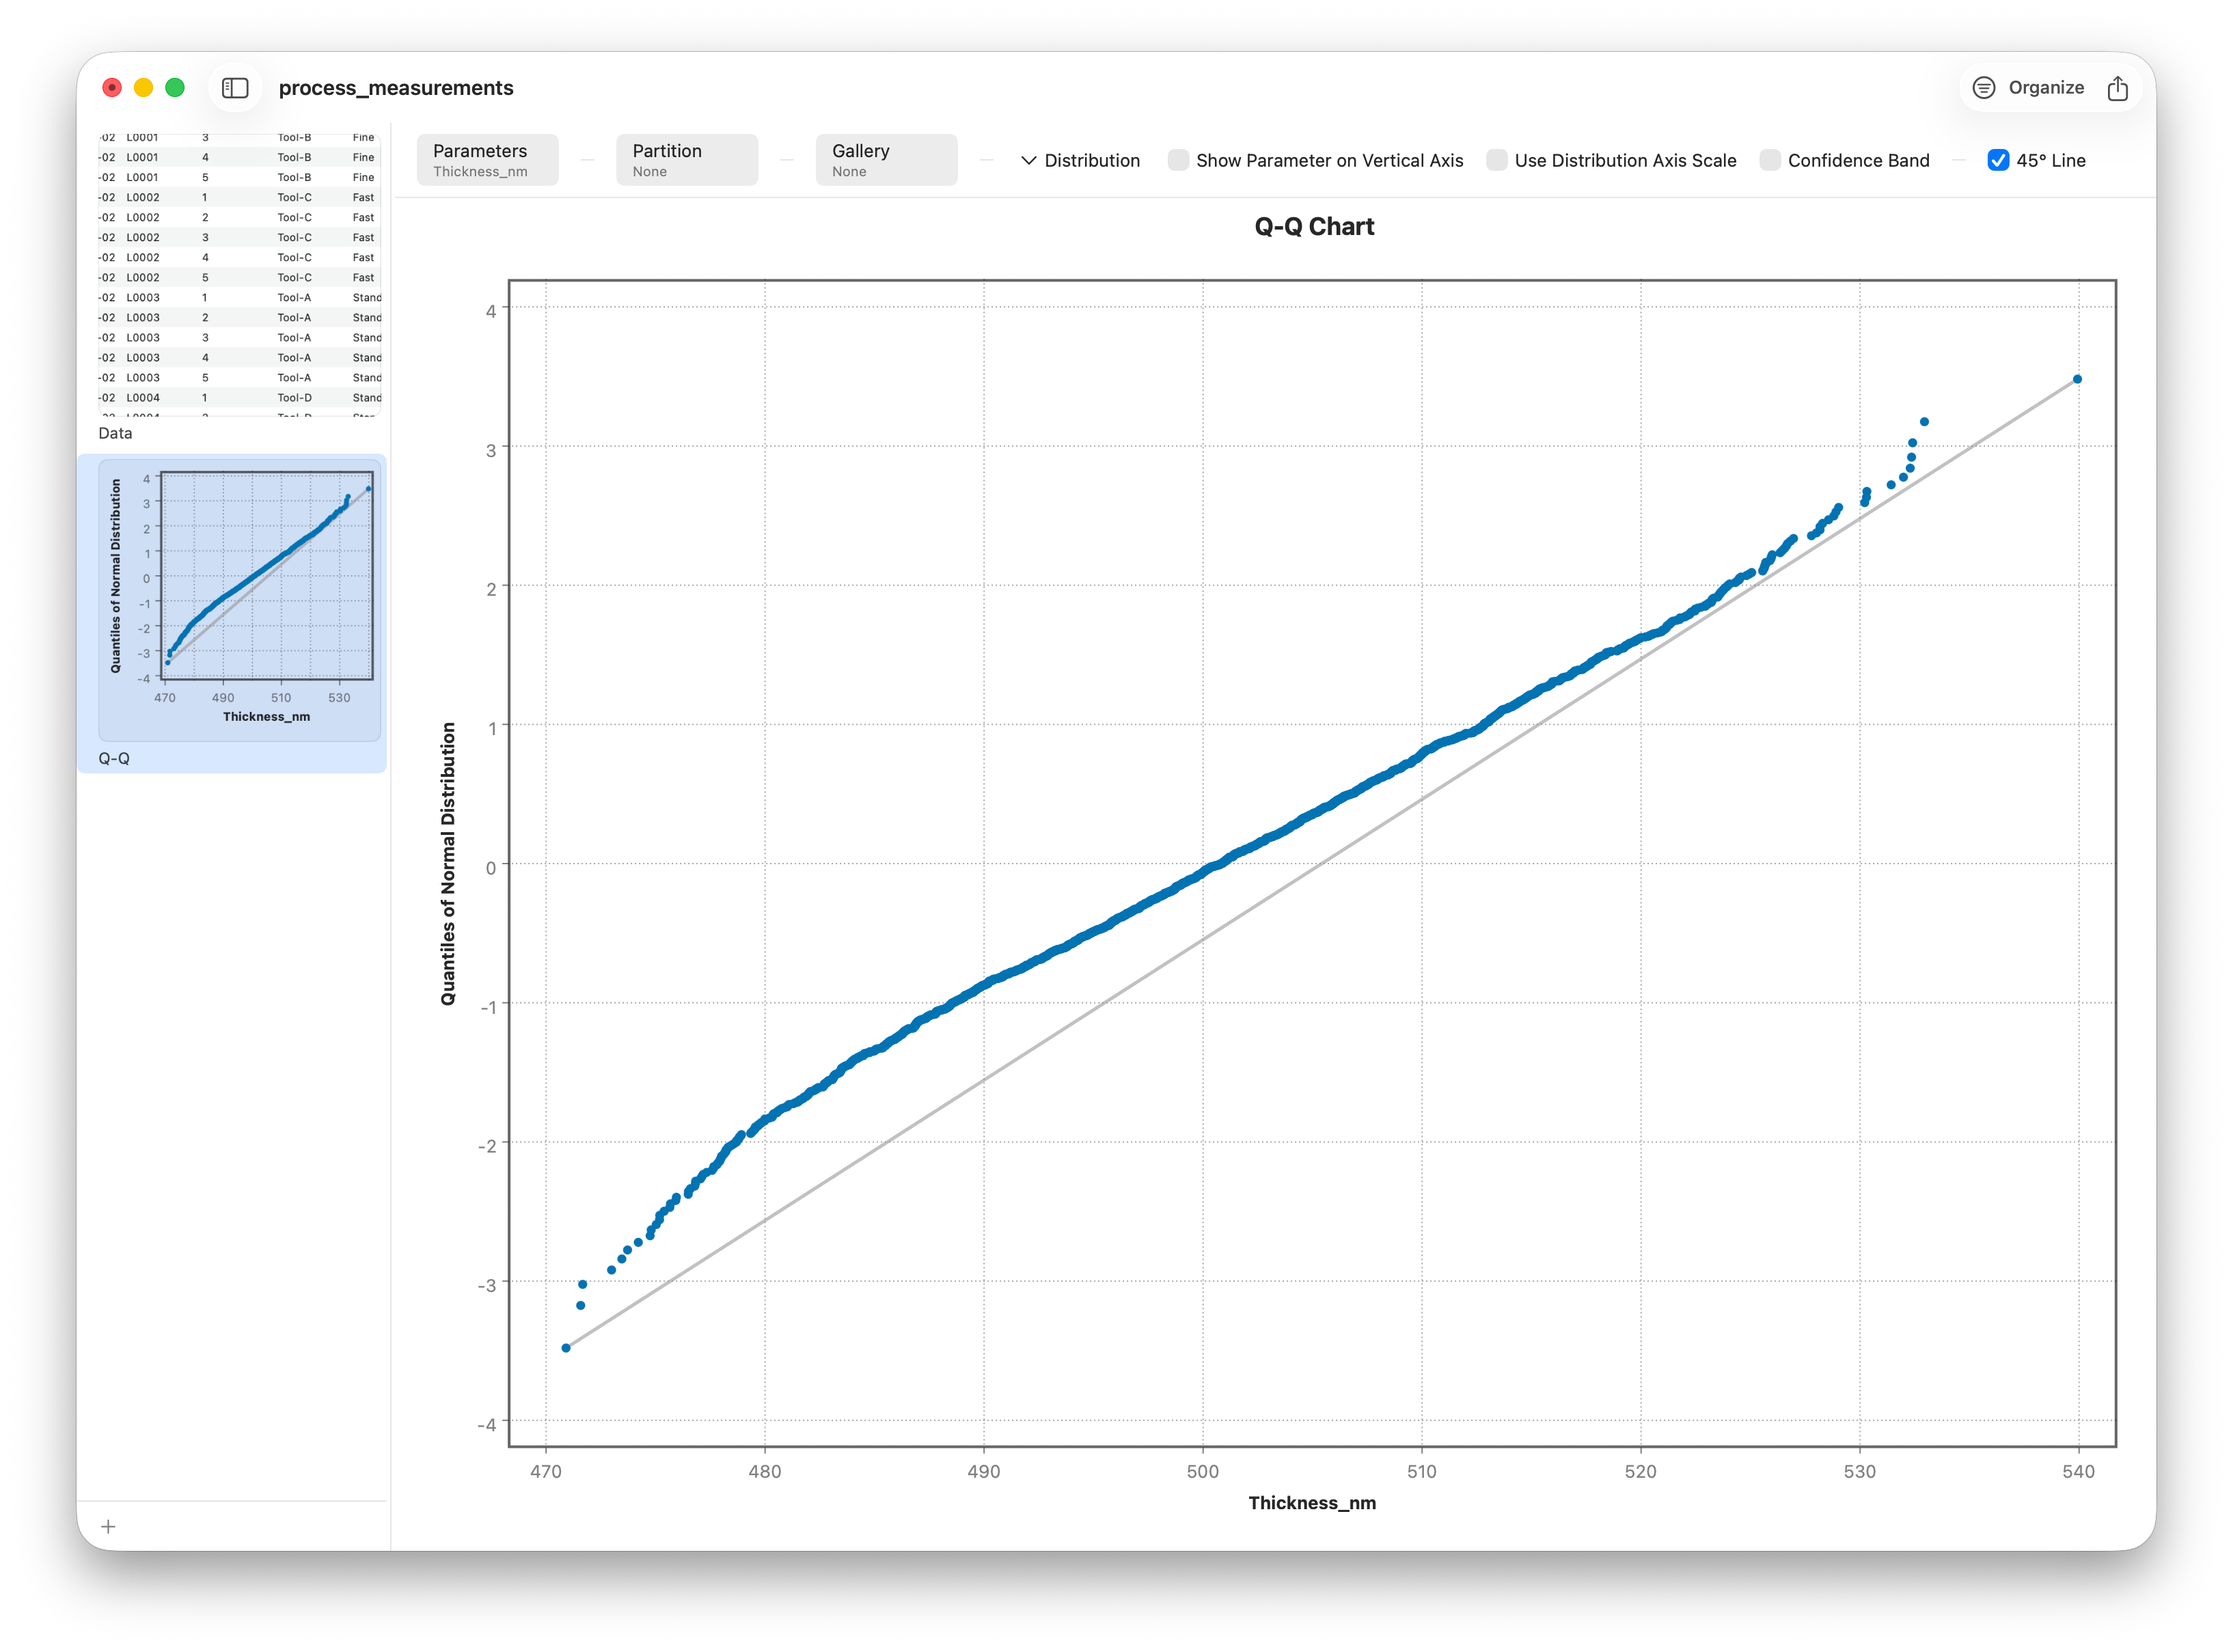
Judge whether your data is normal.
Process dataset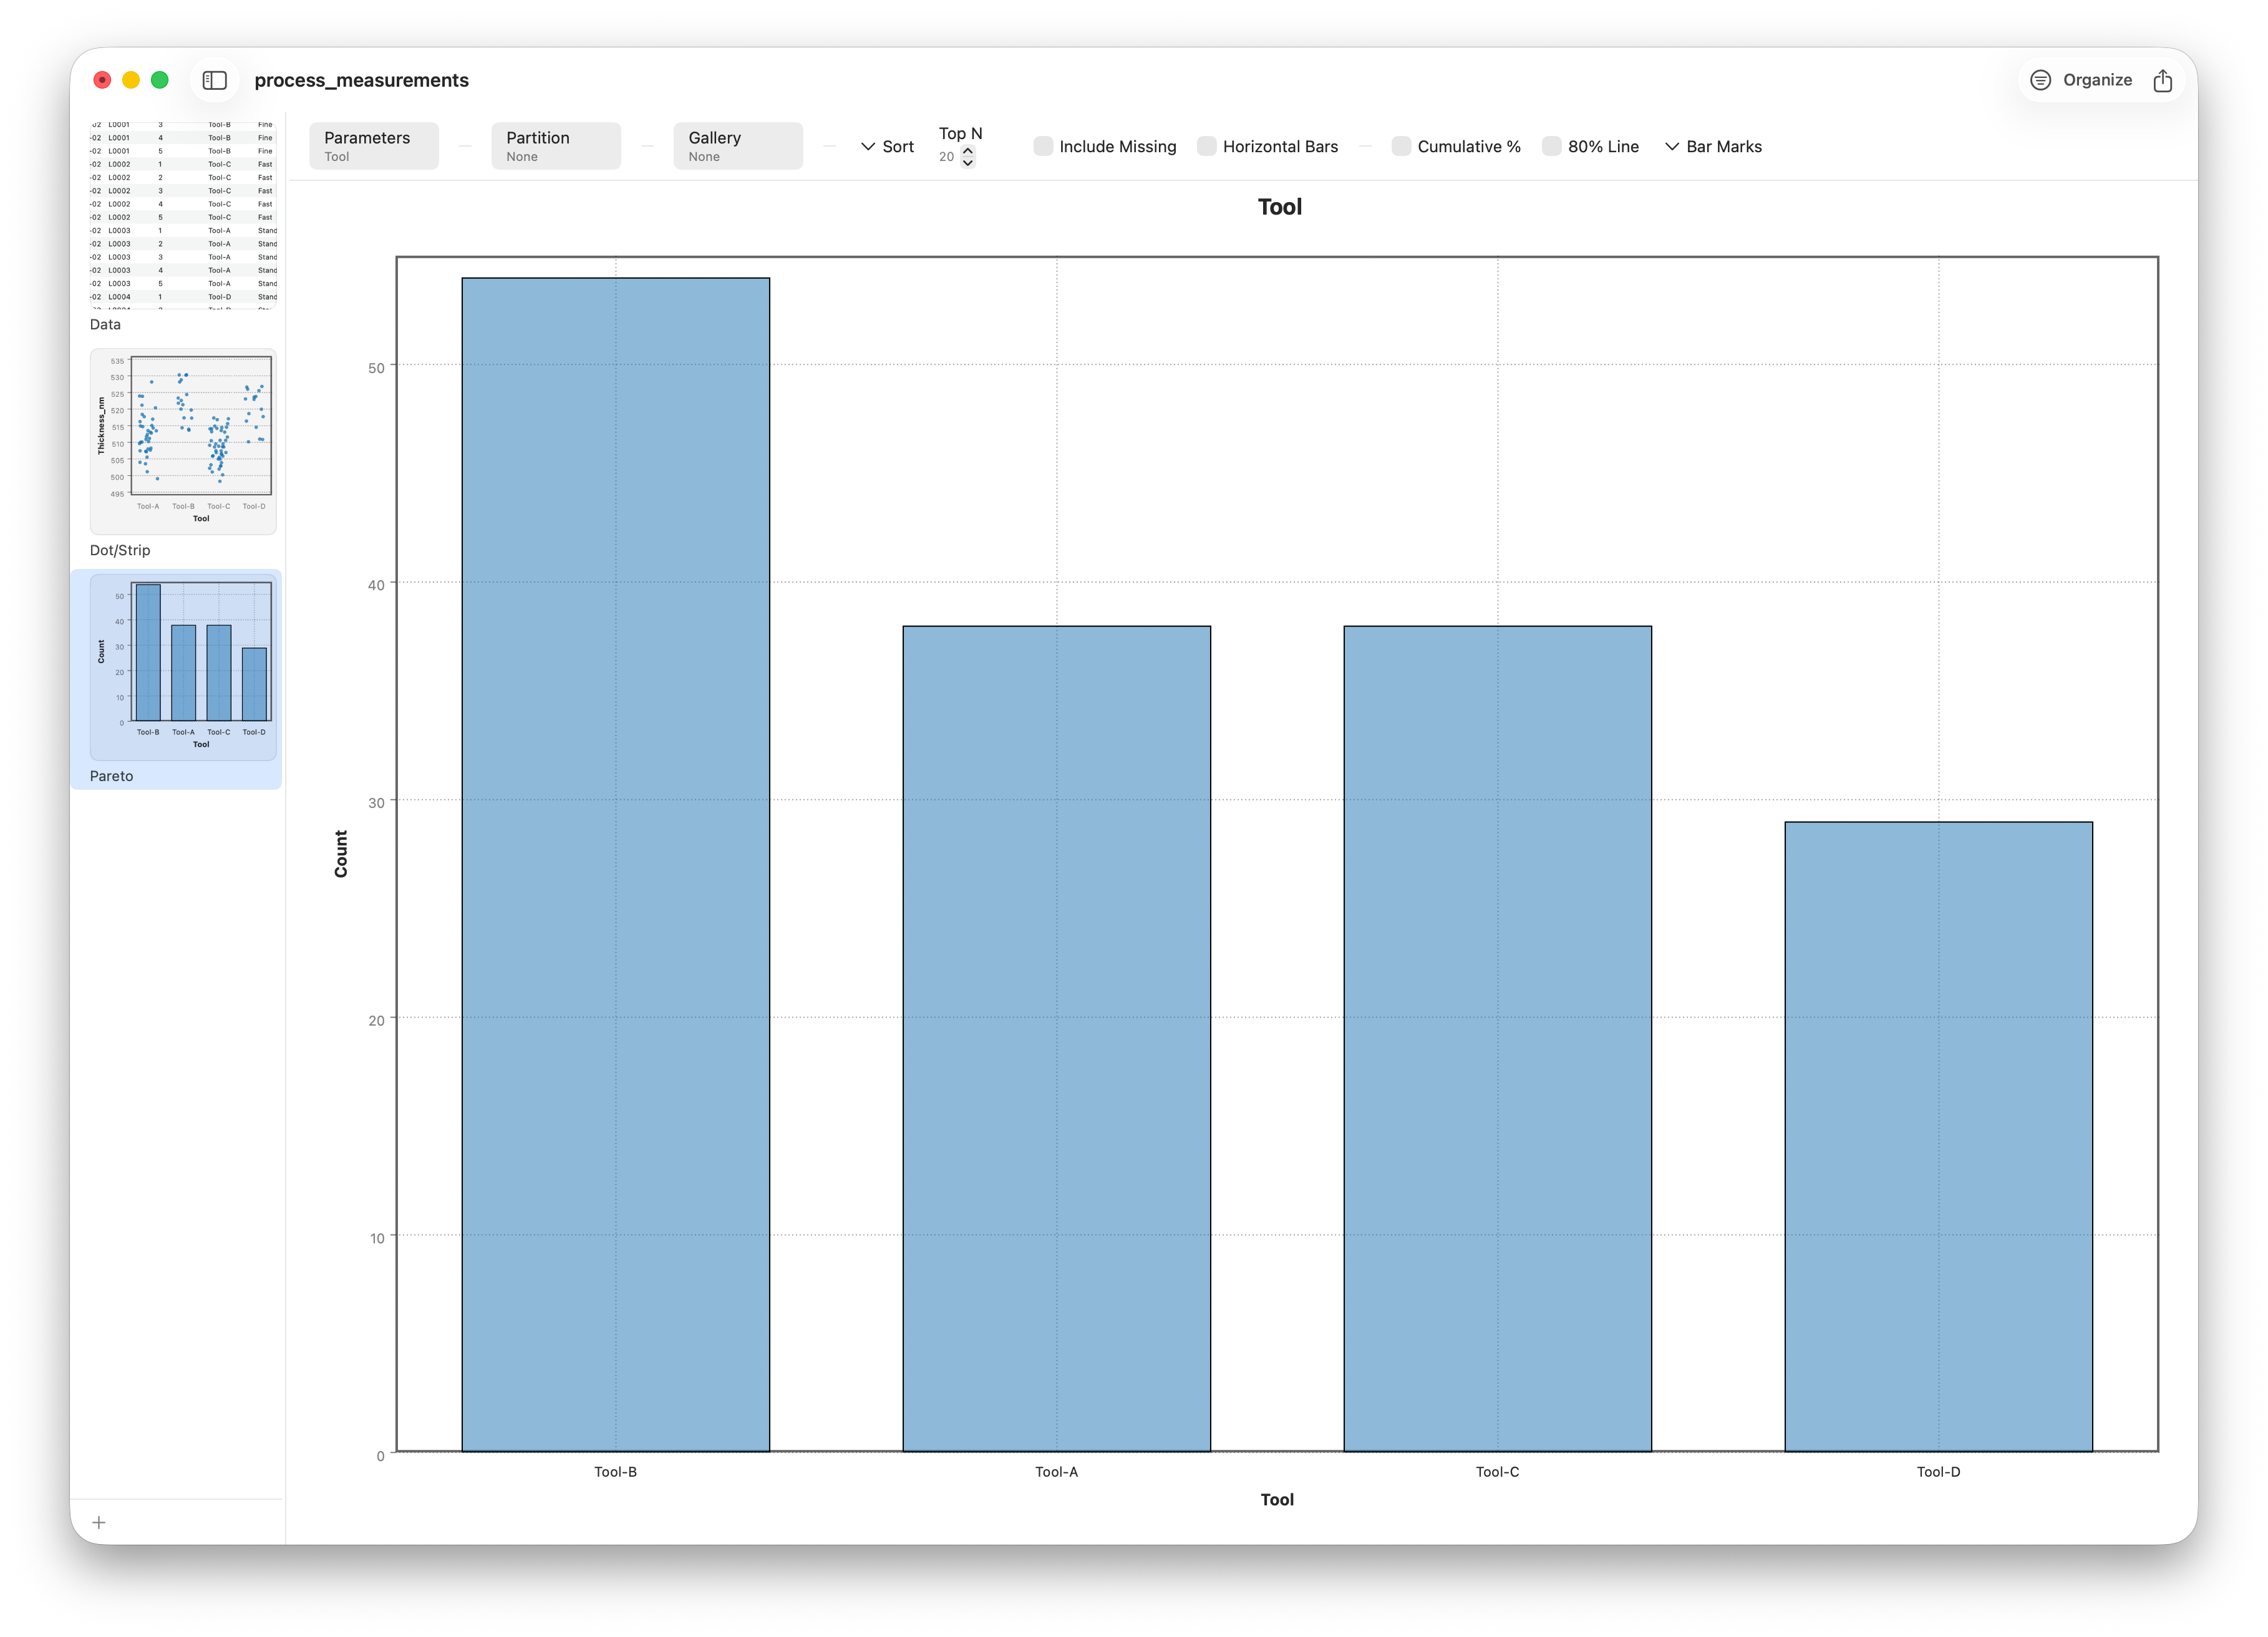
Rank categories and find the vital few.
Process dataset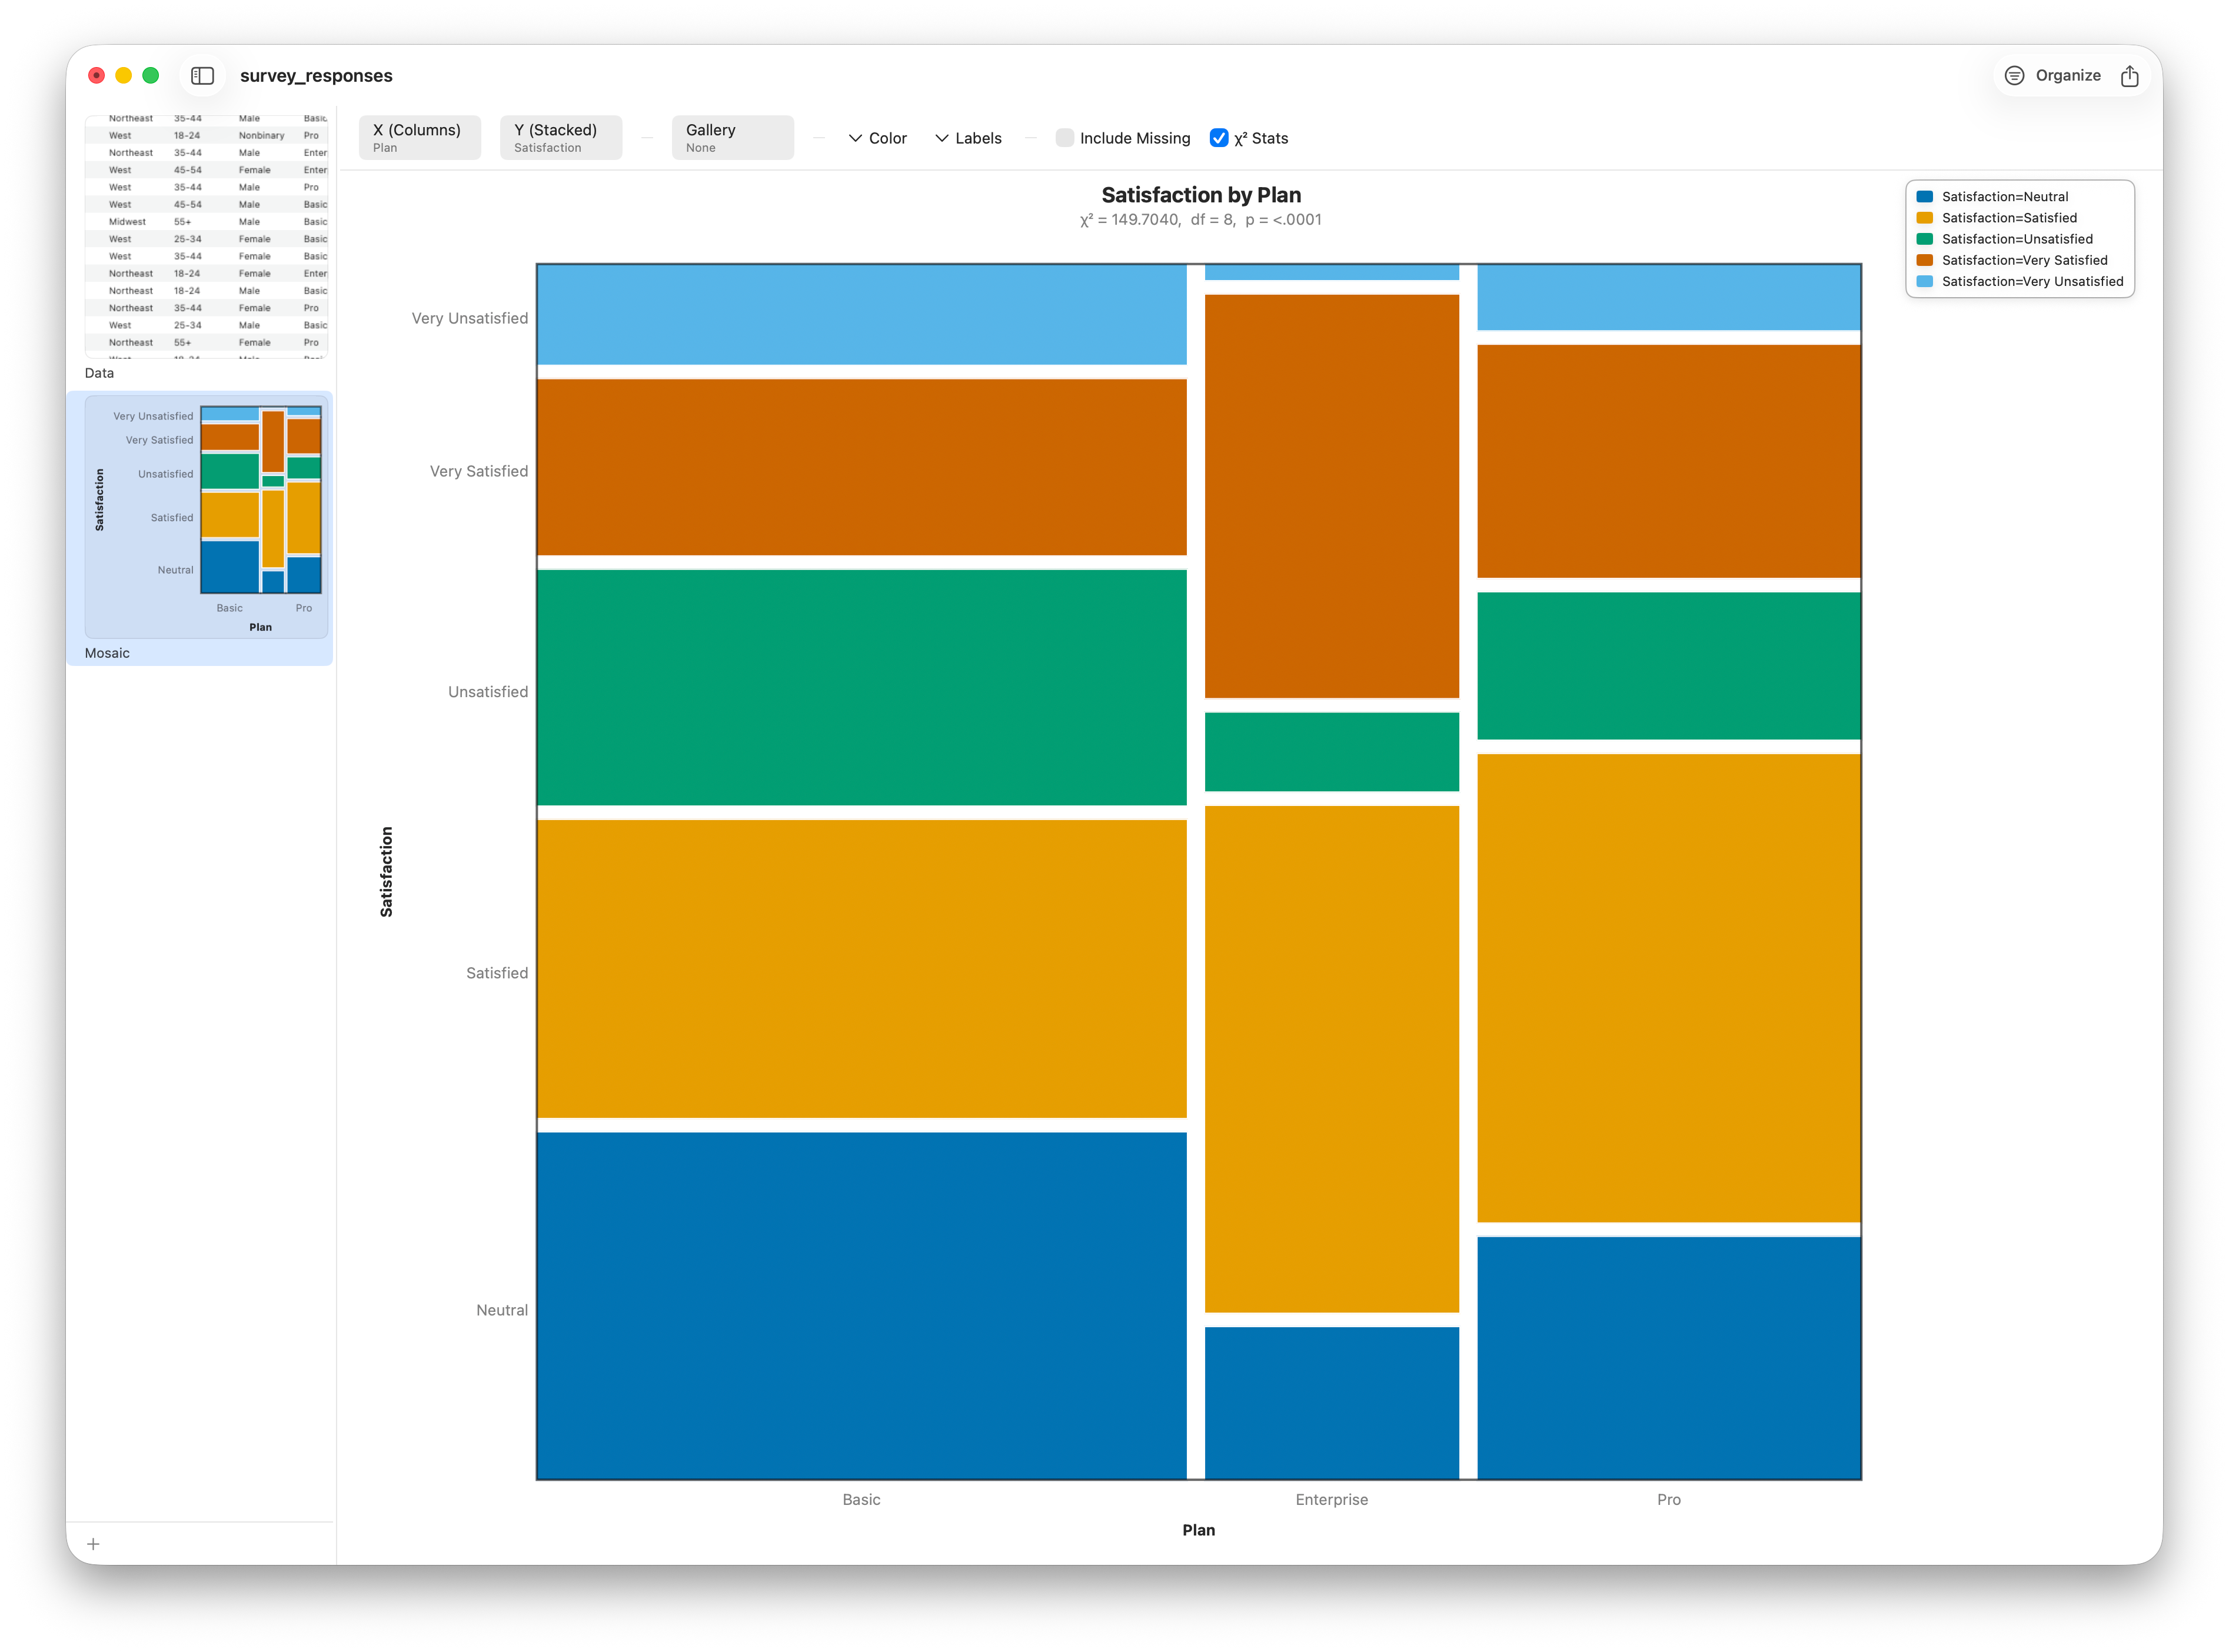
Composition and categorical association.
Survey dataset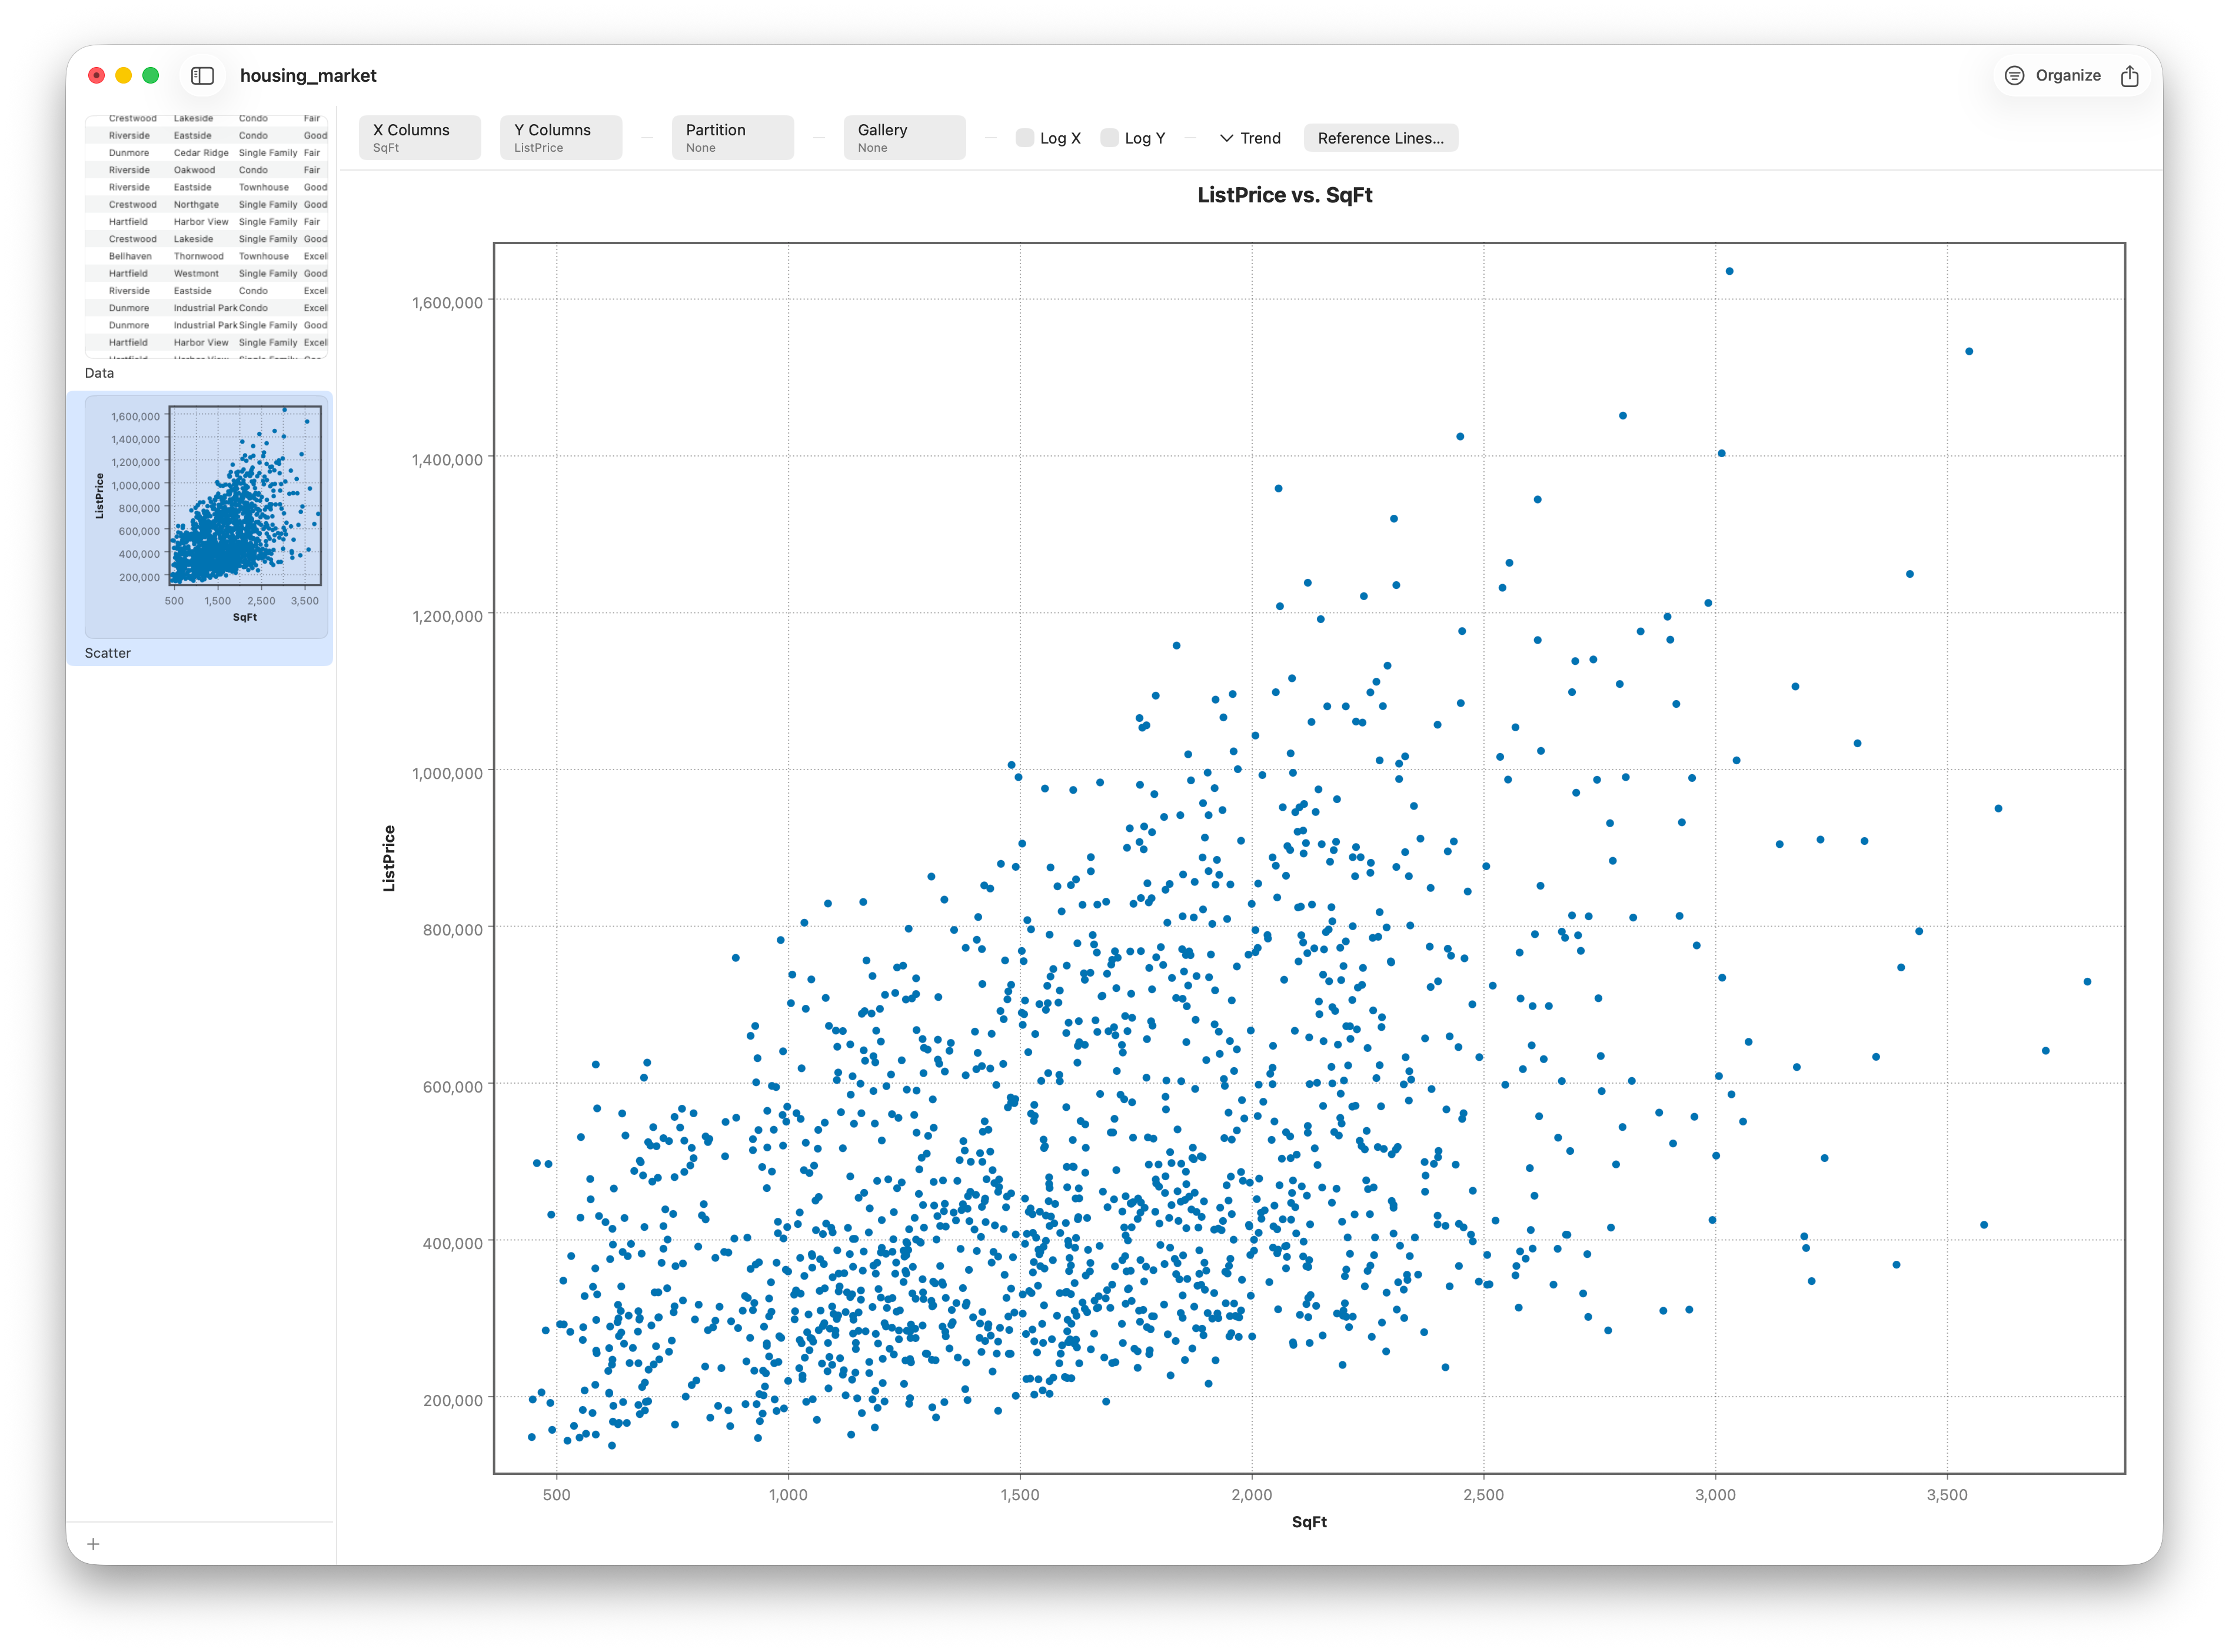
Visualize relationships between variables.
Housing dataset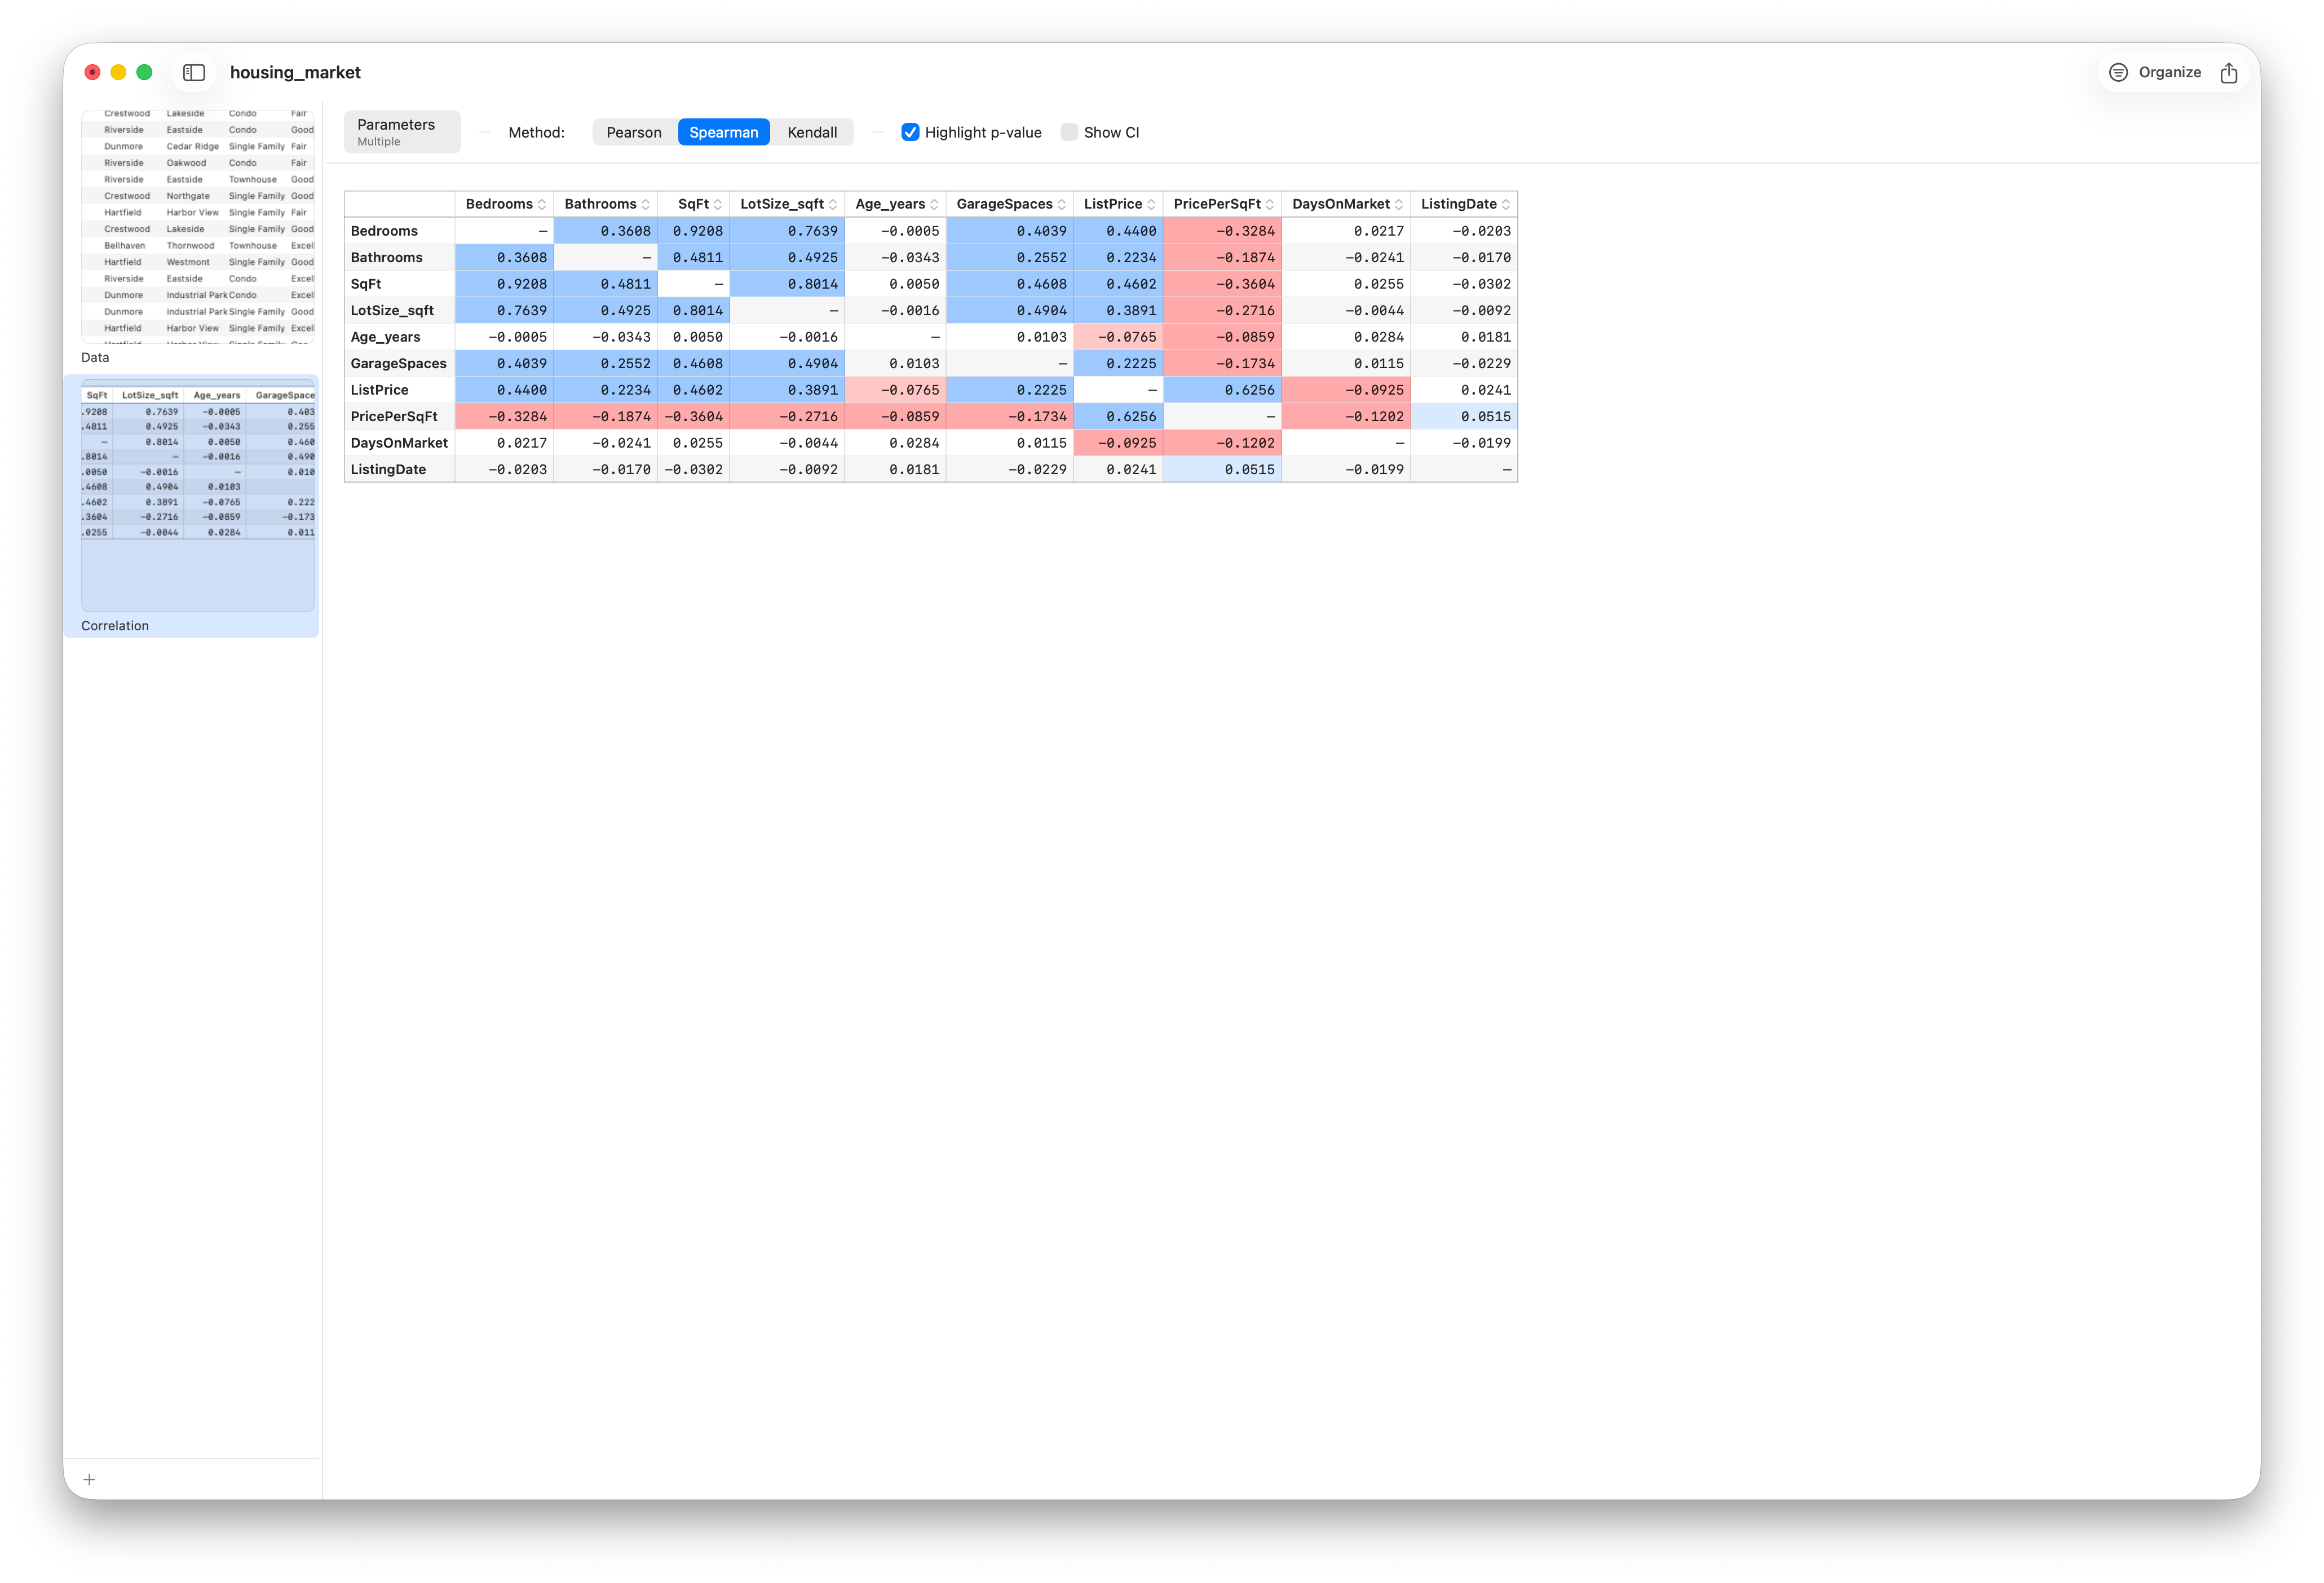
Pearson/Spearman matrices and significance highlighting.
Housing dataset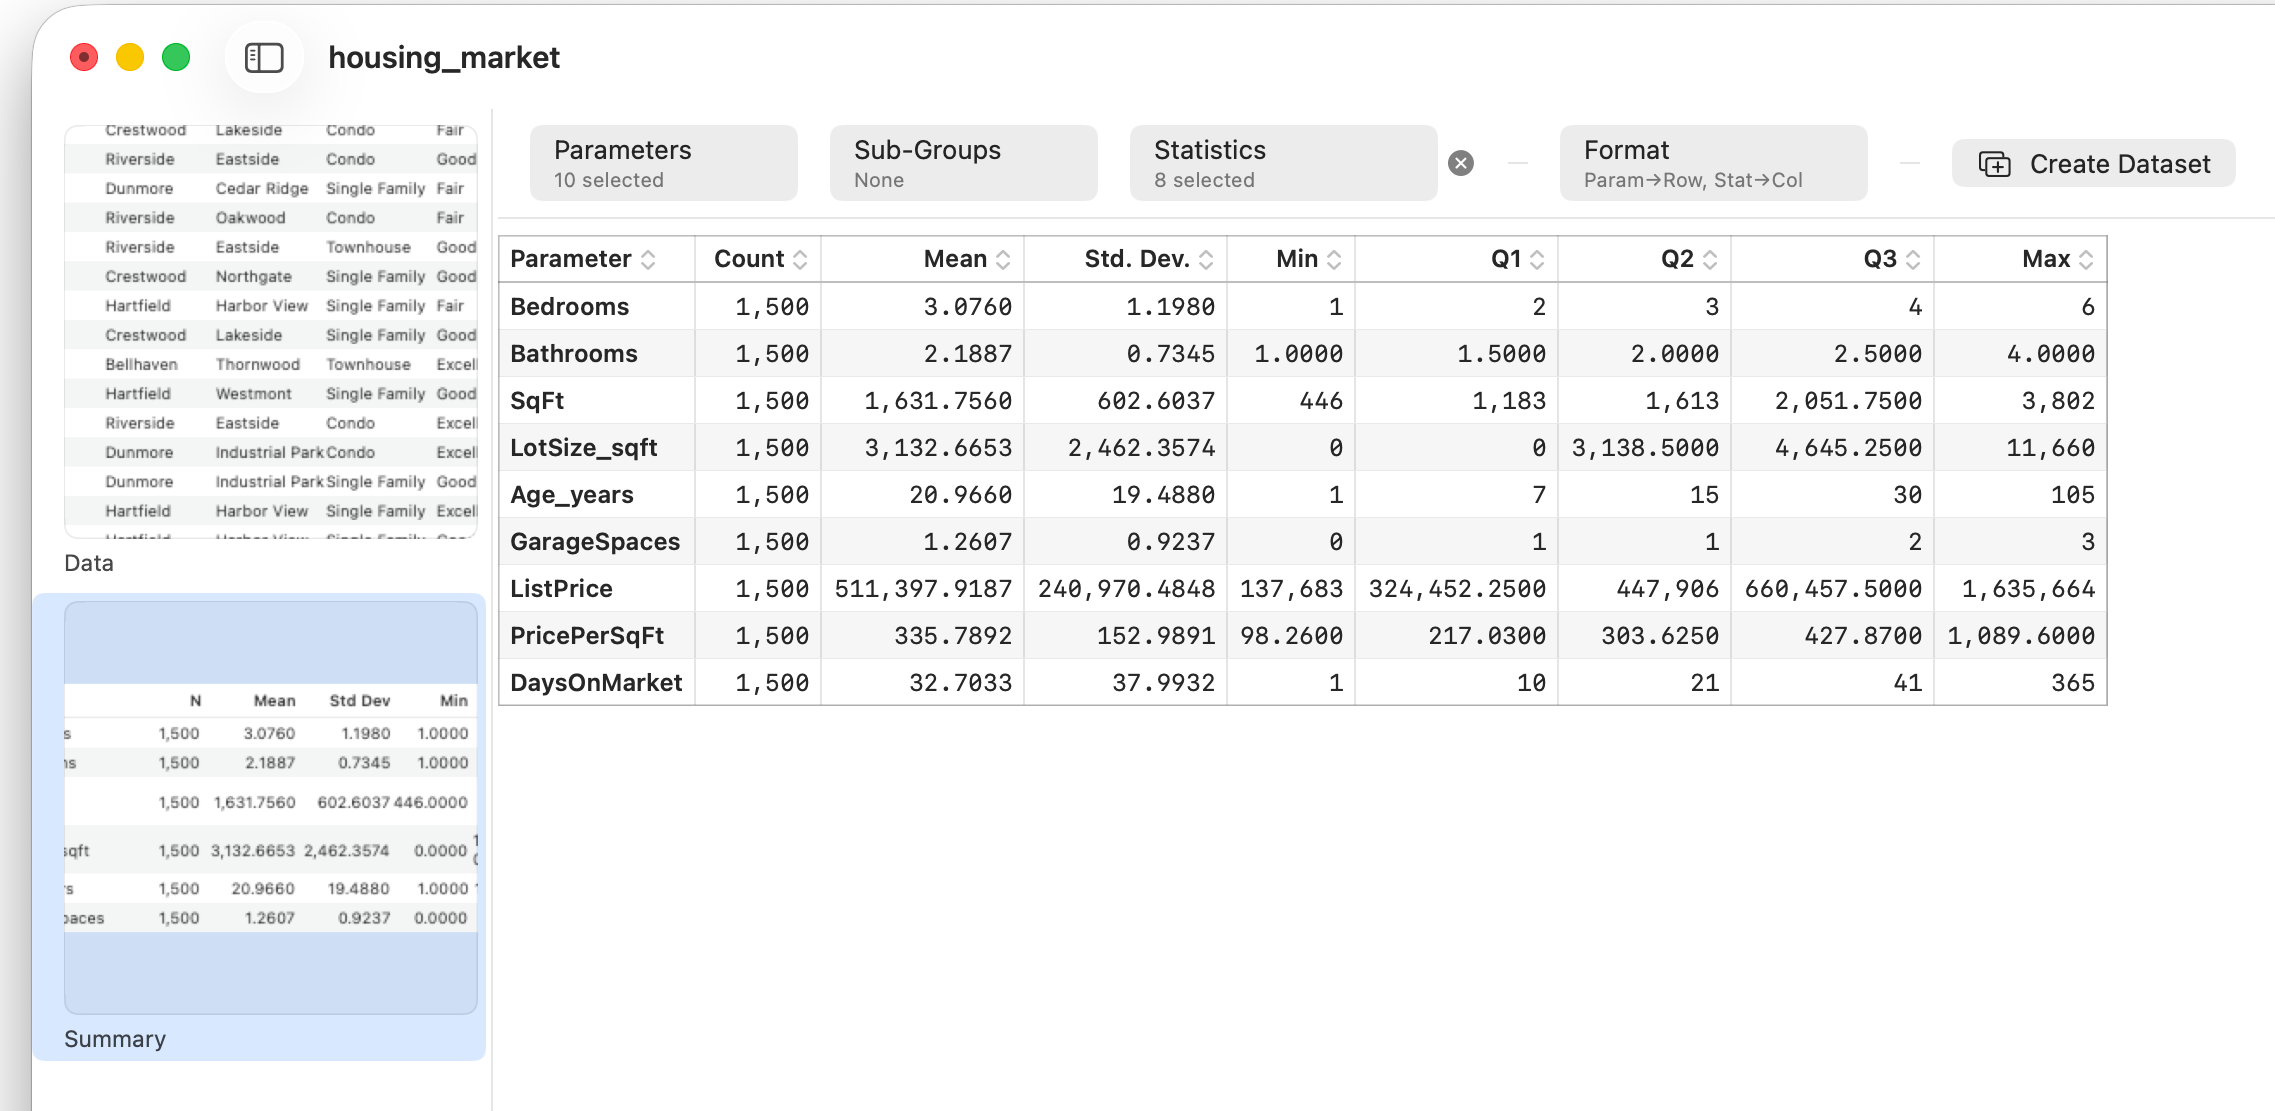
Master descriptive statistics.
Housing dataset
Test whether two groups differ.
Clinical dataset
Compare many groups and factors.
Process dataset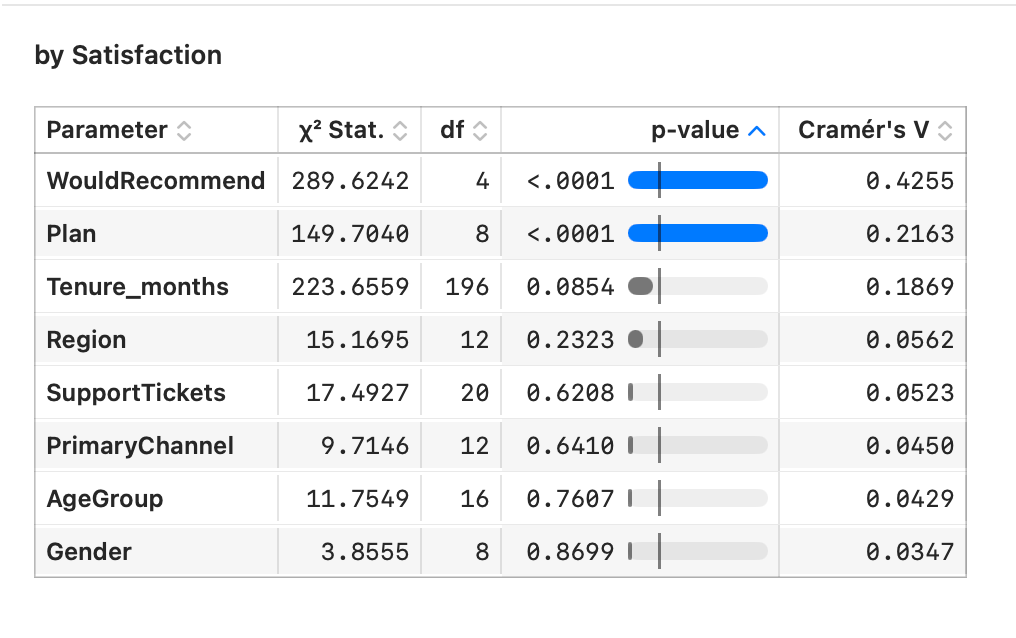
Multivariate and categorical inference.
Process + survey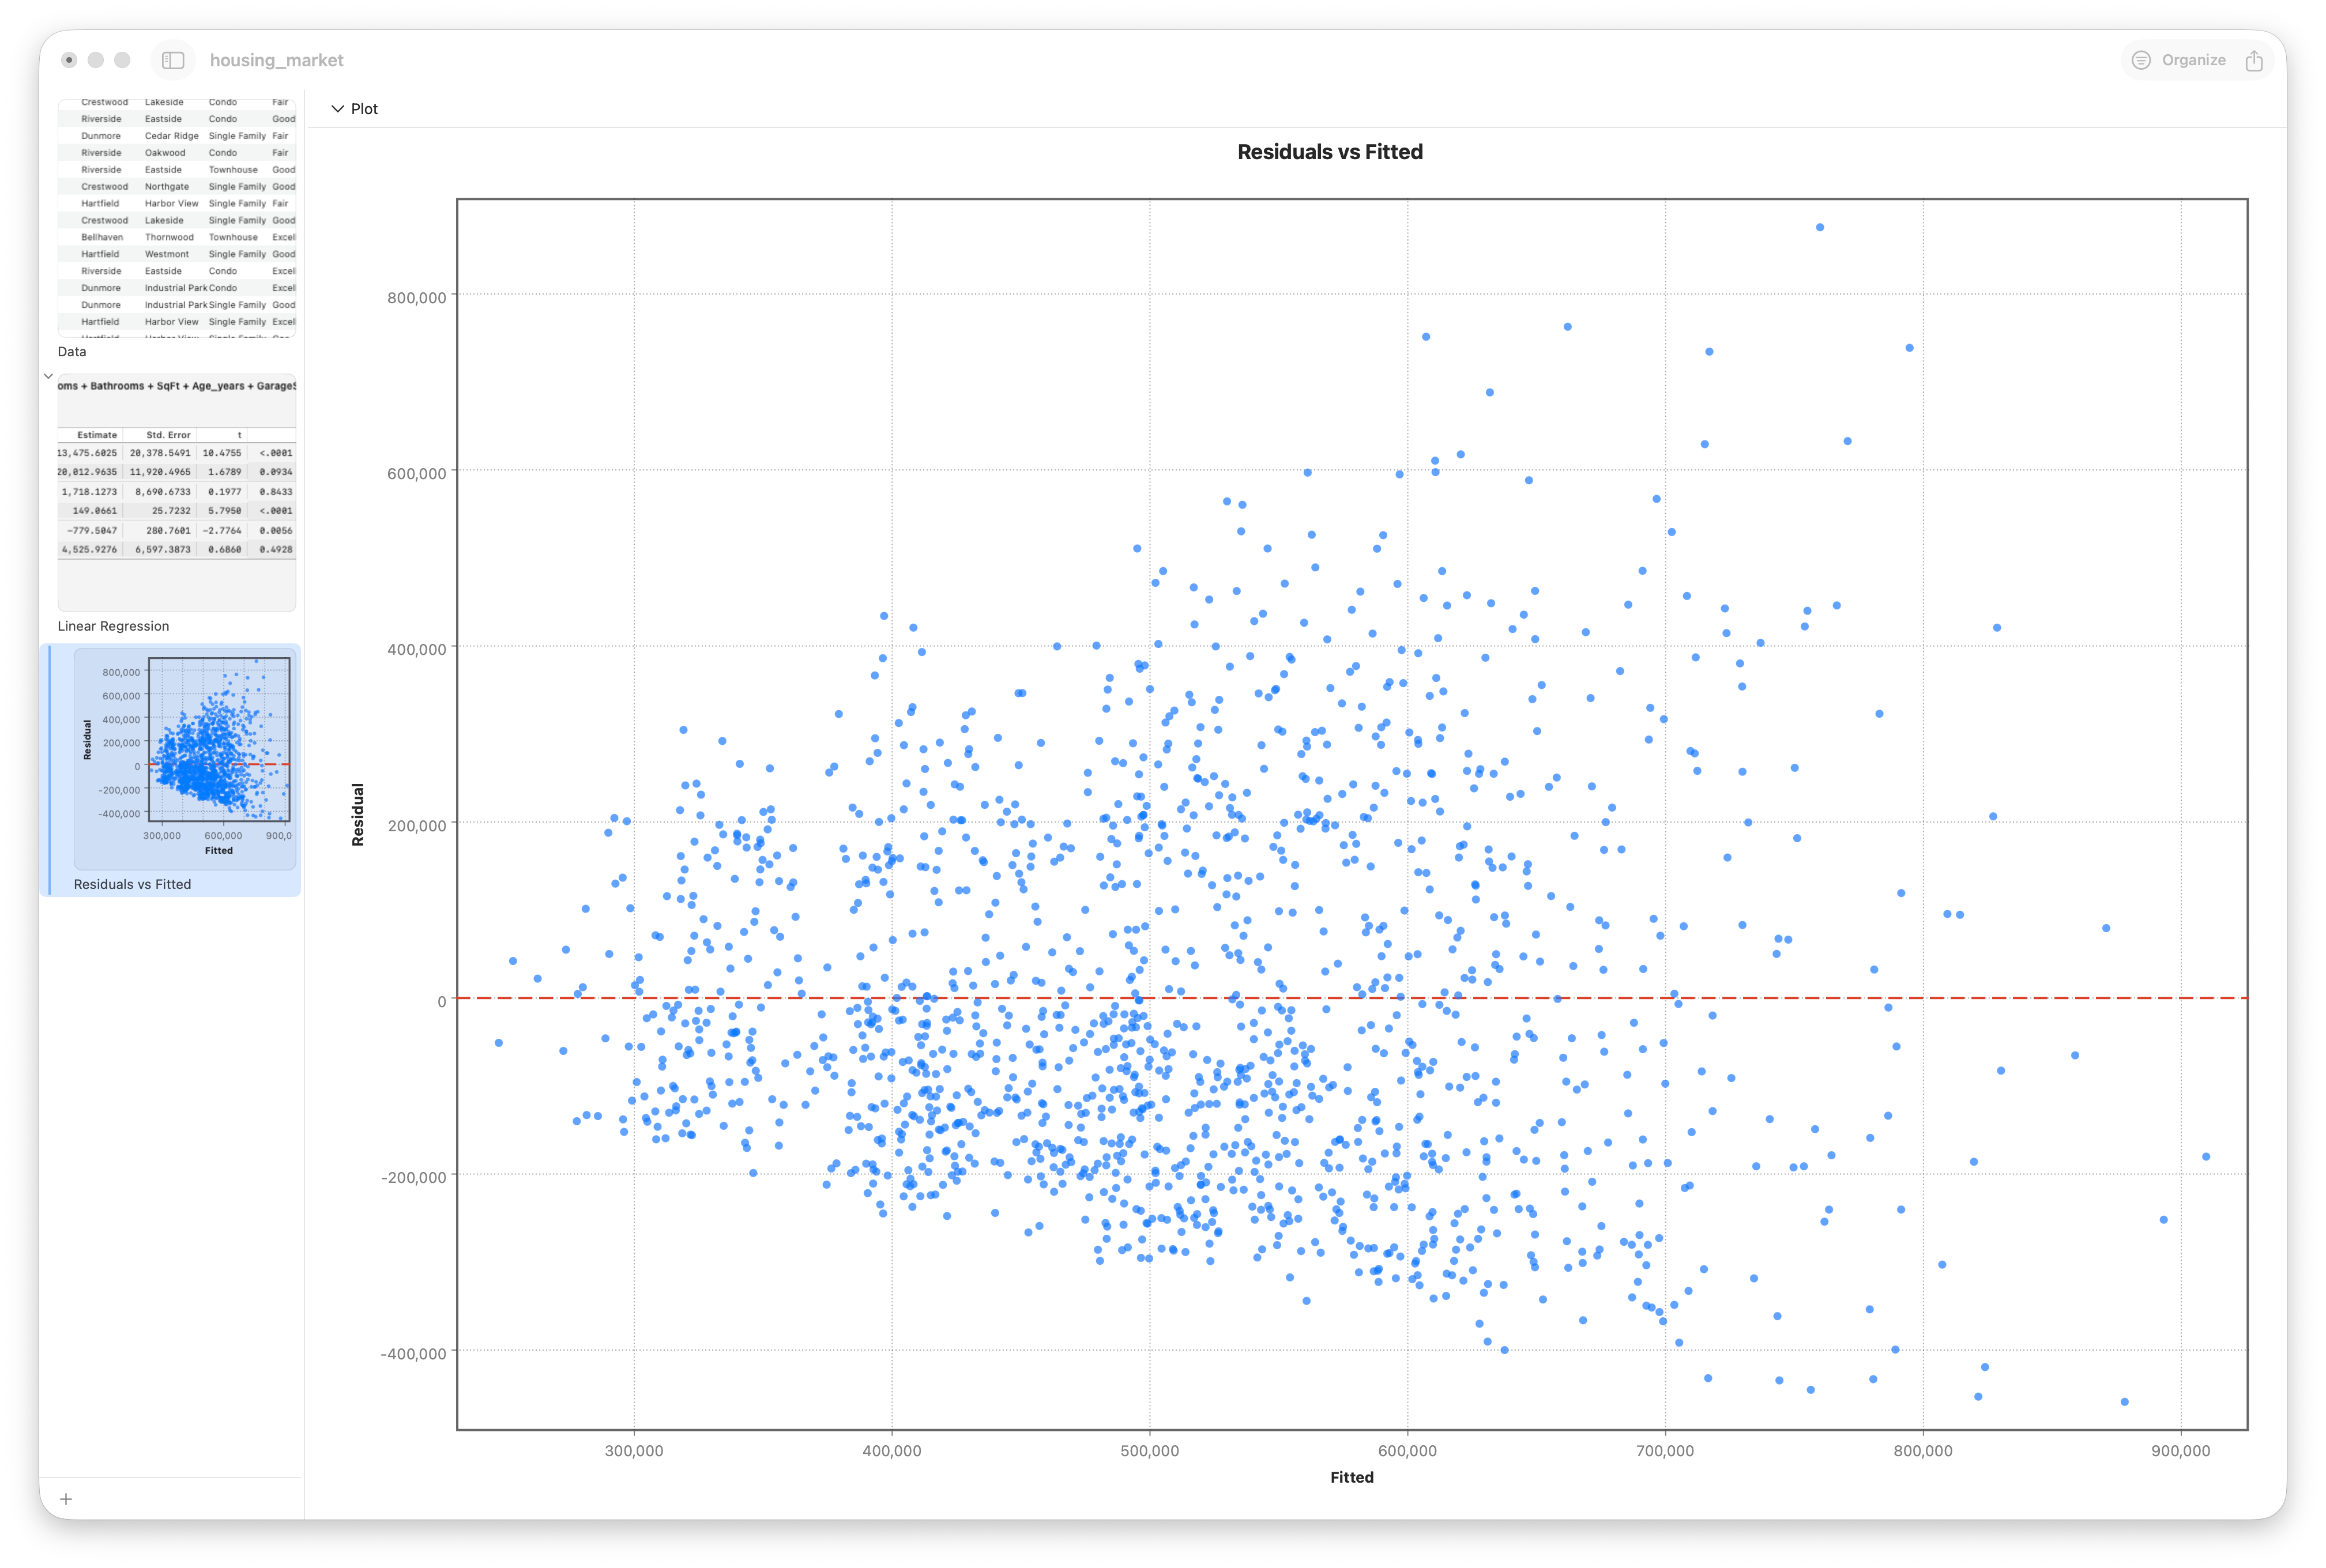
Models with full diagnostics.
Housing dataset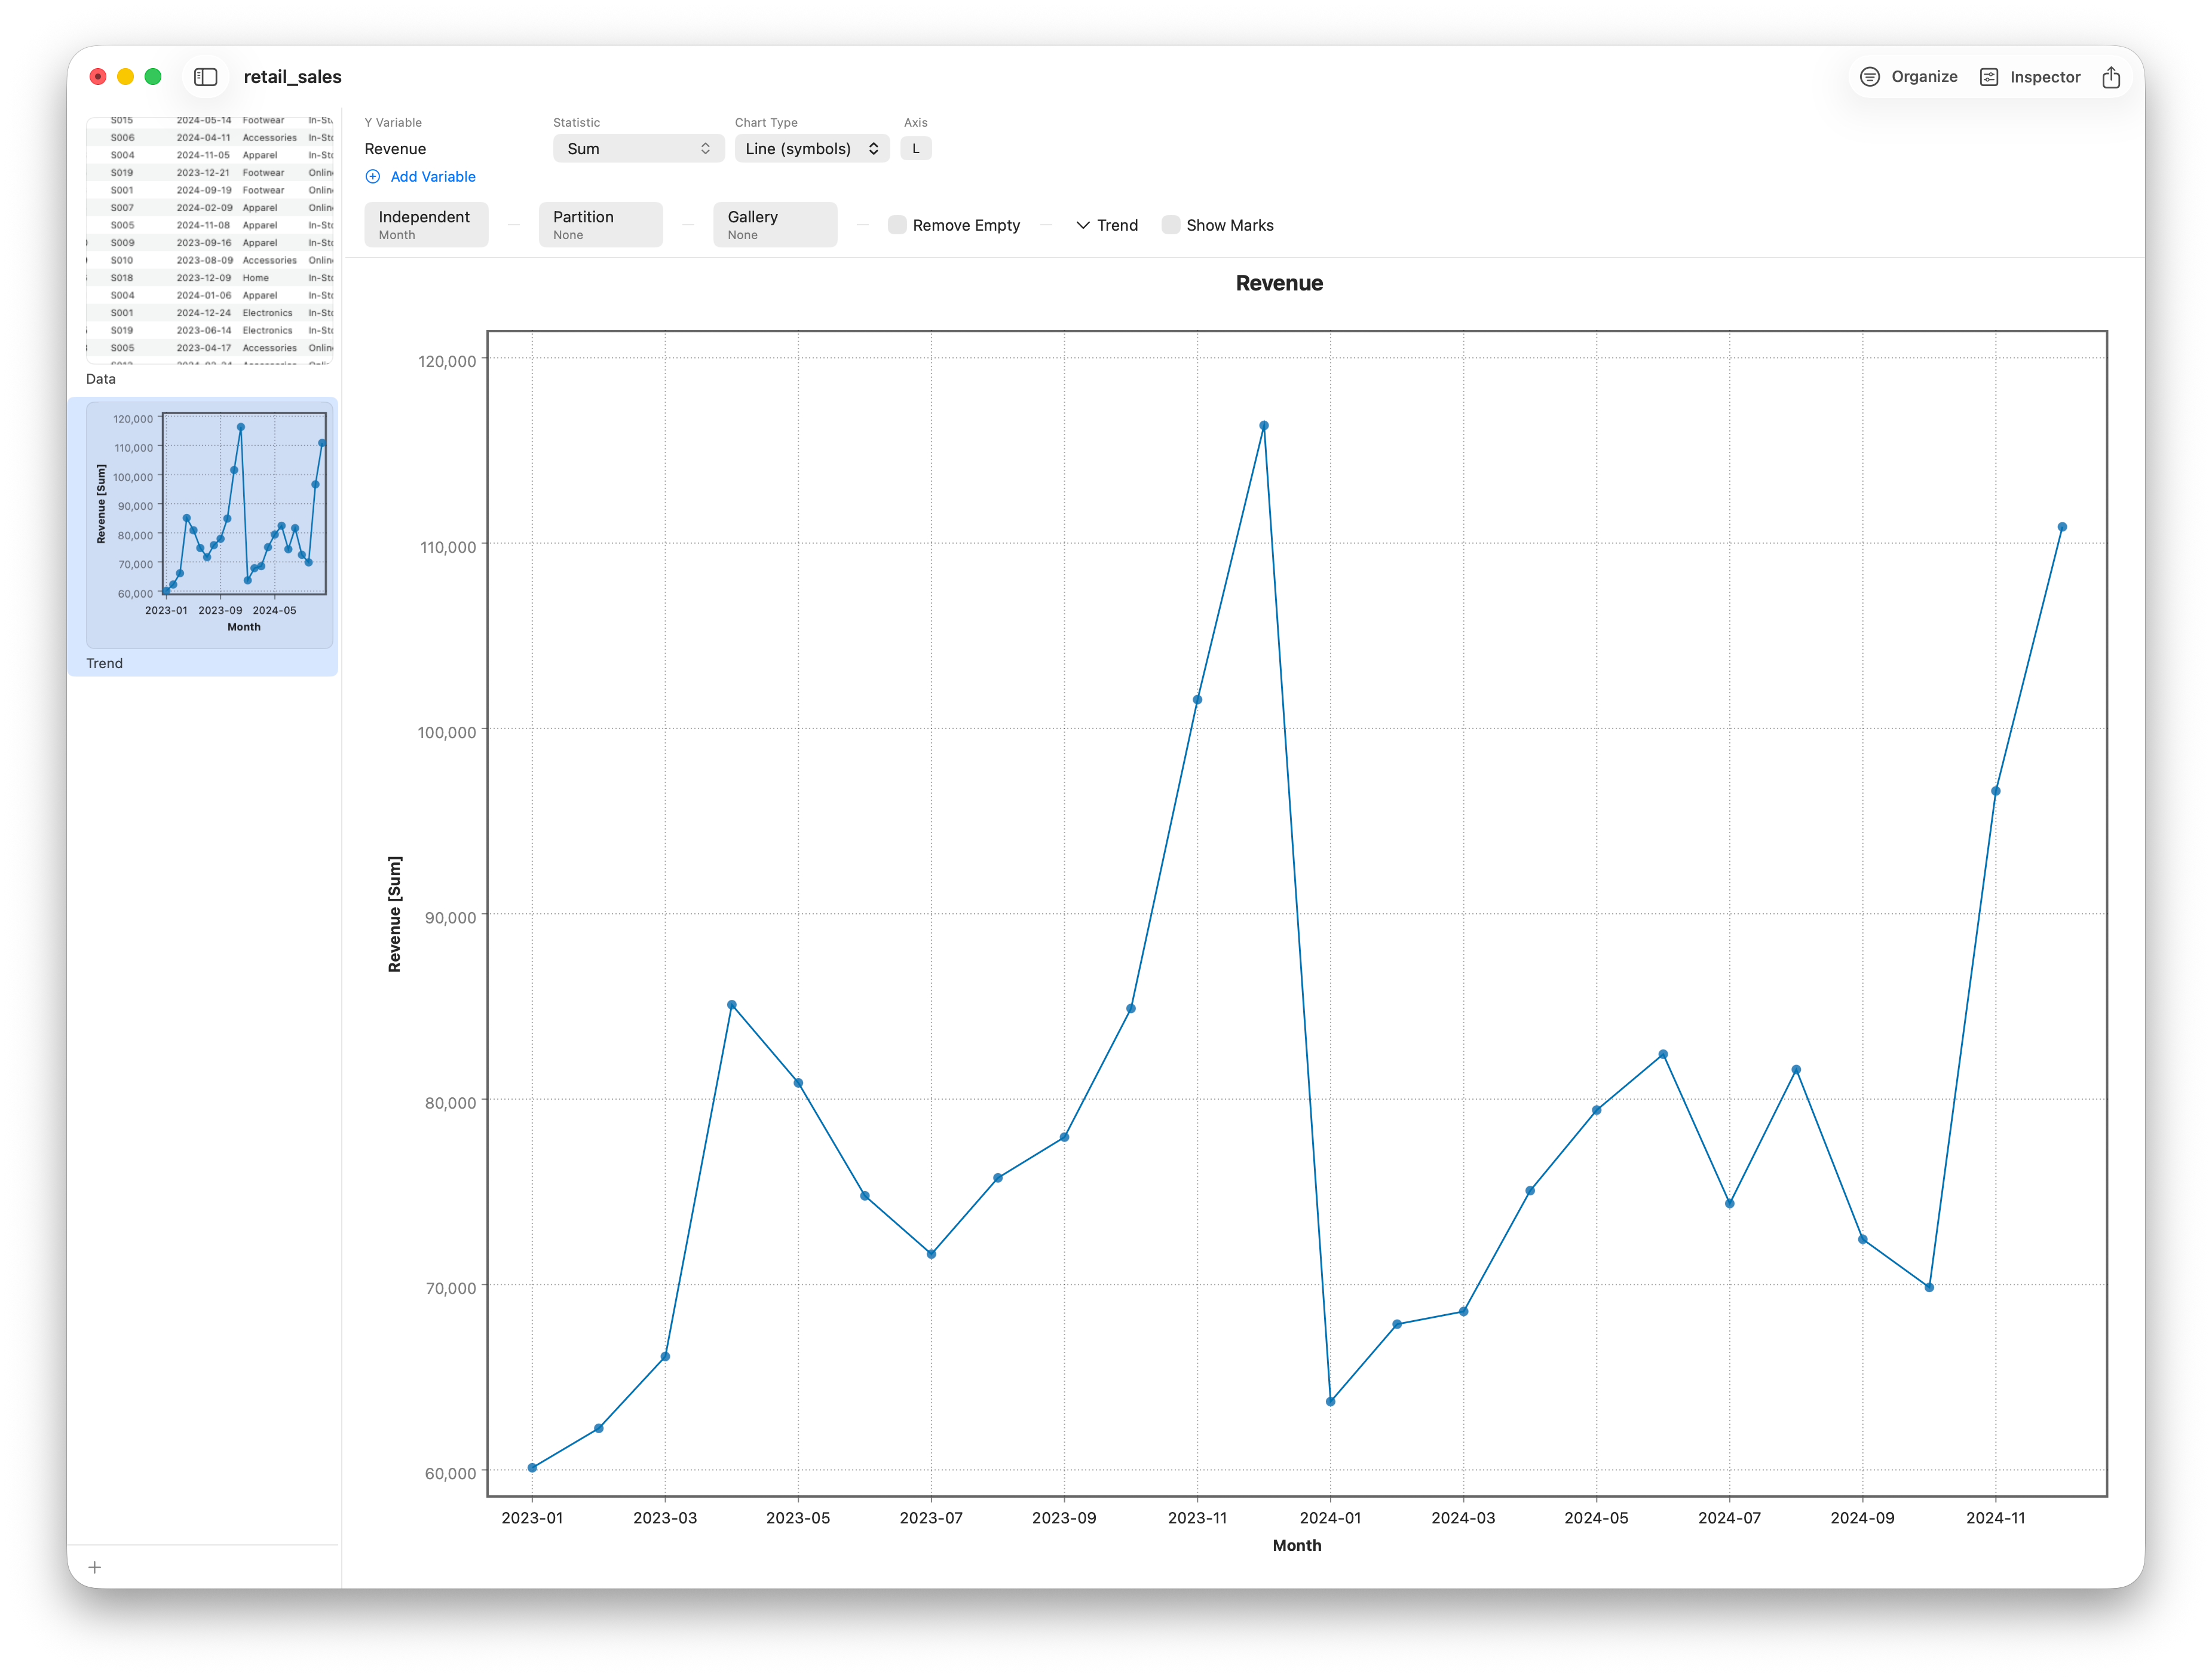
Trend, seasonality, and moving-average smoothing.
Retail dataset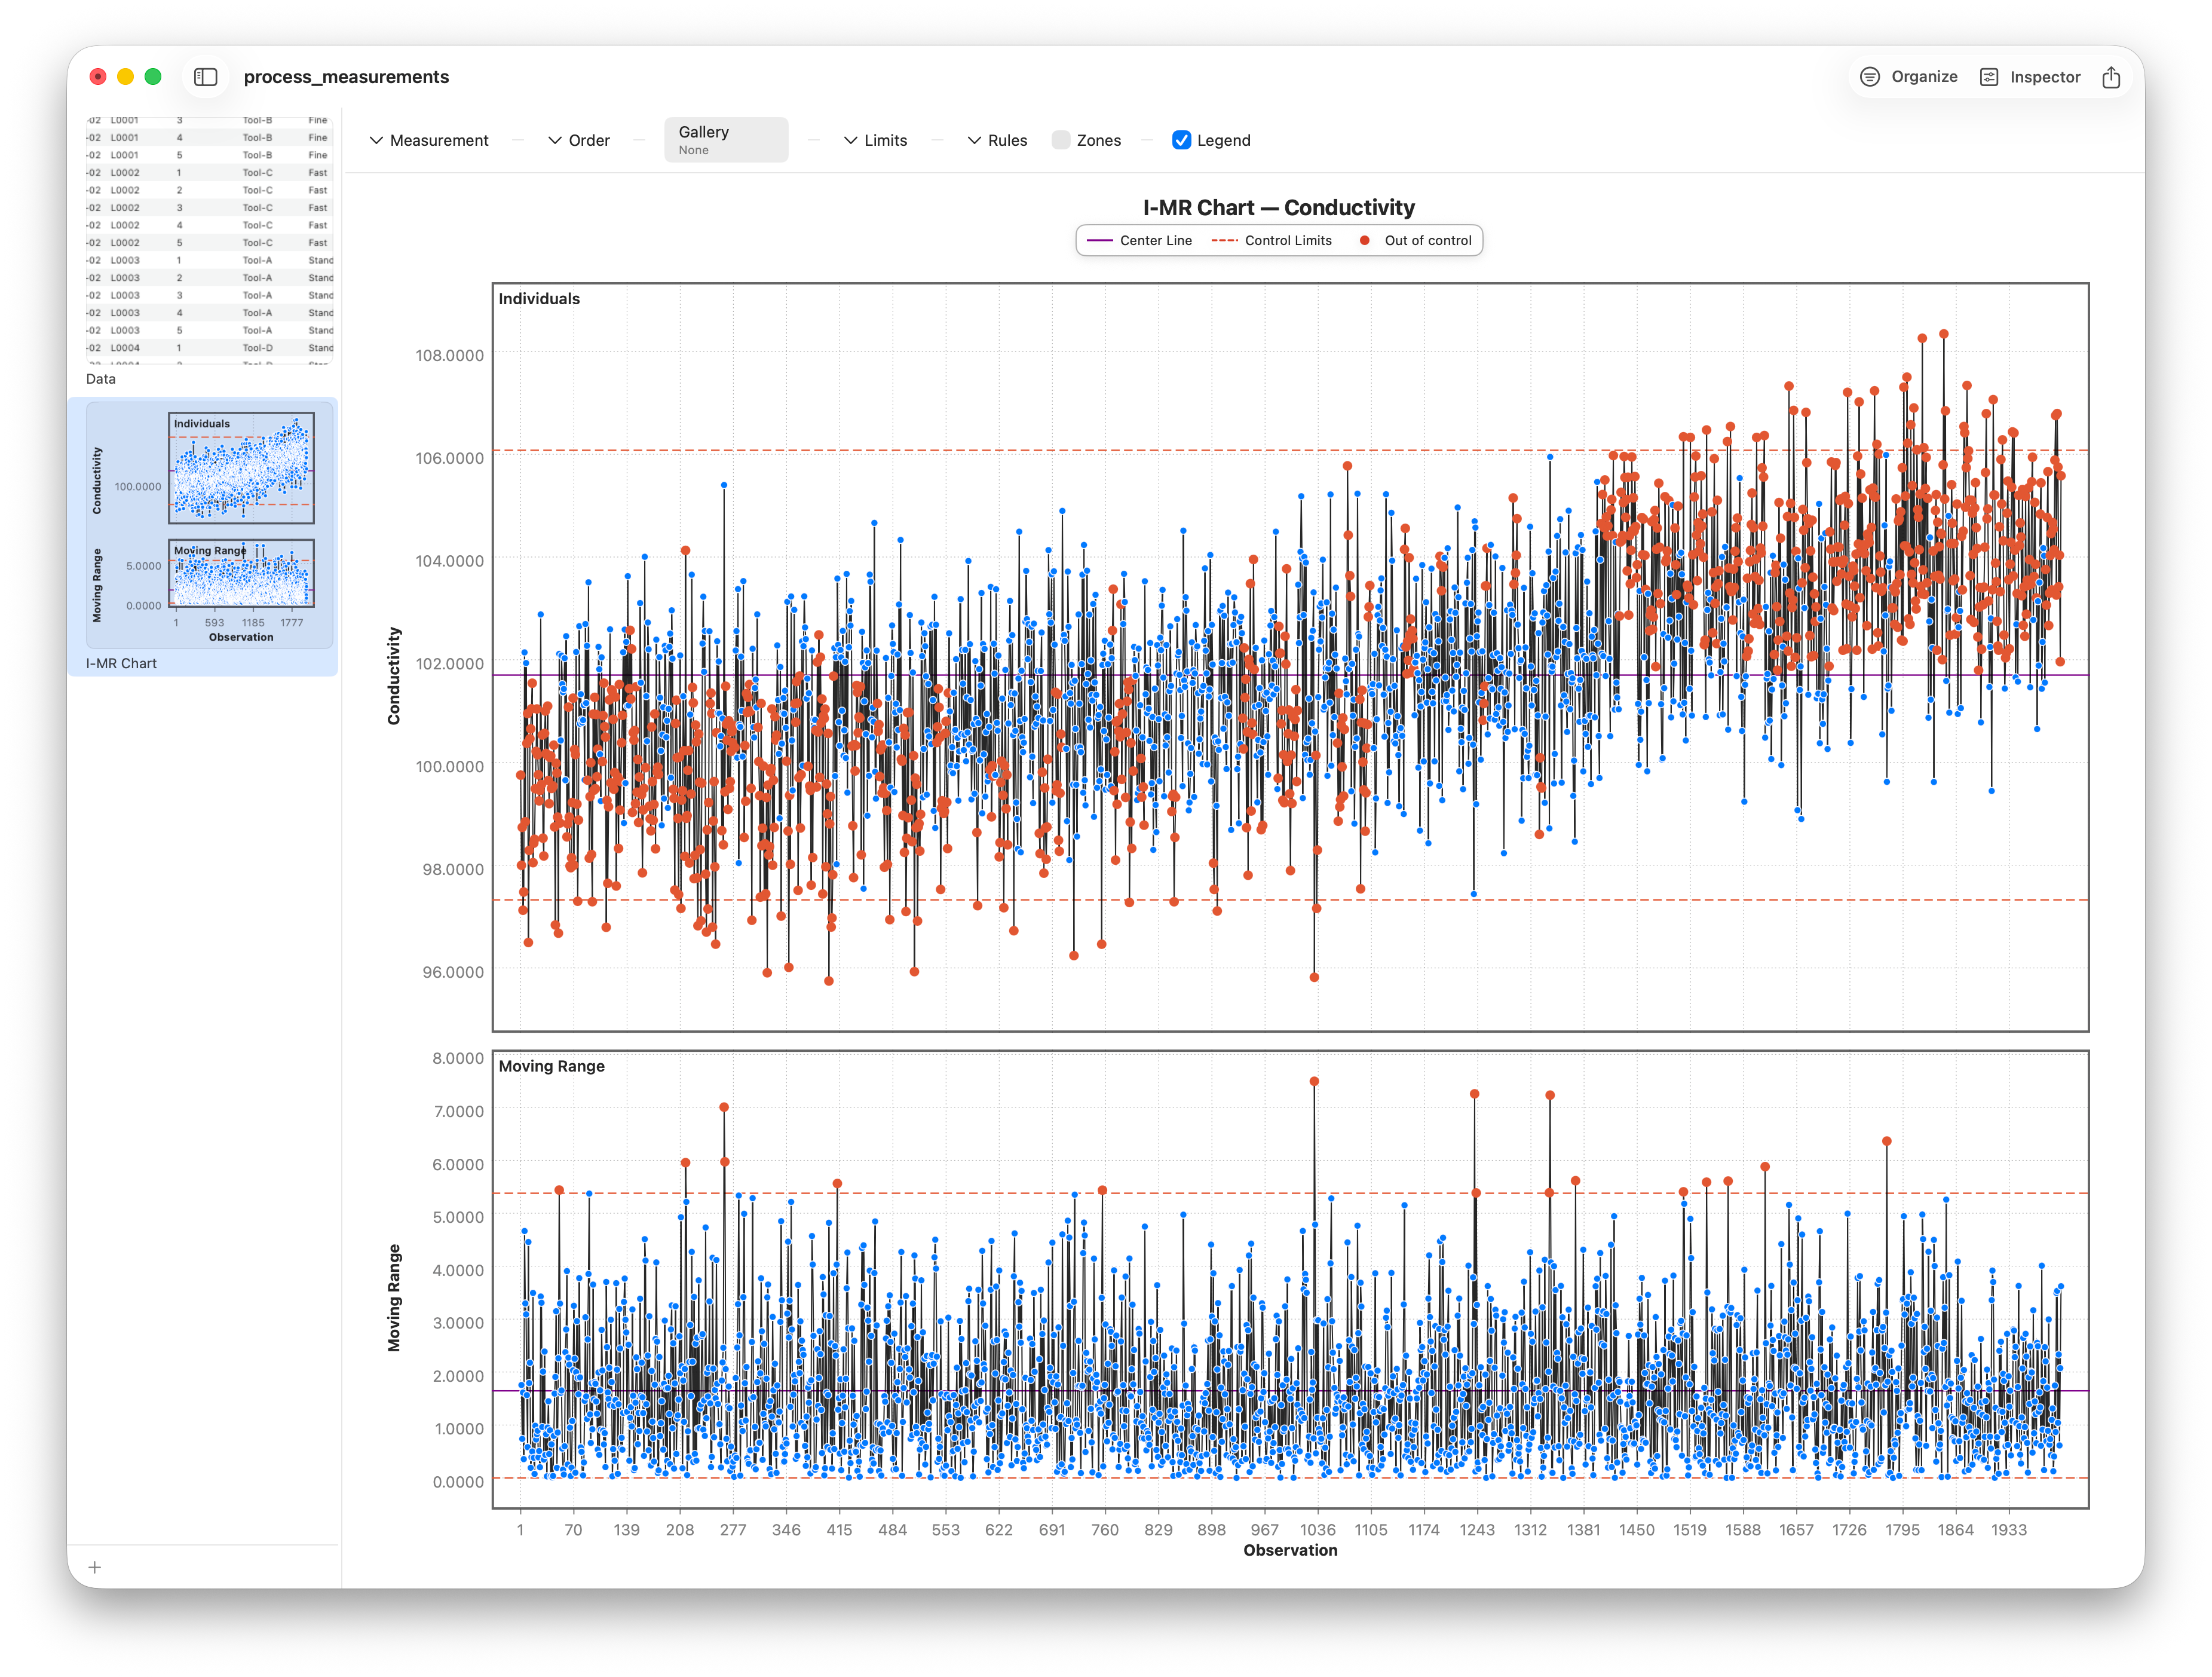
I-MR and X-bar R/S charts.
Process dataset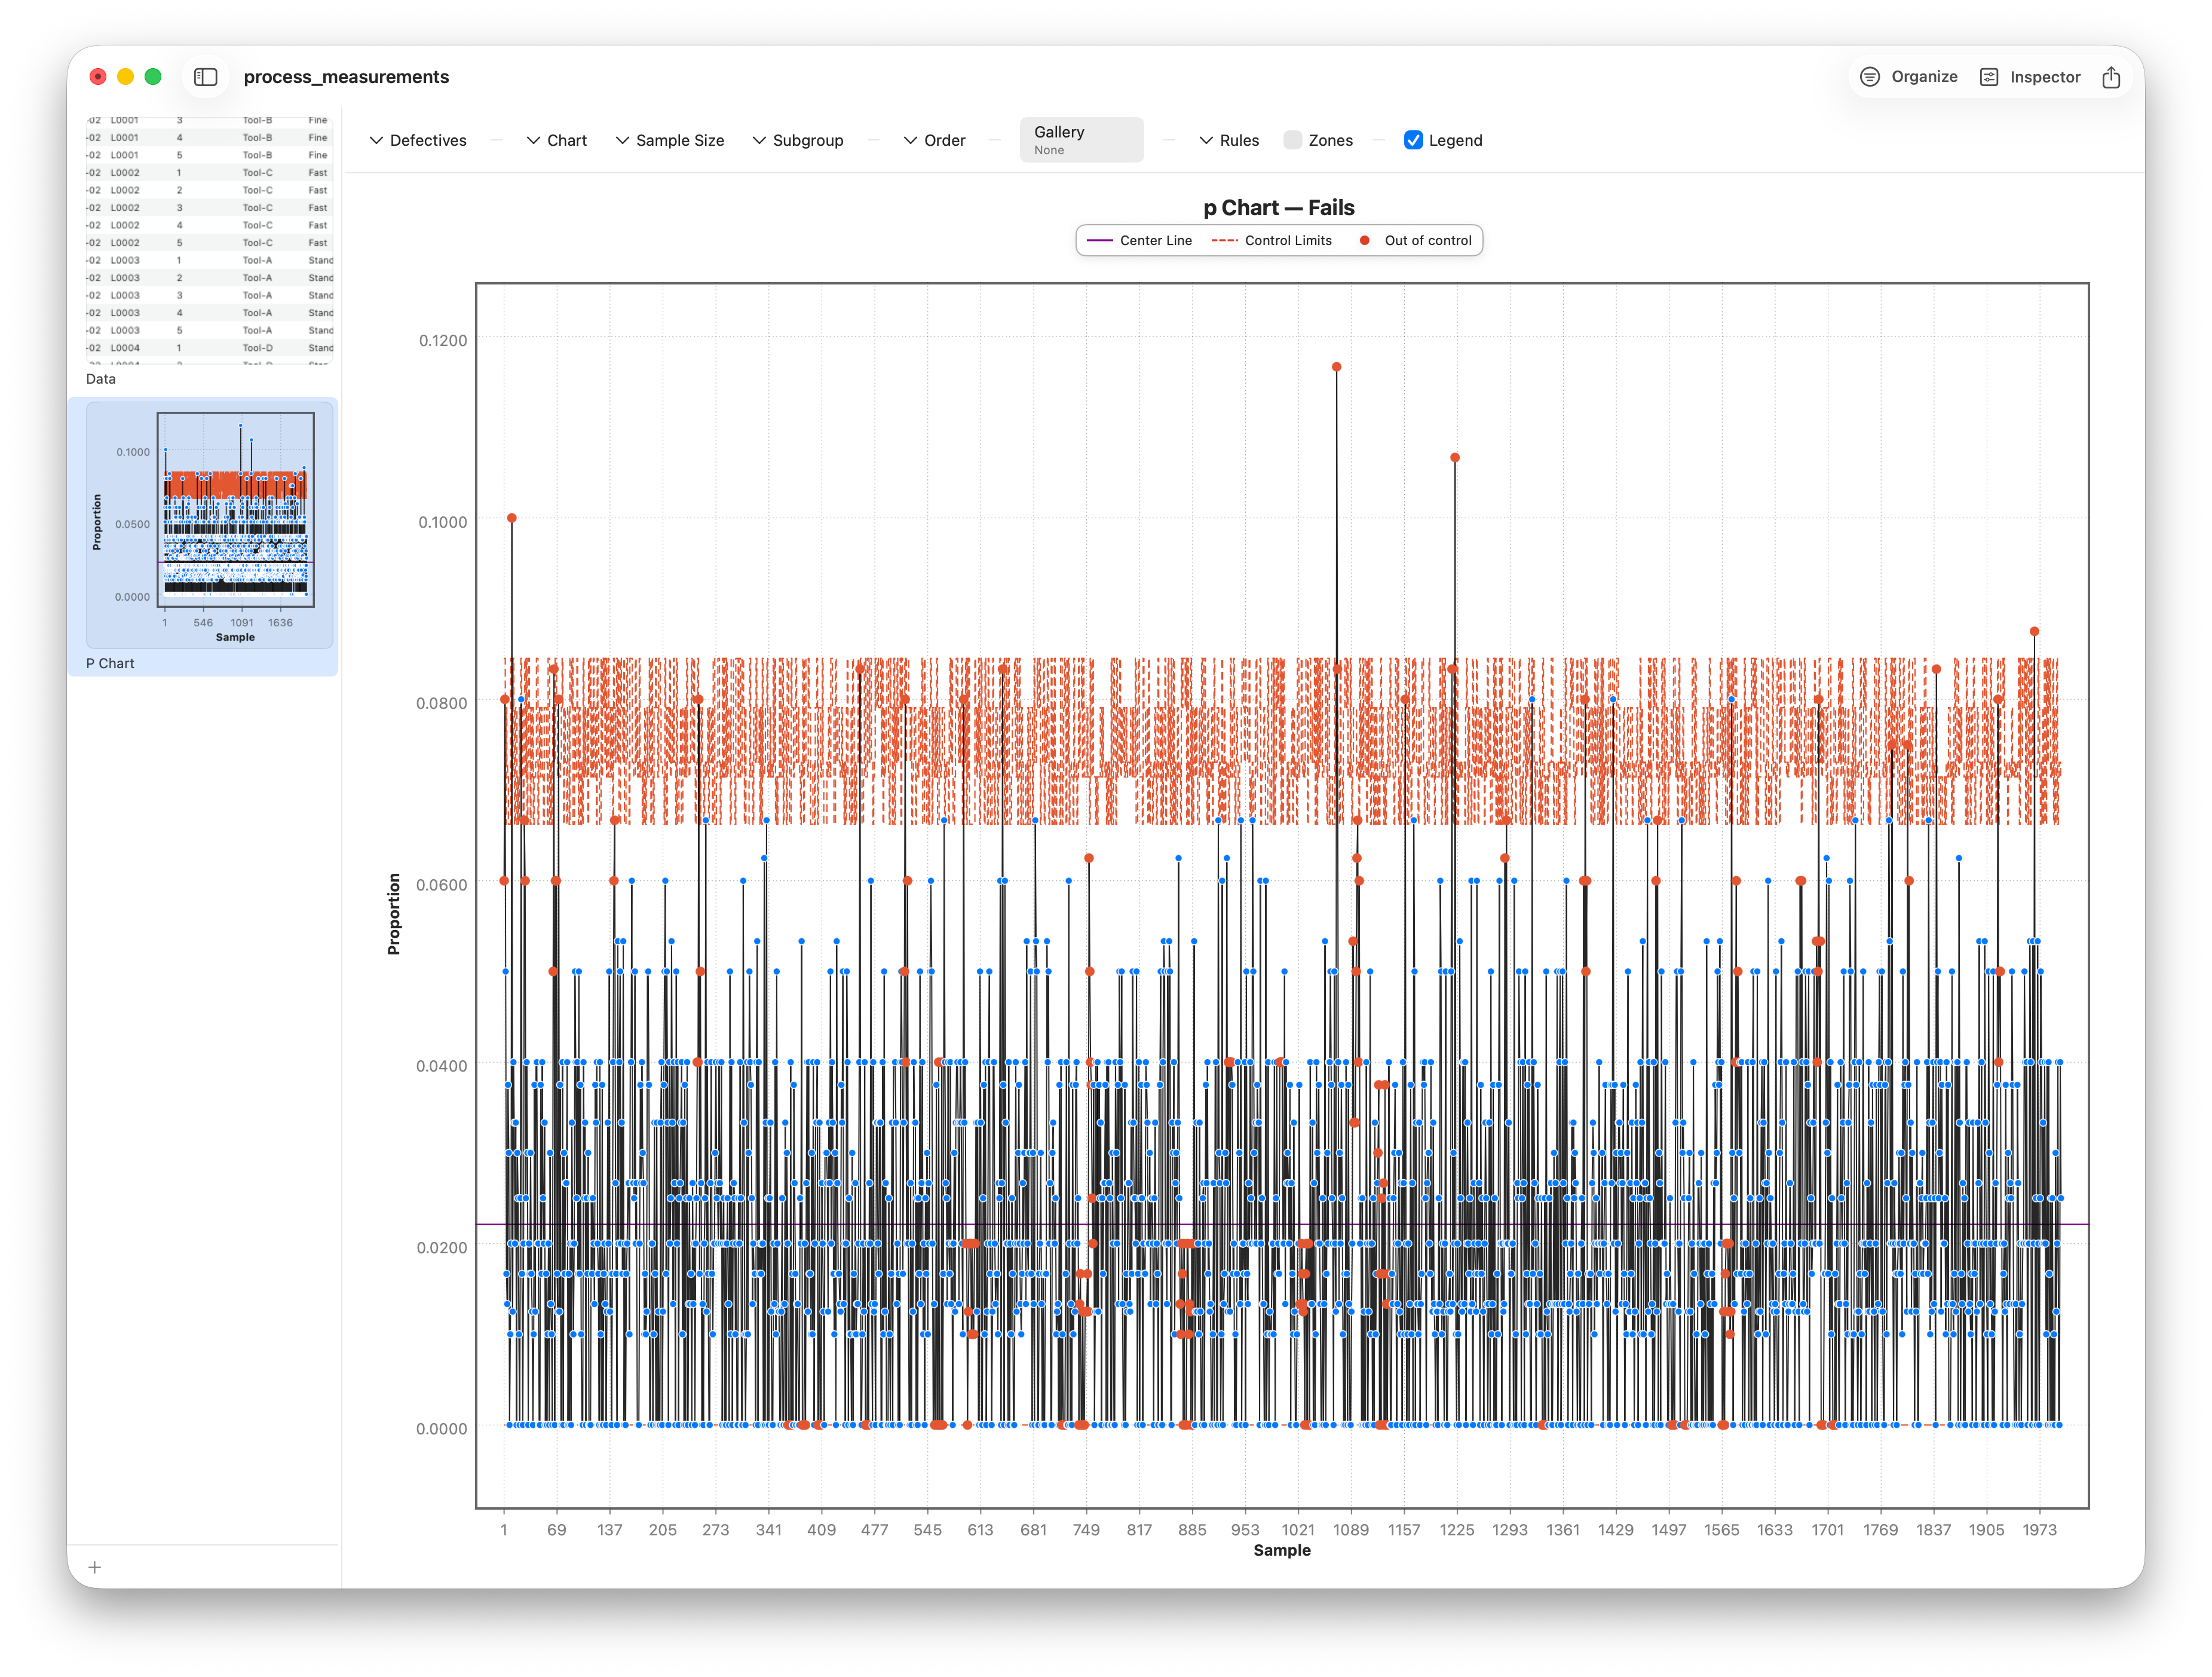
p/np, c/u and Nelson rules.
Process dataset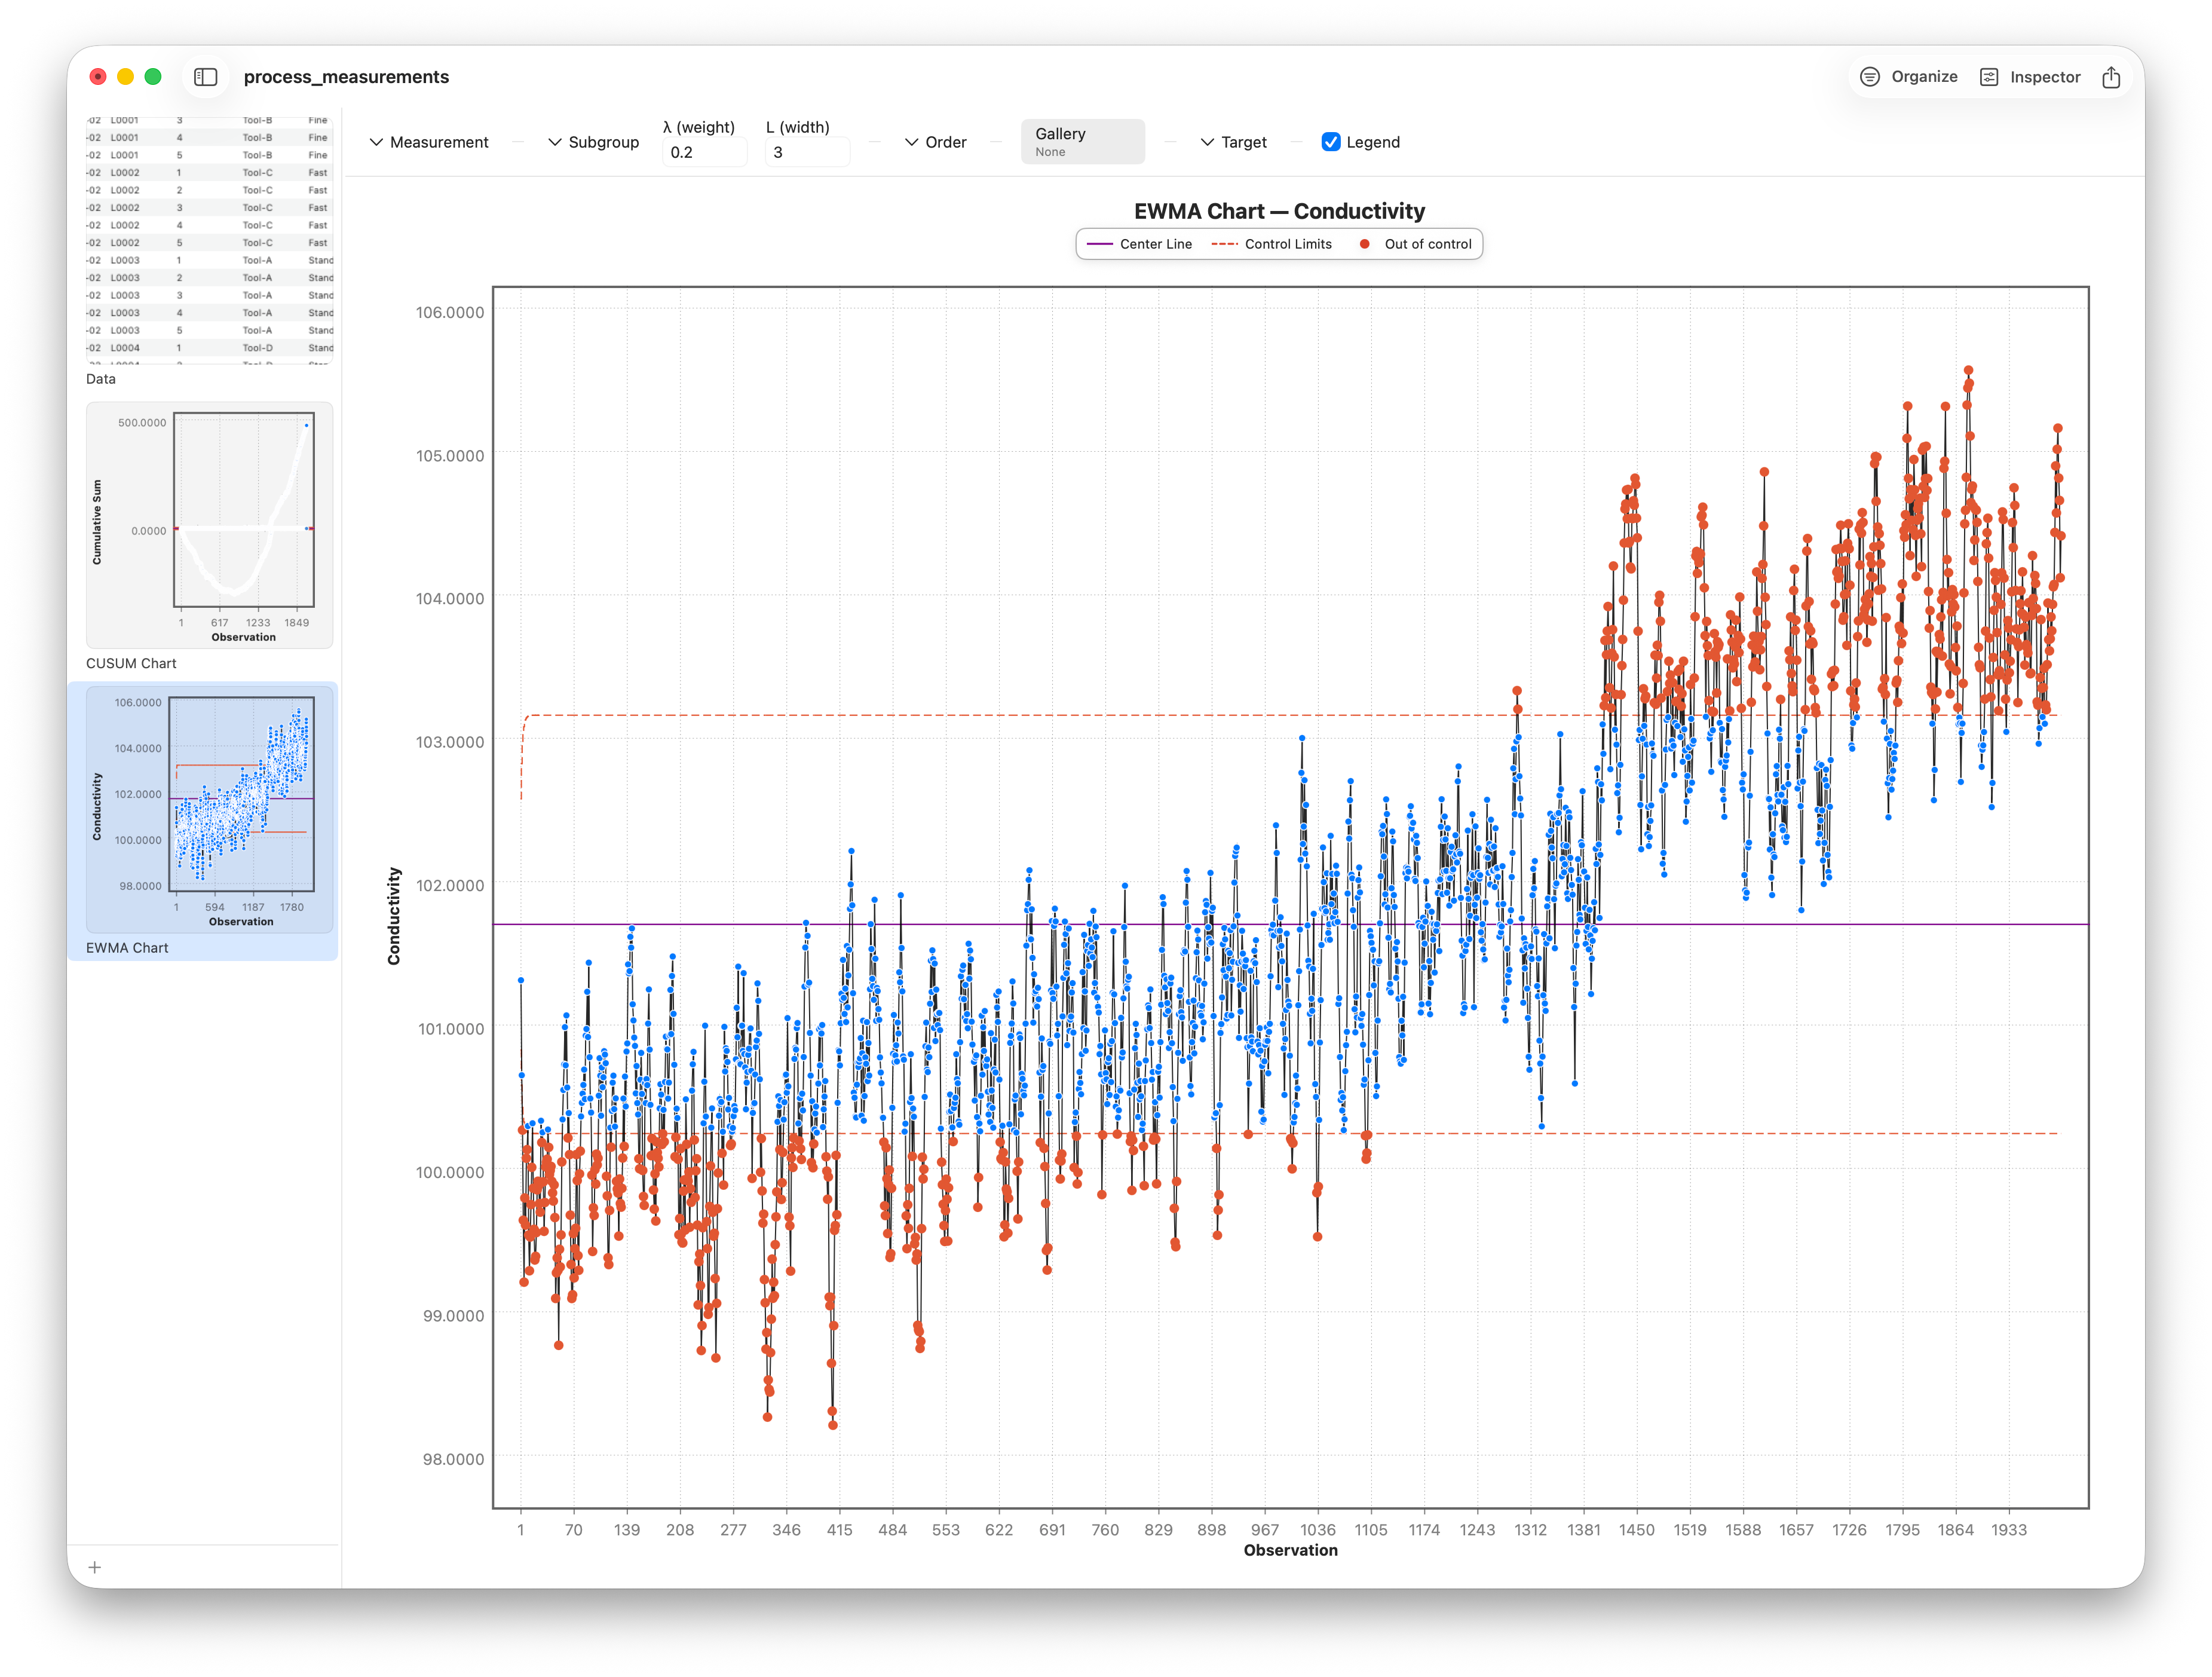
Catch small, slow process shifts.
Process dataset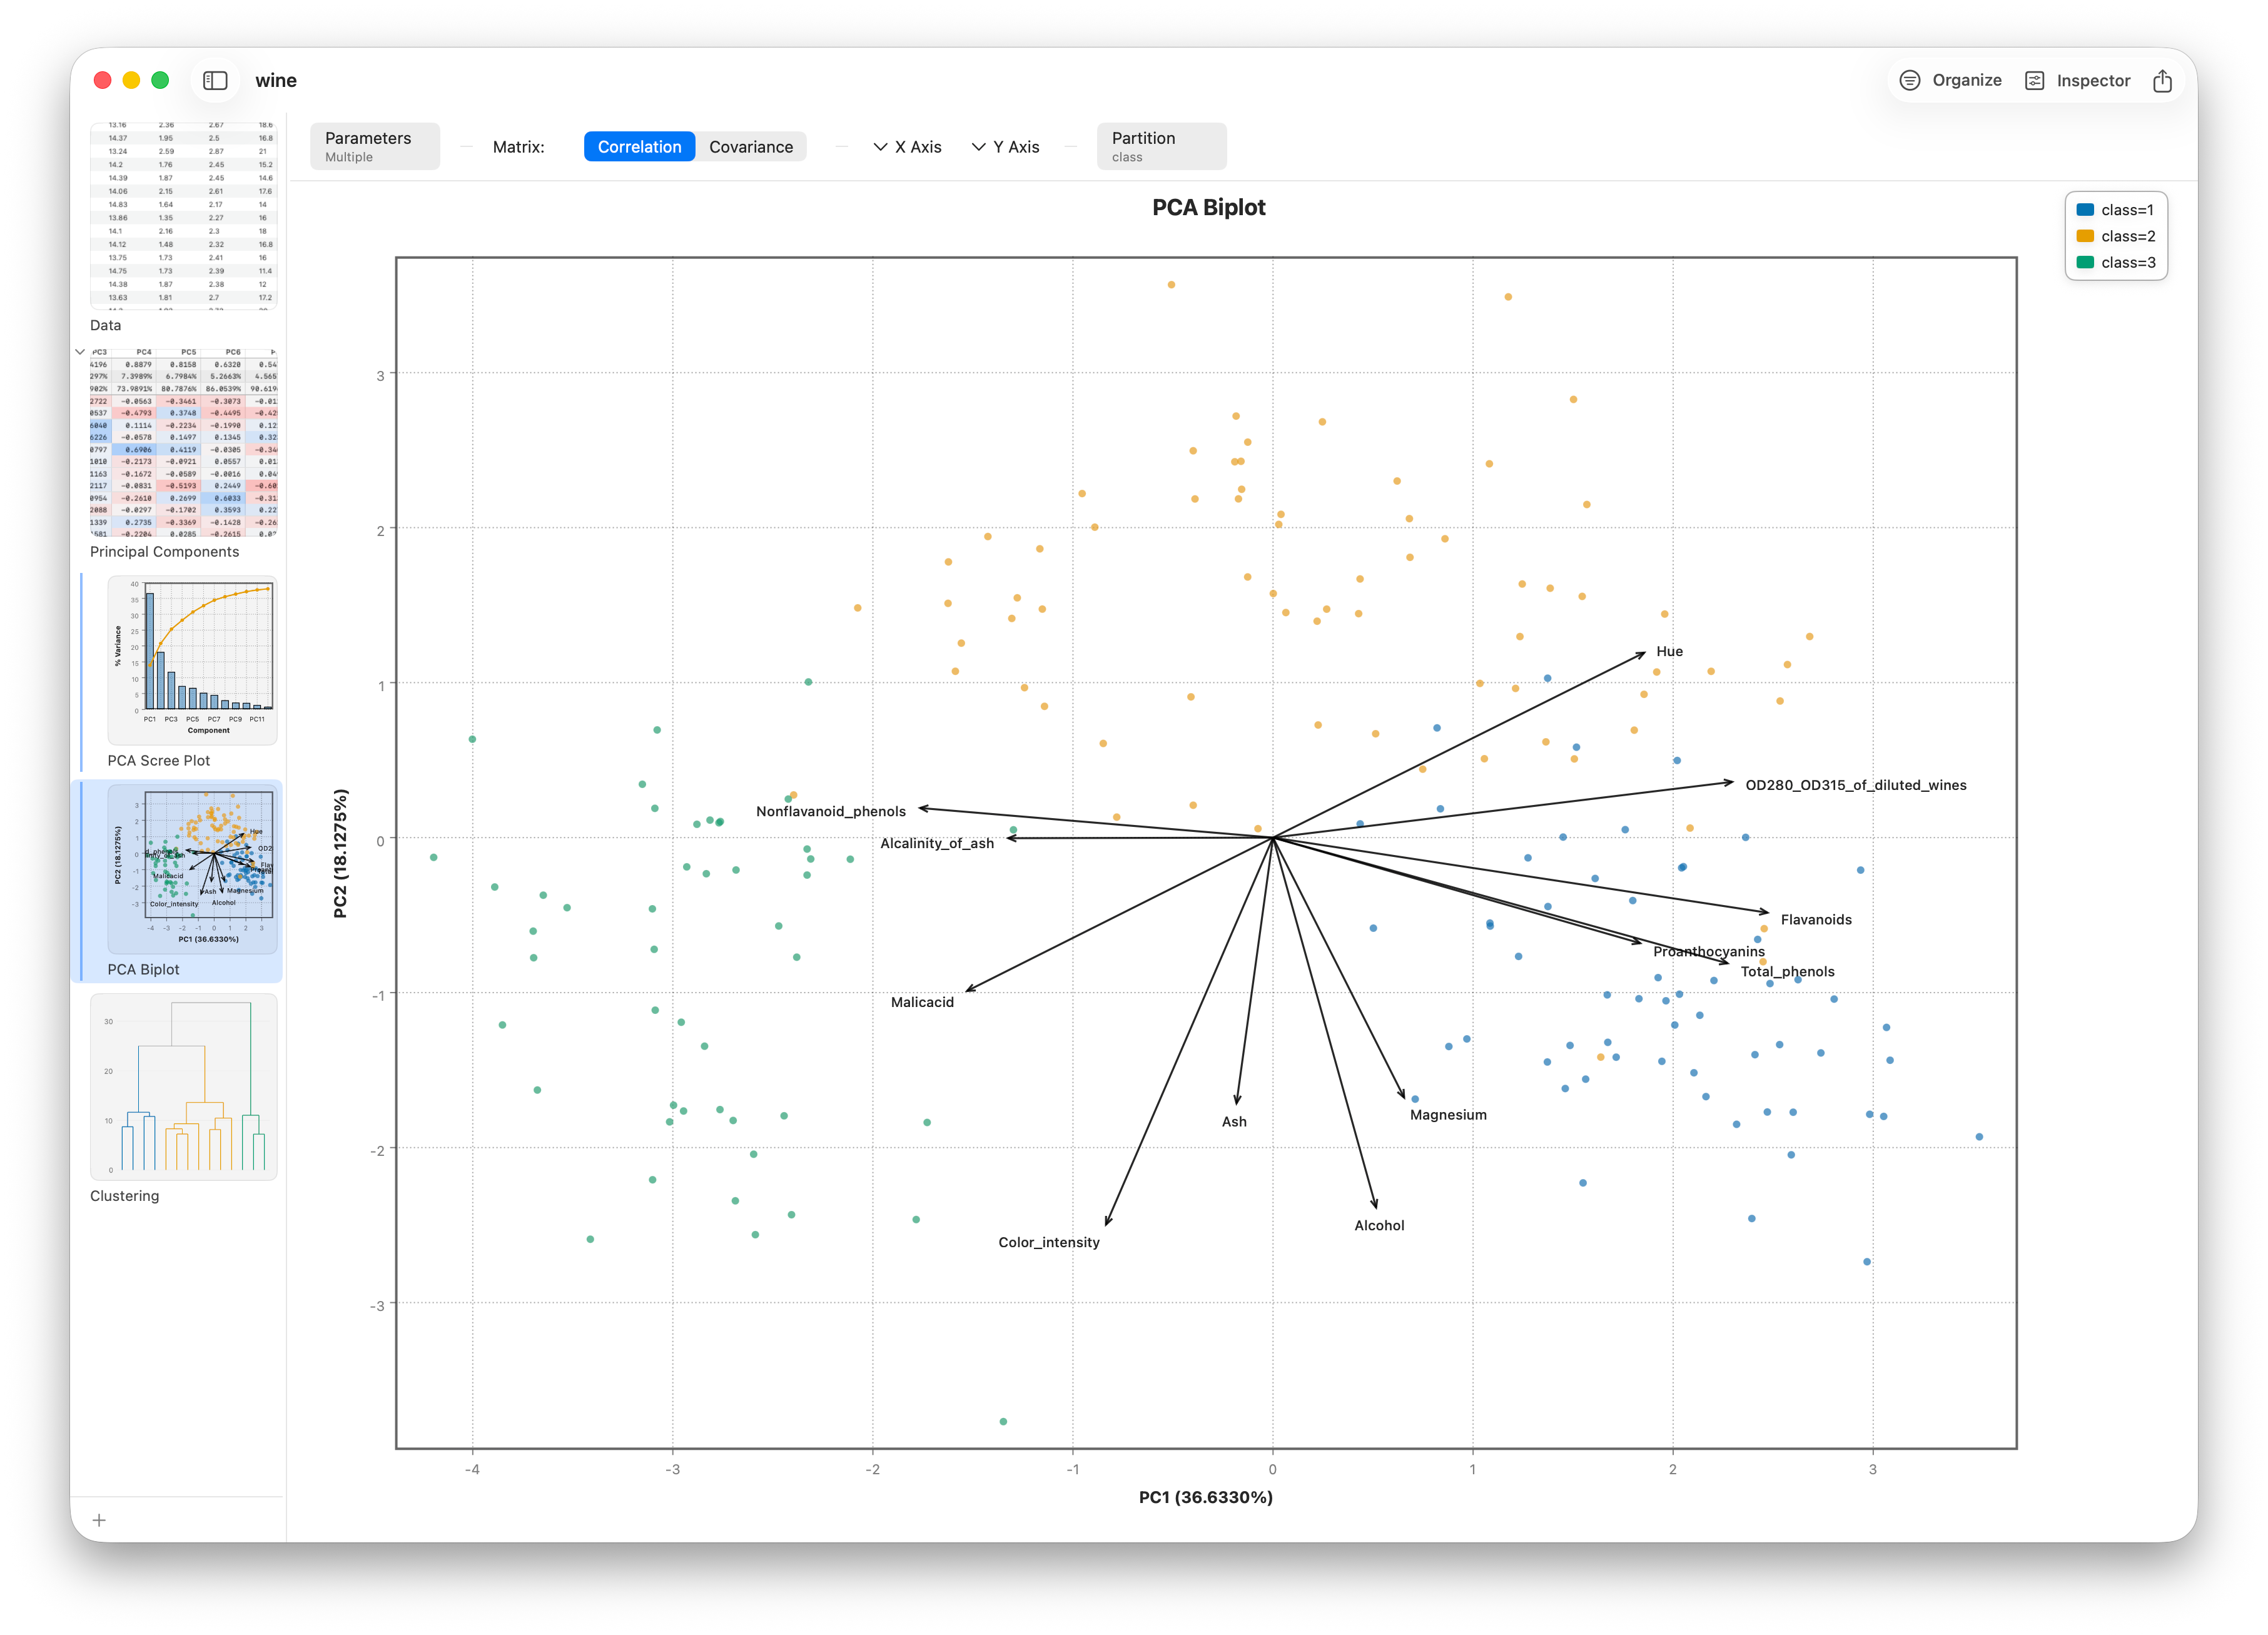
Reduce dimensions, find natural groups.
Wine dataset (public)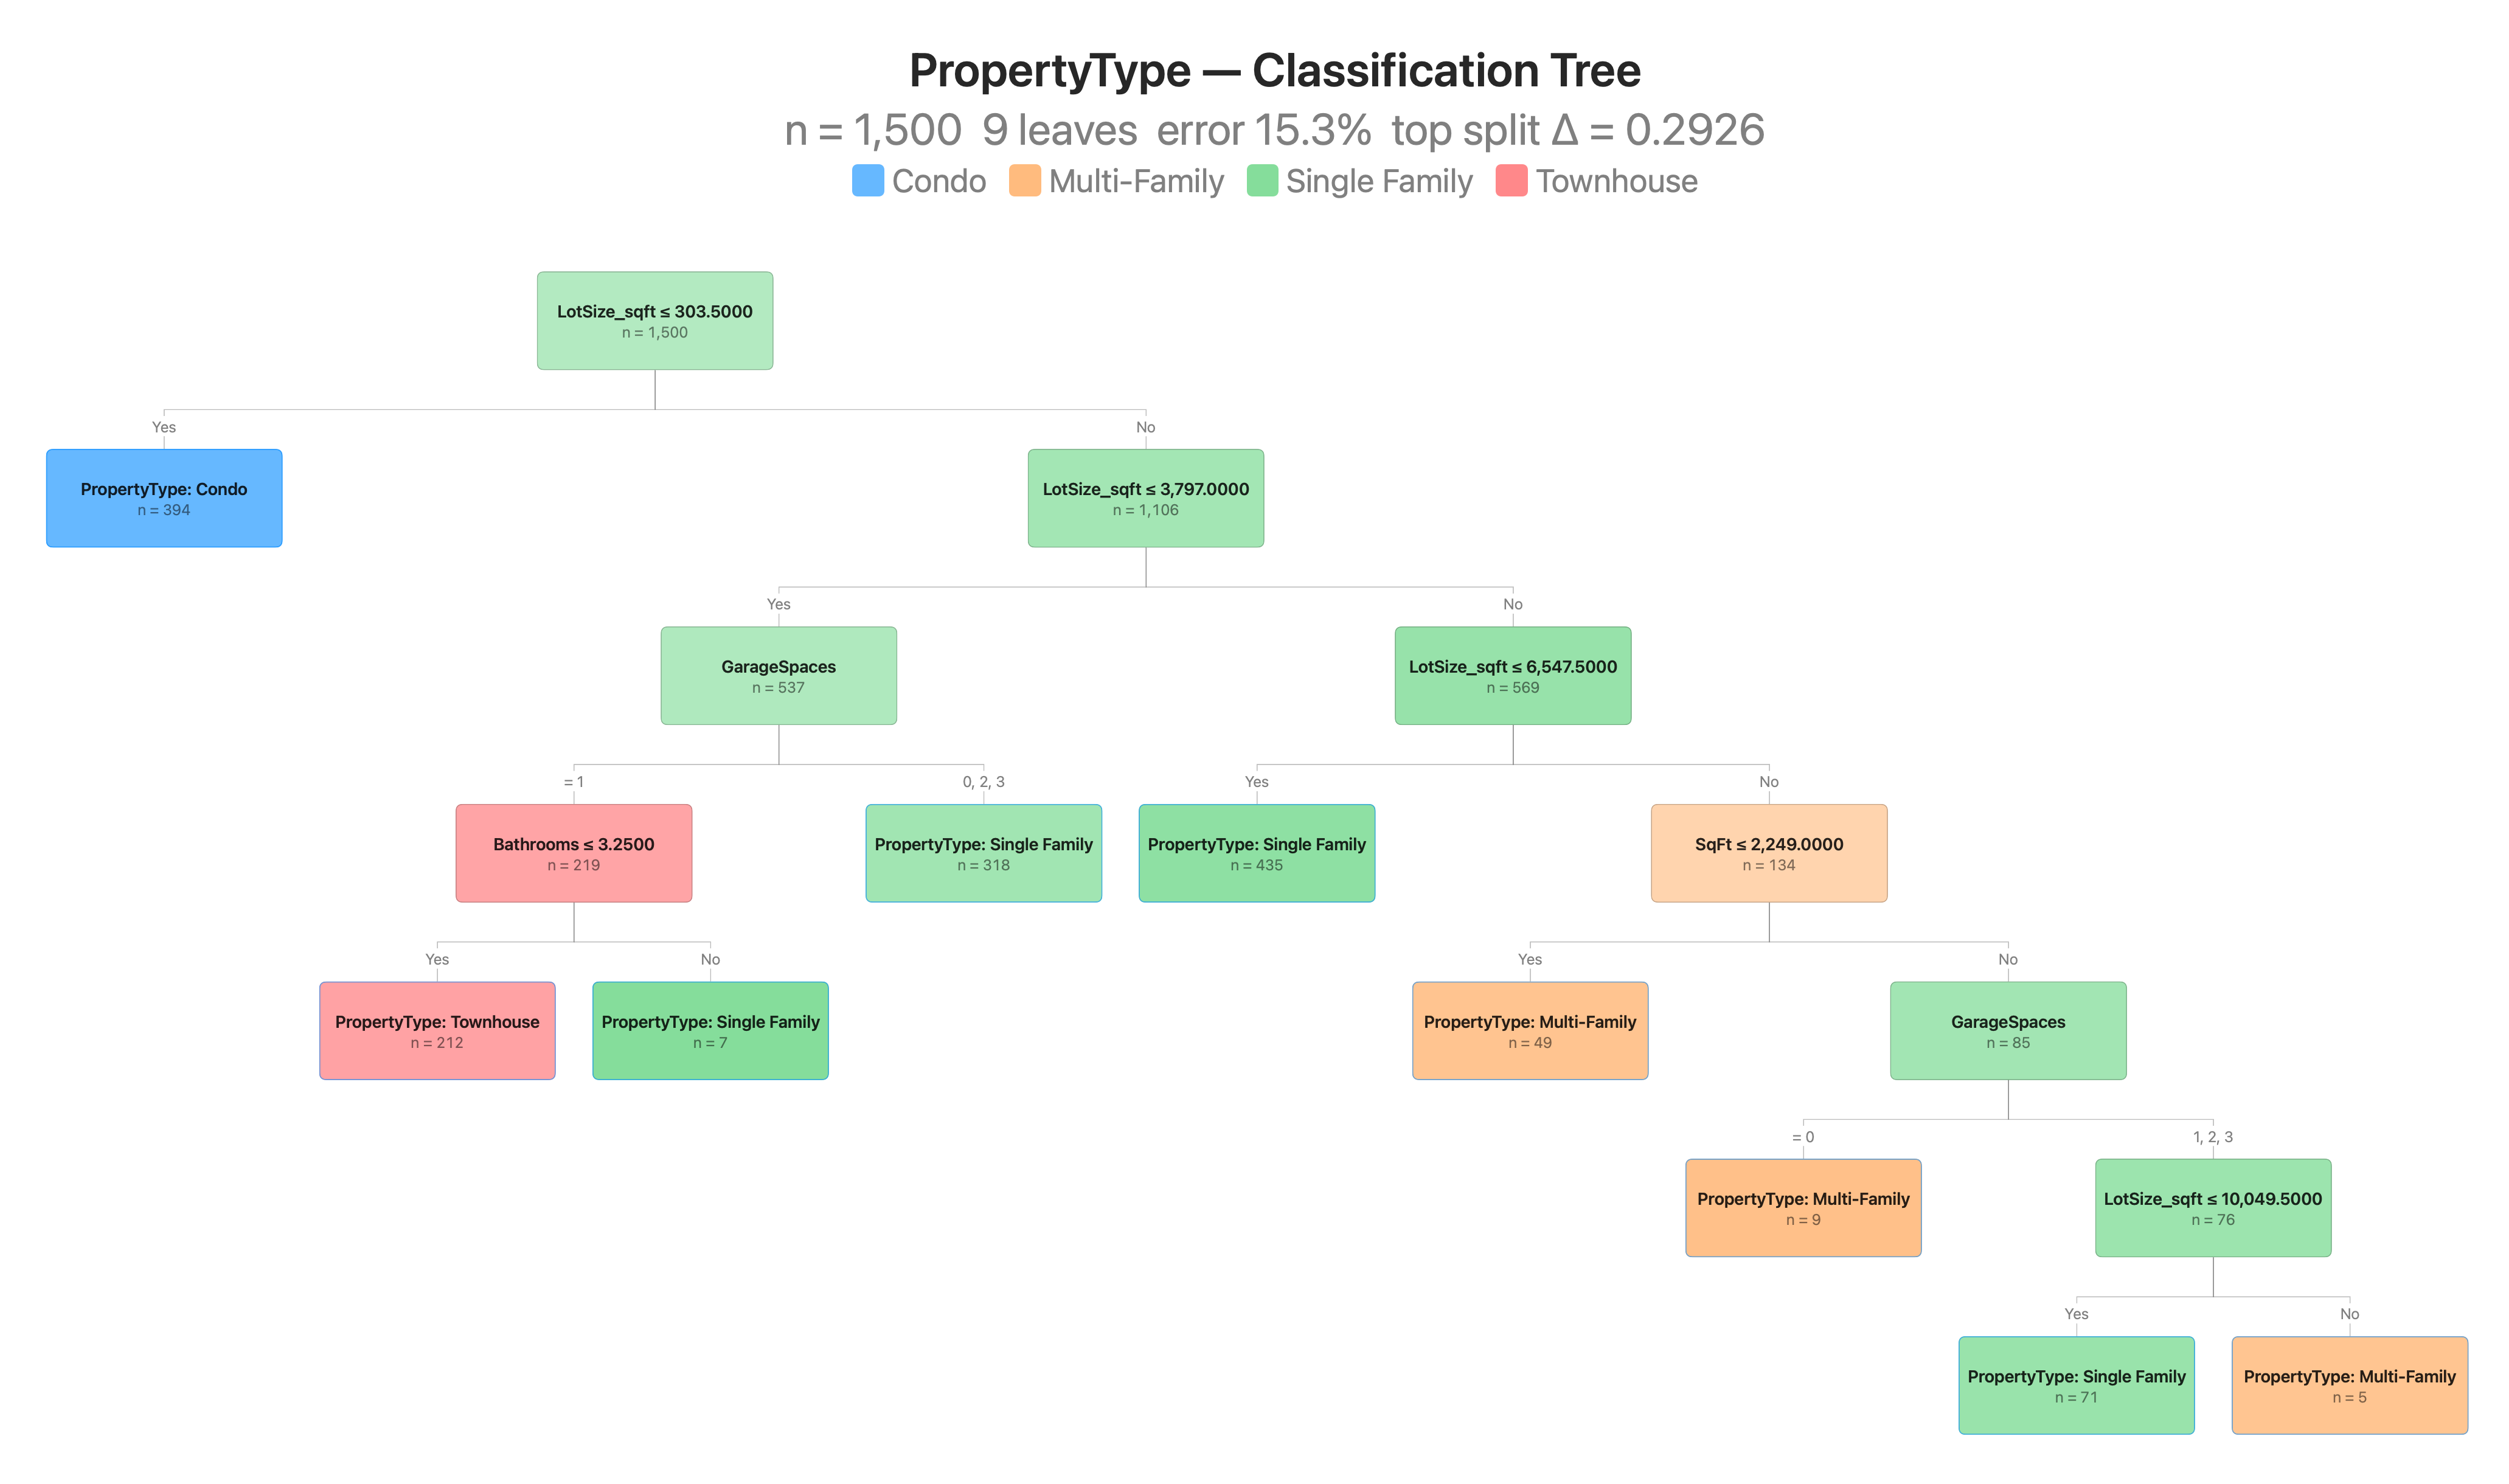
Interpretable predictive models.
Housing dataset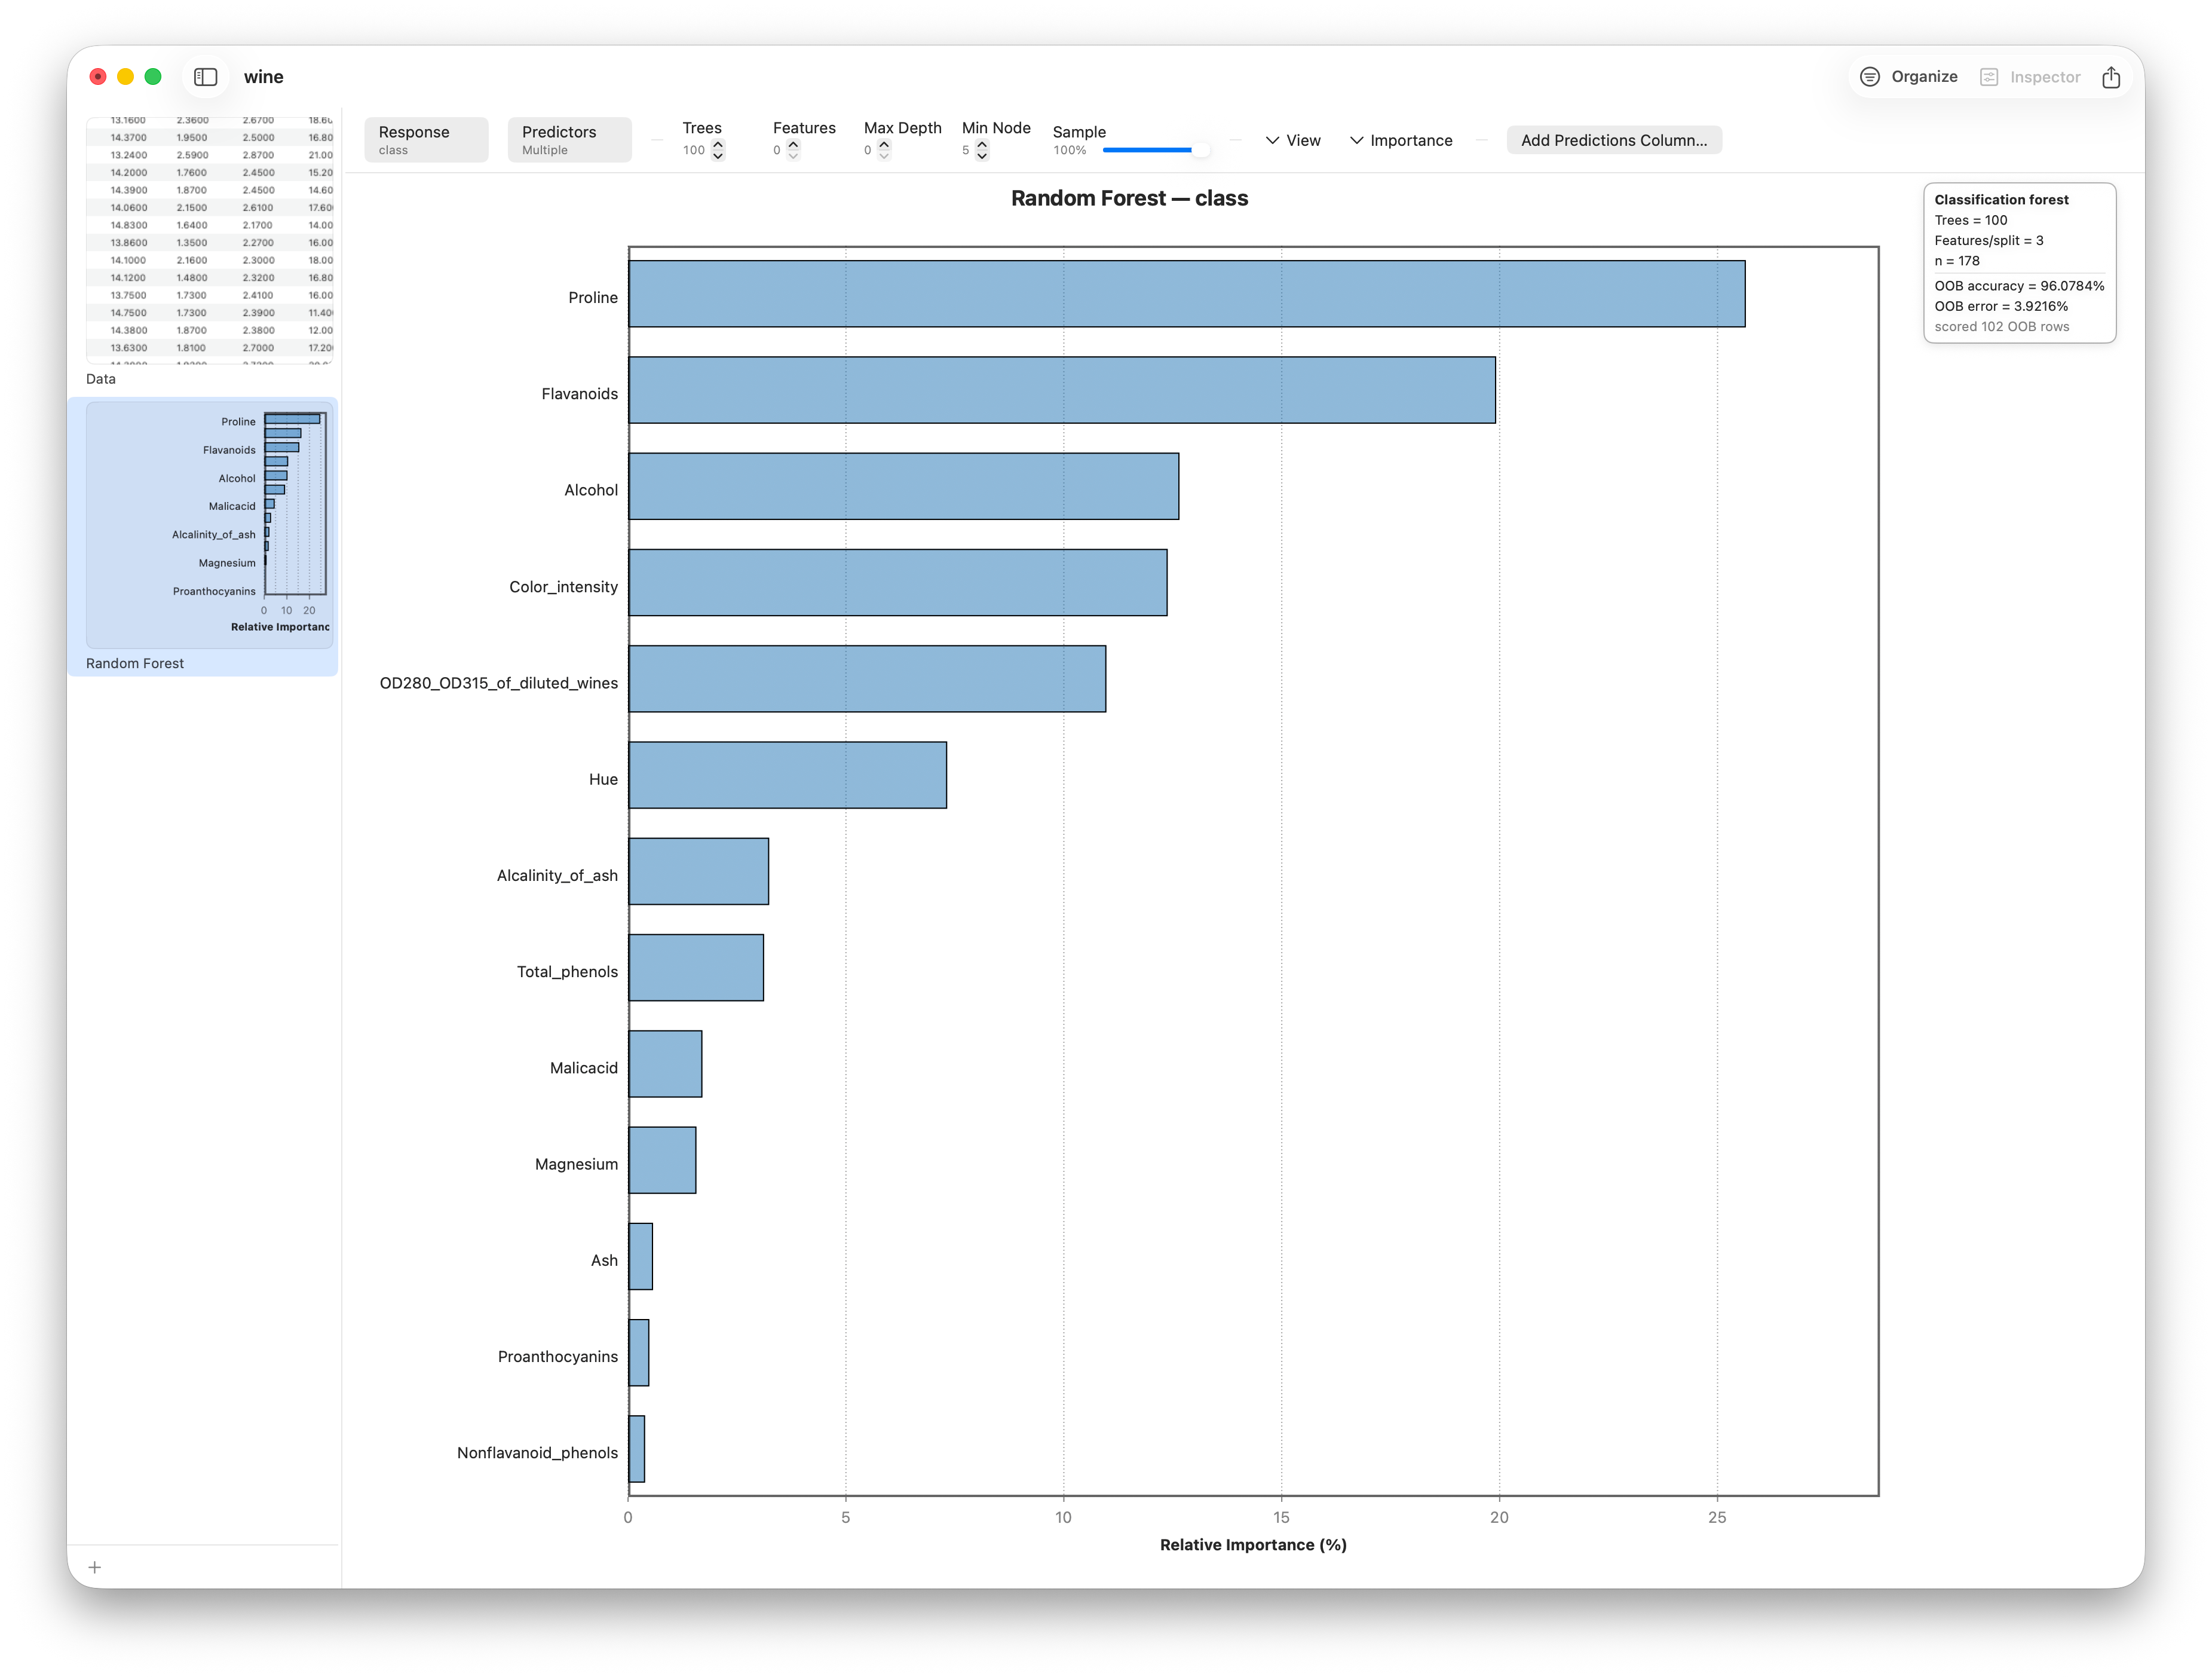
Stronger predictions via ensembles.
Wine dataset (public) Stratum