SPC software · Mac & Windows
Know whether the process is in control and capable — and be able to show how certain that is. Nine control charts with all eight Nelson rules, Phase I/II staging, and capability reported with confidence intervals rather than a bare point estimate. Native on Mac and Windows, bought once. Free to try on your own data before you decide.
Most SPC and quality suites are sold as an annual subscription — often quoted only after a sales call. Whatever the number turns out to be, it returns every year, and access stops when you stop paying.
Five years, five bills — and no software left if you stop.
Bought once. The version you buy keeps working forever, online or off, on Mac and Windows alike.
$249 for Professional — once, and it's yours.
| Capability | In Stratum |
|---|---|
| Variables control charts | I-MR (individuals & moving range), X̄-R and X̄-S for subgrouped data |
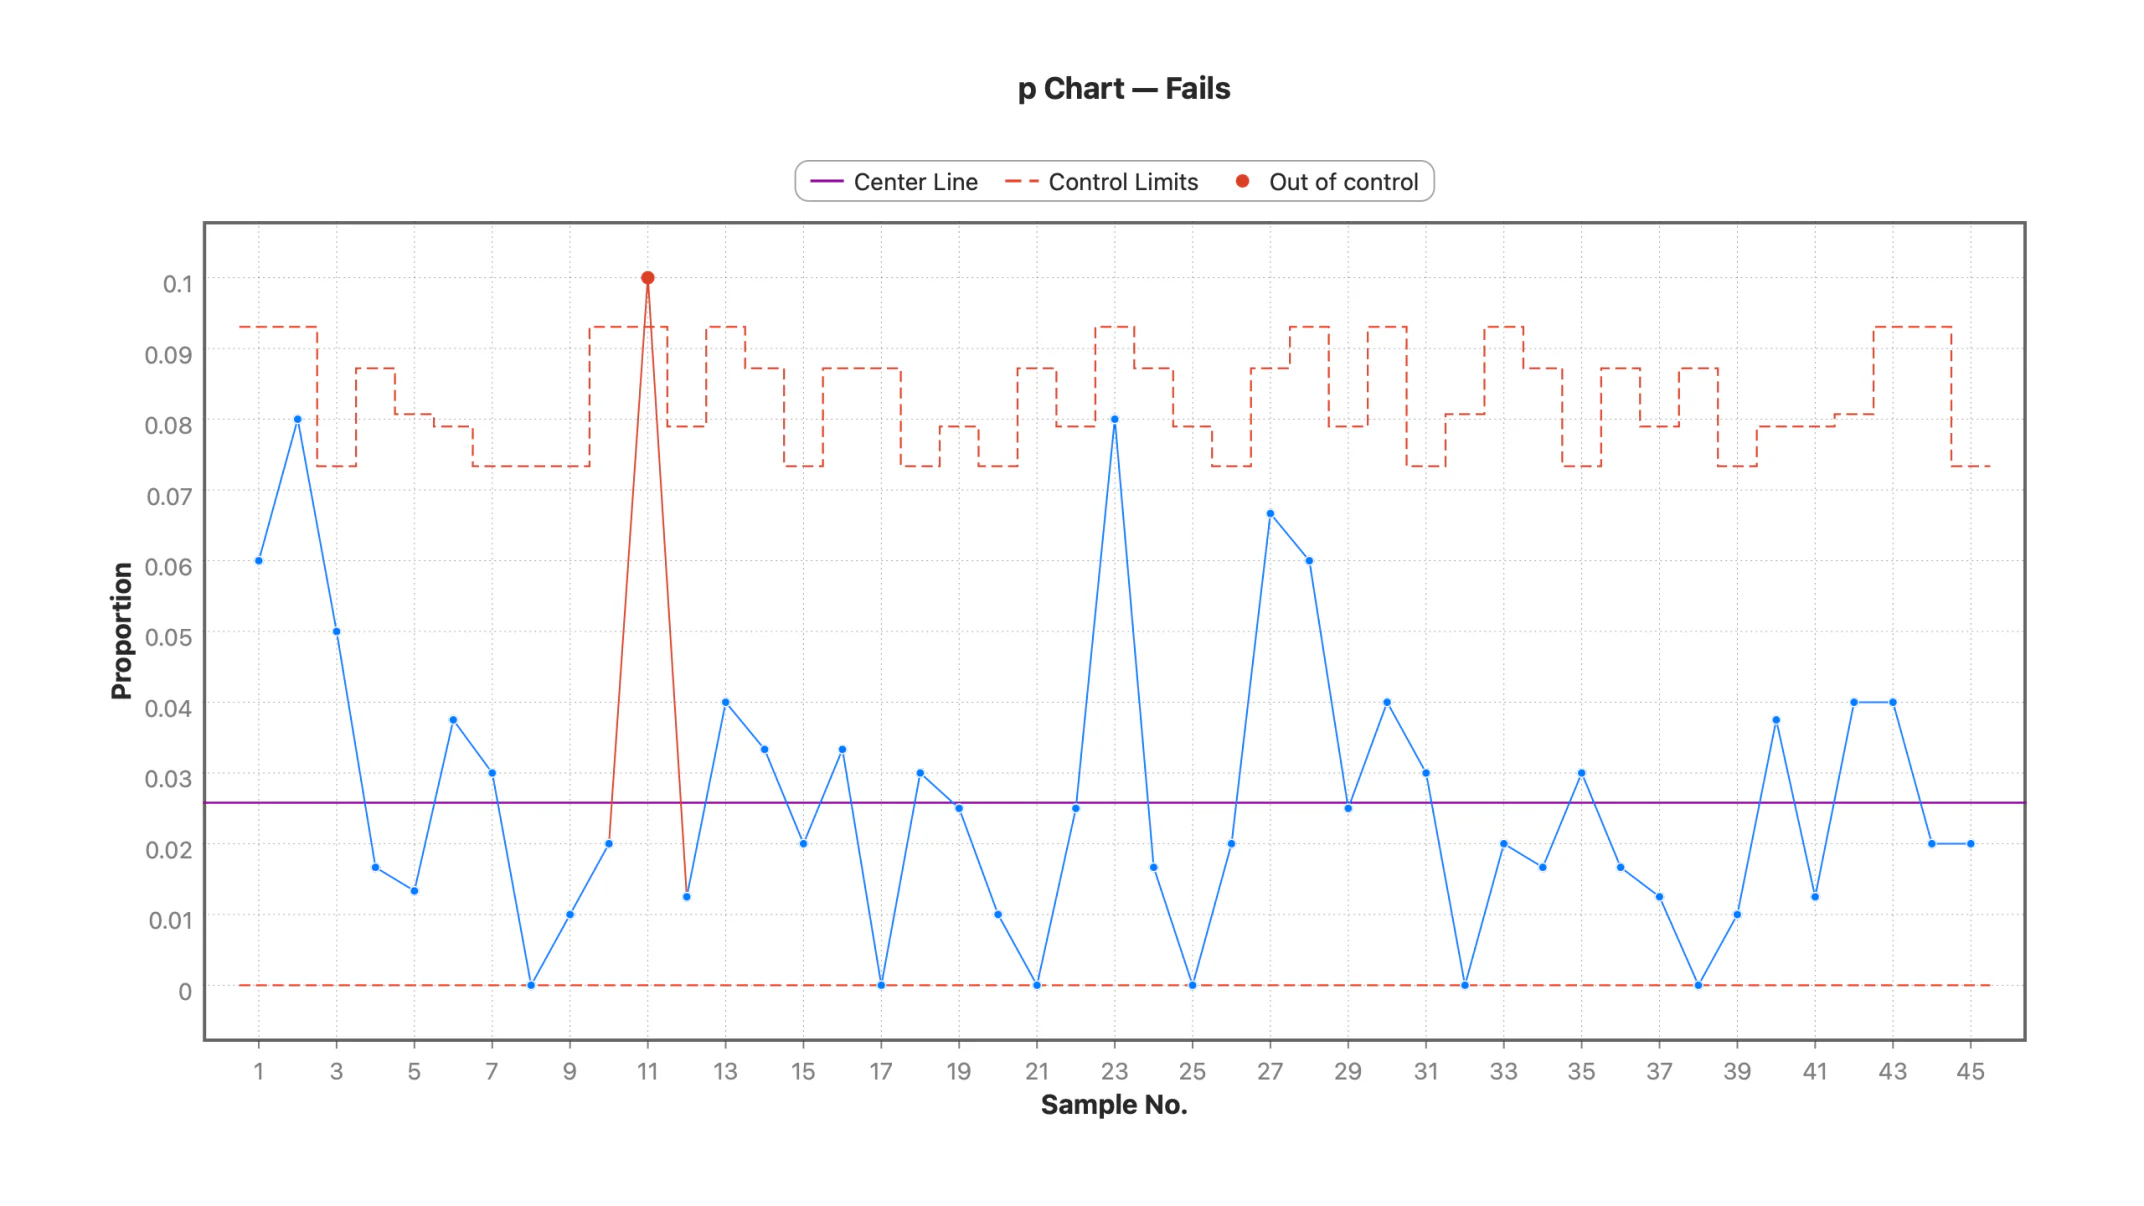
| Attributes control charts | p, np, c and u charts, with variable-width limits for unequal subgroup sizes |
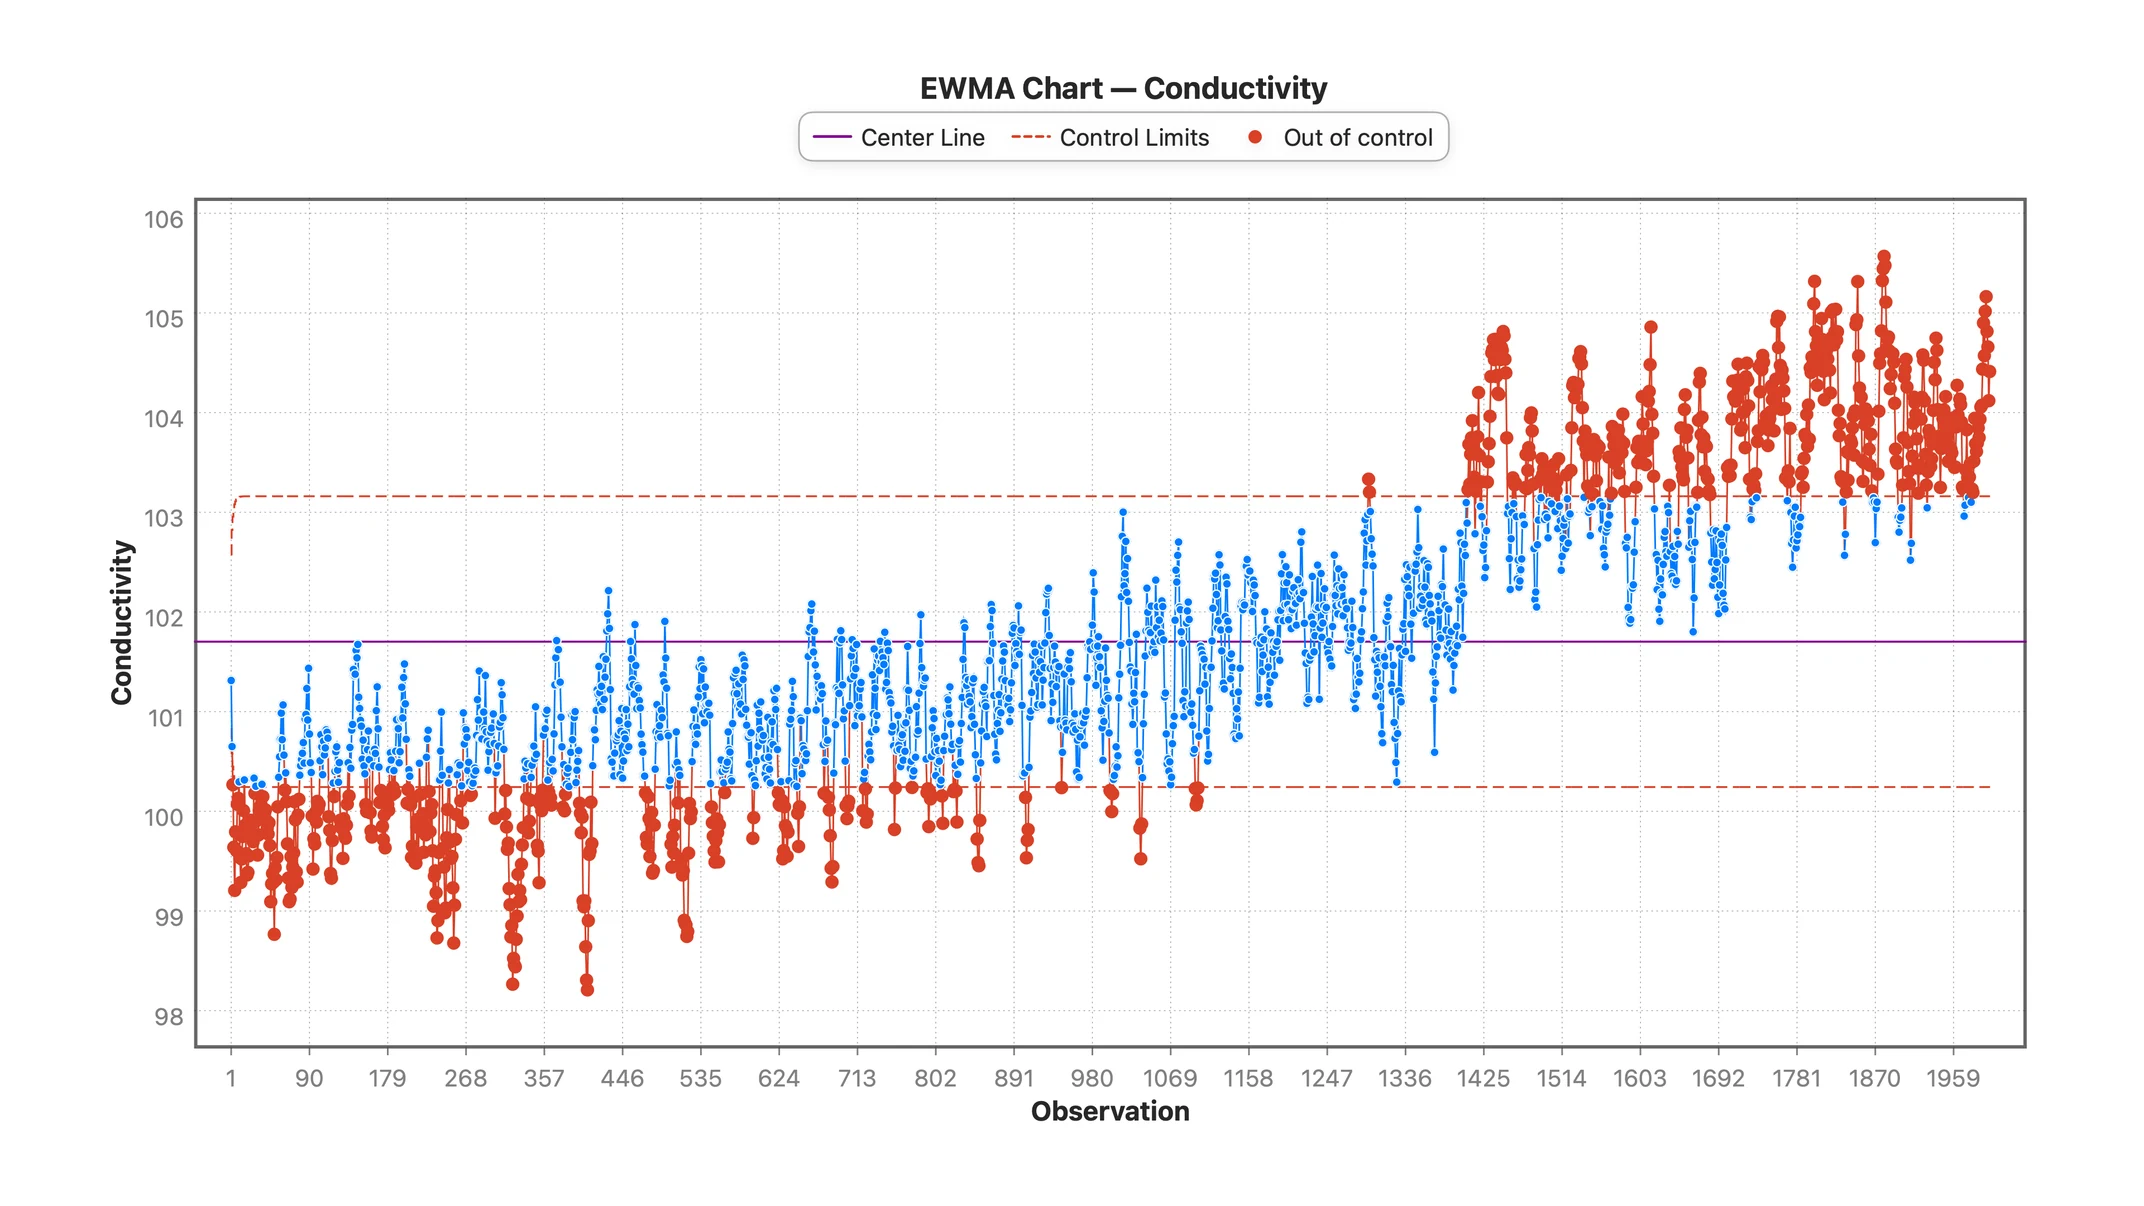
| Time-weighted charts | Tabular CUSUM with FIR head start; EWMA with time-varying limits |
| Out-of-control rules | All eight Nelson rules, toggled per chart, with a Western Electric preset |
| Phases & stages | Estimate from a Phase I baseline and carry the limits forward, or re-estimate per stage |
| Control limits | Estimated from your data, or given from historical and standard values |
| Within-sigma estimators | Pooled SD, S̄, R̄ or average moving range — with unbiasing constants |
| Process capability | Cp, Cpk, CPL, CPU, Cpm, Pp, Ppk, PPL, PPU, observed and expected PPM, Z-bench within and overall, capability histogram |
| Capability intervals | Confidence intervals on every index, from the exact noncentral t rather than a normal approximation |
| Non-normal capability | Lognormal, Weibull and exponential fits with percentile indices to ISO 22514-2, and a fit test behind the choice |
| Linked selection | Select points on a control chart and the same rows highlight in the datasheet and every other chart |
| Everyday stats & charts | 30+ charts, ANOVA, regression, contingency |
| Data in | CSV, Excel, fixed-width ASCII, SPSS .sav and Stata .dta — to ~5 million rows |
| Numerical validation | Published validation record — the outside tool named for every statistic, including the gaps |
| Pricing | One-time (Professional $249) — no subscription |
Control Charts — I-MR for individual measurements, with control limits and all eight Nelson rules.
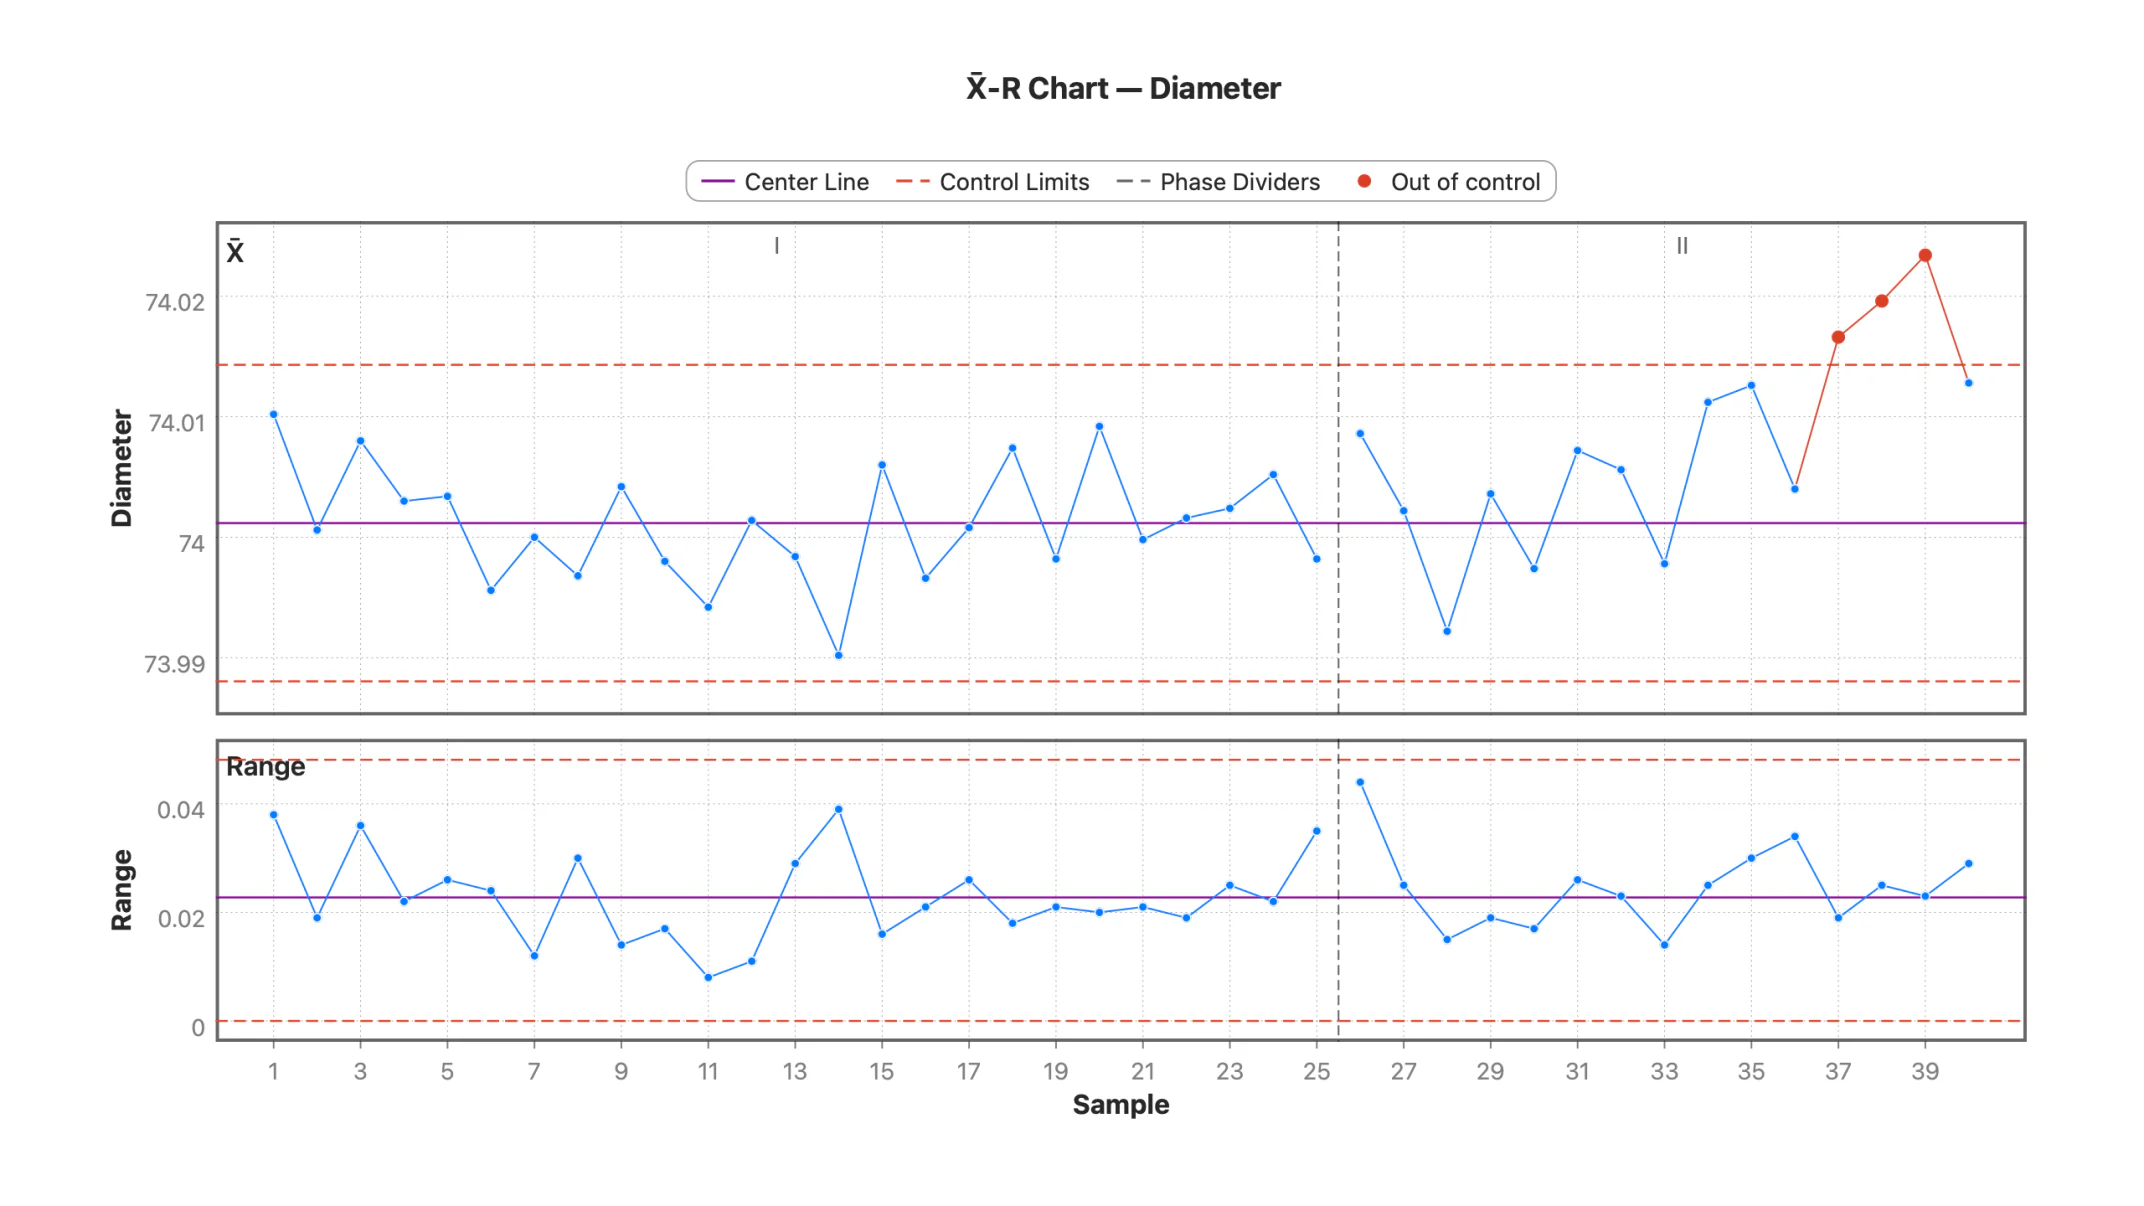
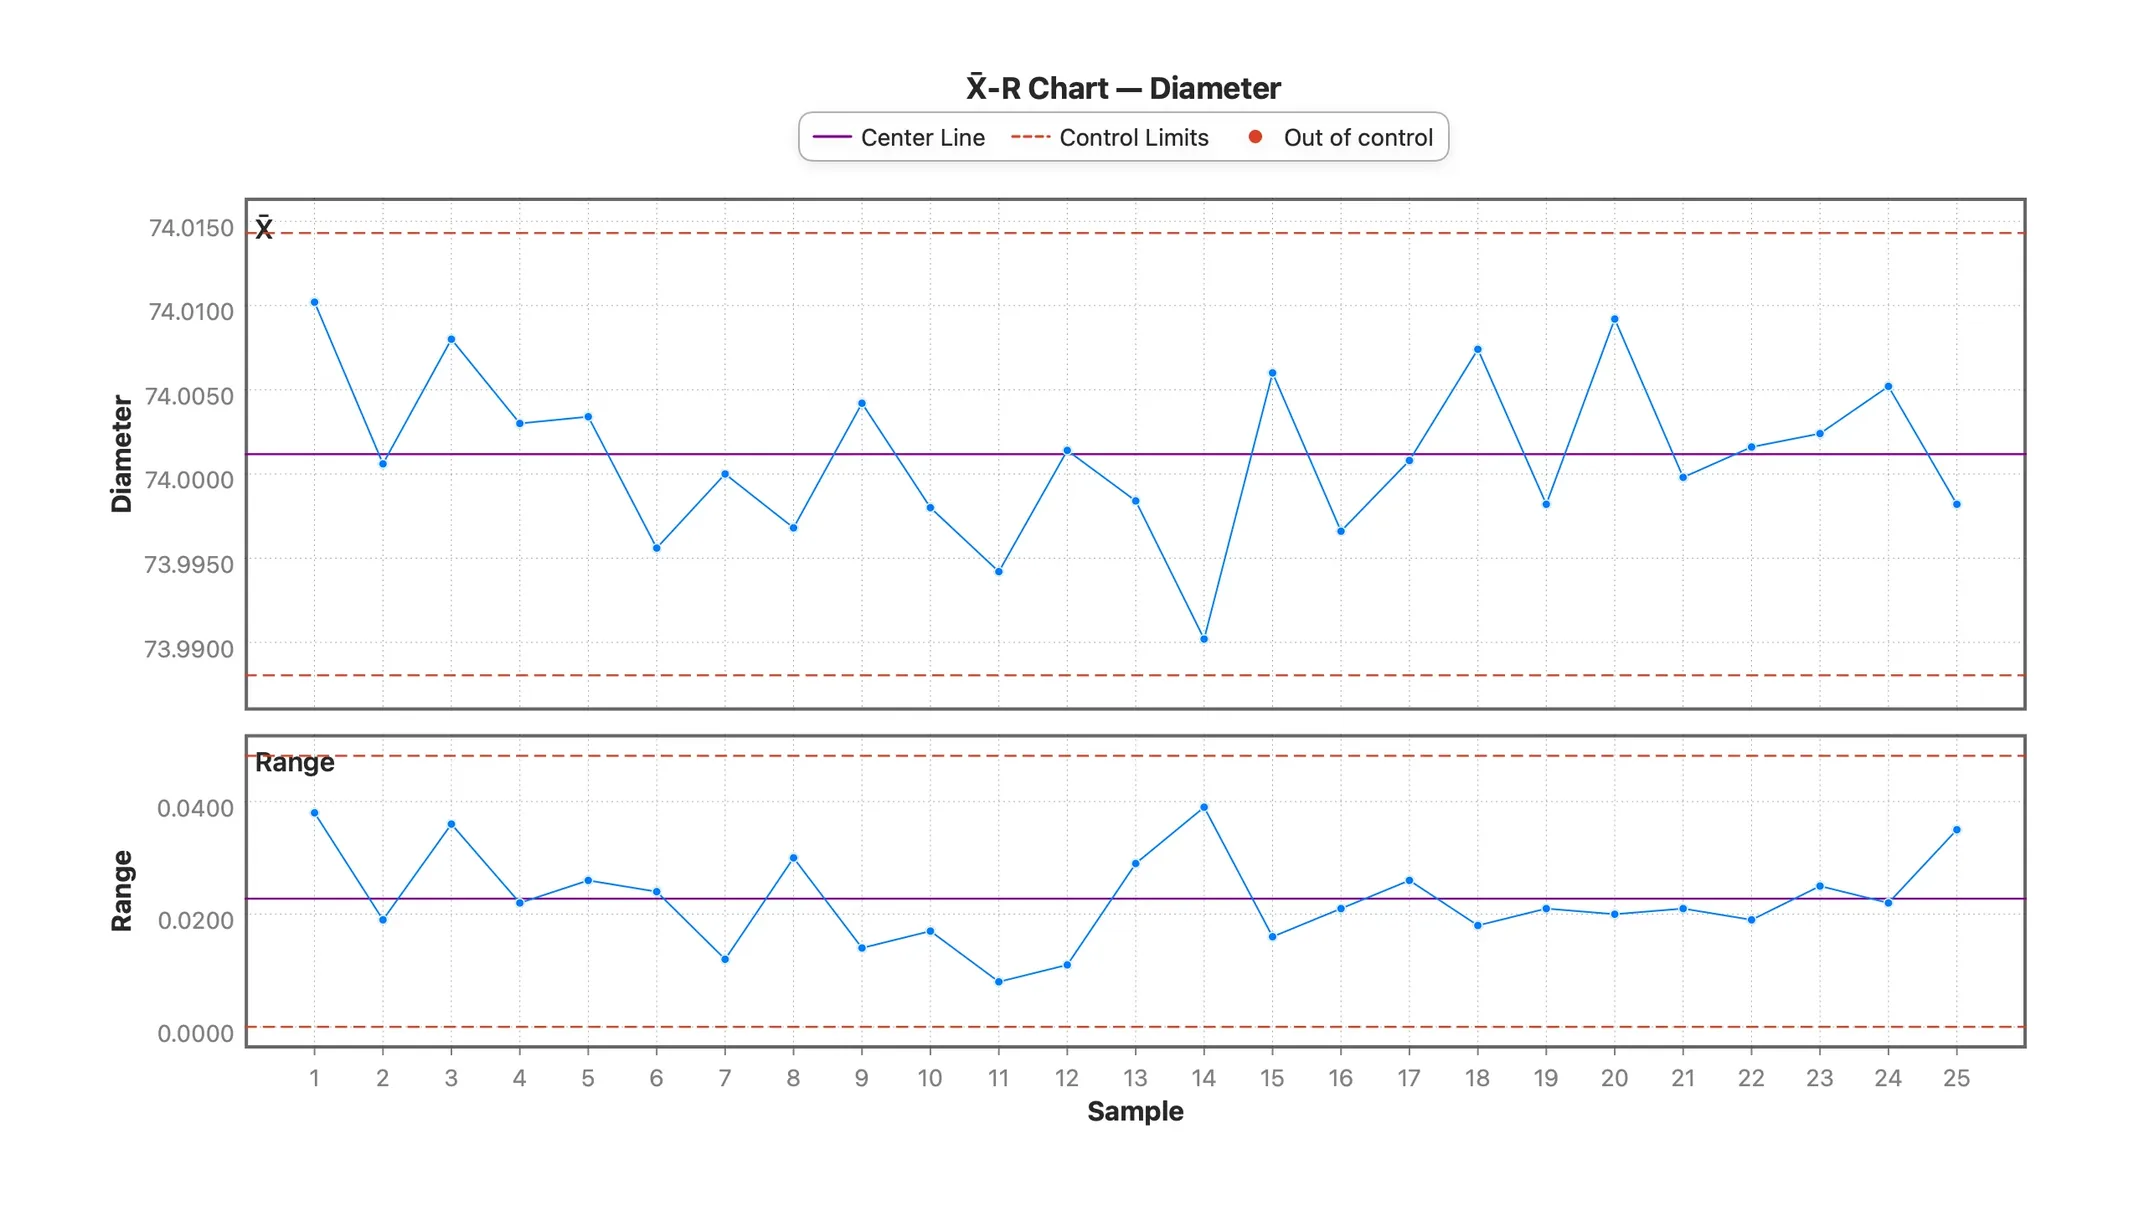
Control Charts — X̄-R and X̄-S, plotting subgroup means against limits from the range or the standard deviation, your choice.
Attribute Charts — p and np for defectives, c and u for defects, with variable-width limits for unequal subgroup sizes.
Linked Selection — drag a rectangle around the out-of-control points and the same rows light up in the datasheet and in every other chart, so a violation leads straight back to the units behind it.
Phases & Stages — estimate limits from a Phase I baseline and extend them across everything after it, or re-estimate inside each stage when the process is meant to have changed.
Distribution Fit — fit a lognormal, Weibull or exponential, then compute the indices from the fitted percentiles the ISO 22514-2 way, with the goodness-of-fit test alongside.
CUSUM & EWMA — tabular CUSUM with FIR head start, and EWMA with time-varying limit widths.
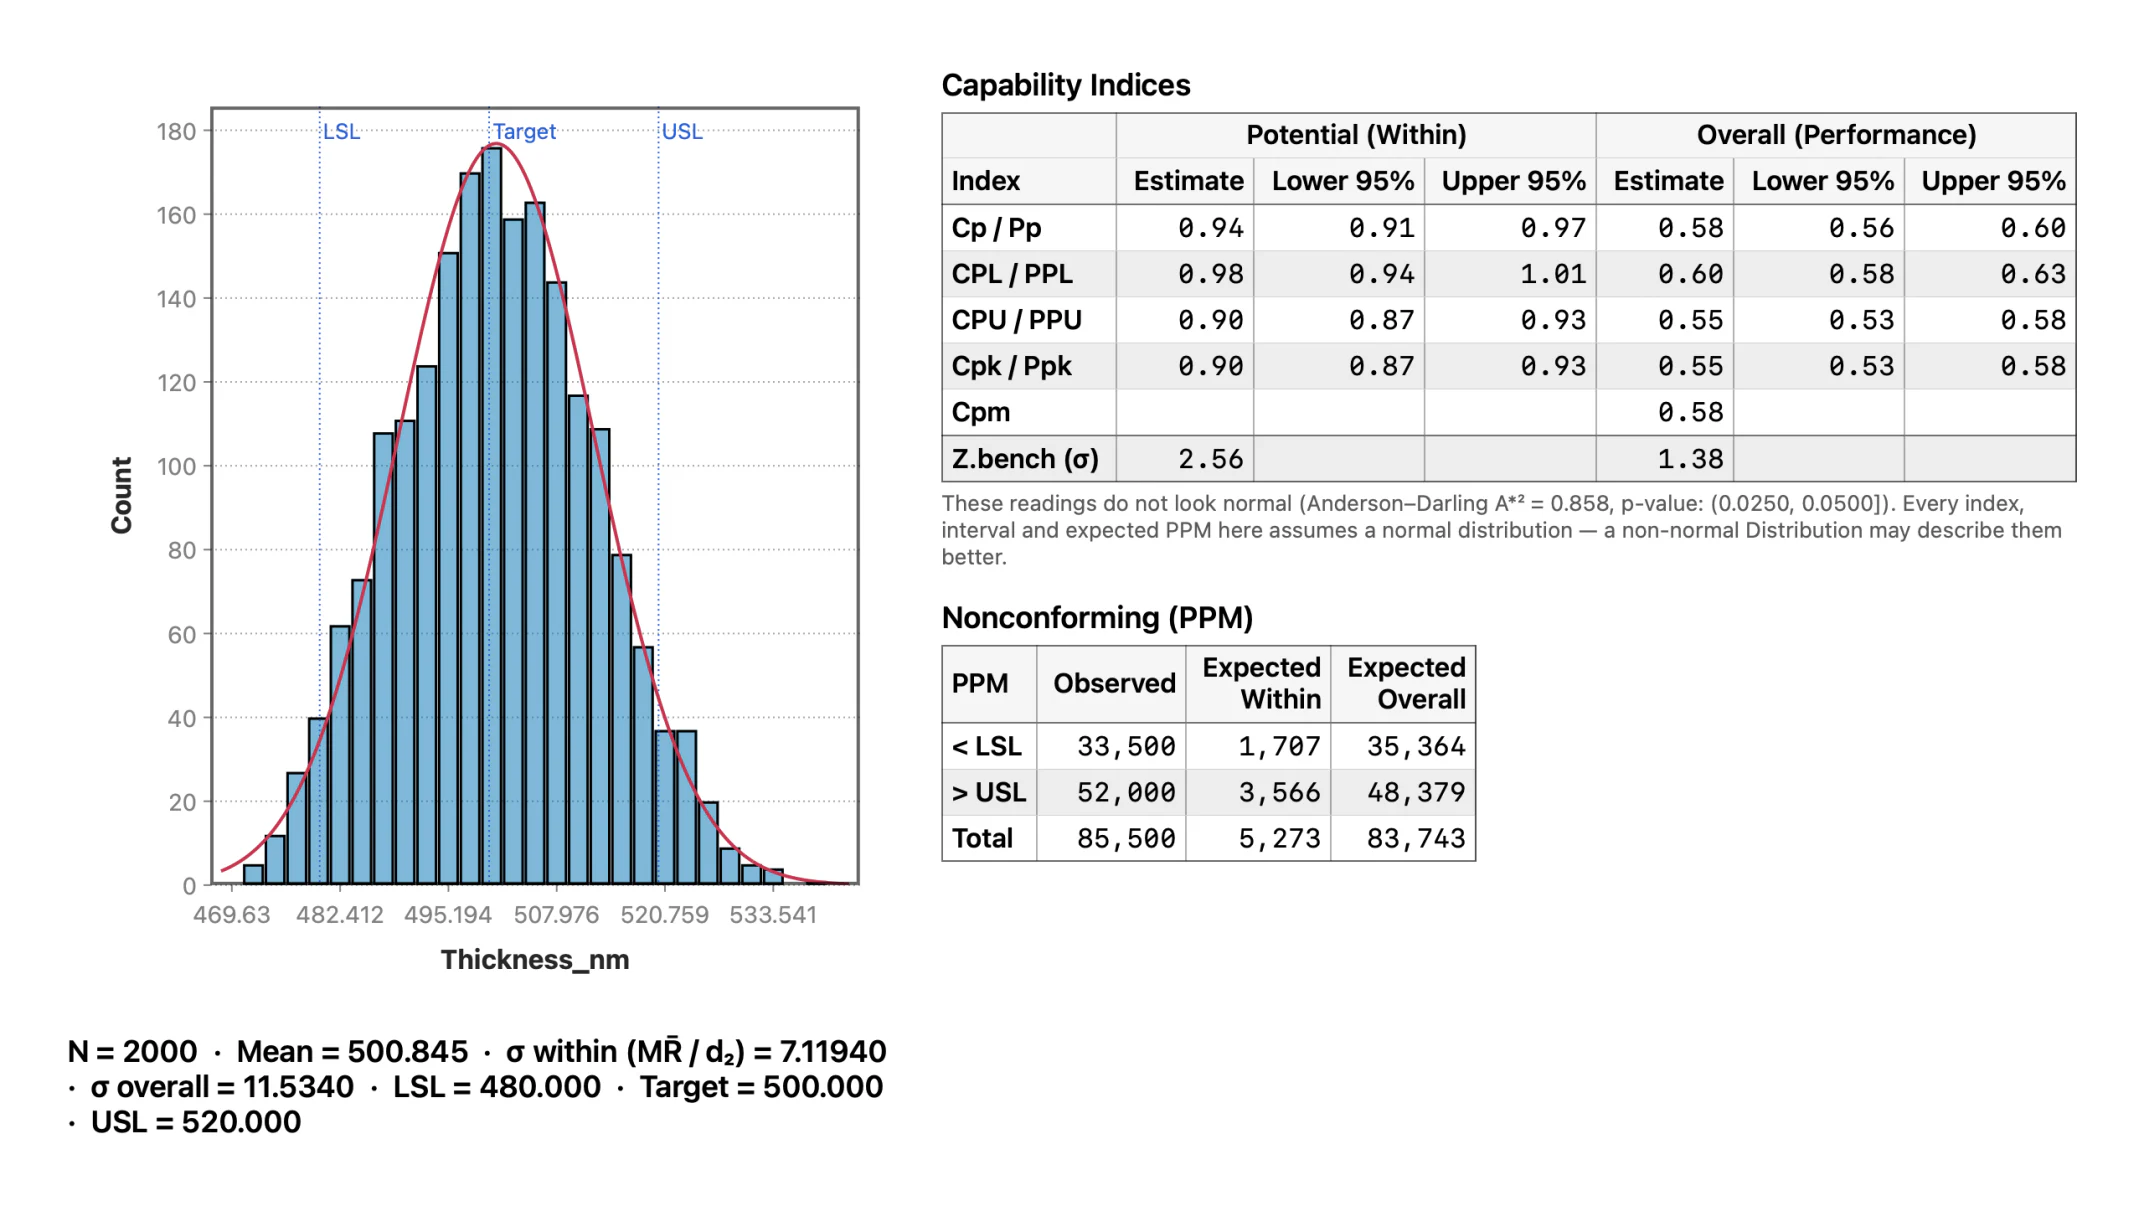
Process Capability — Cp, Cpk, Cpm, Pp, Ppk, PPM and Z-bench, with within and overall sigma side by side, confidence intervals on every index, and a capability histogram.
Summary, ANOVA, t-tests — means, SD, quartiles; one-way ANOVA with Tukey HSD; two-sample and paired t, with non-parametric equivalents.
Linear Regression — coefficients with CIs, VIF, leverage, Cook's D, R², AIC and BIC.
30+ chart types — histogram, box, violin, density, Pareto, scatter with OLS/LOESS, treemap, mosaic and more.
Point-and-click throughout — and equally native on a Mac, where most SPC suites are Windows-first.
Stratum's Professional edition includes SPC control charts and full process-capability analysis (Cp, Cpk, Pp, Ppk, and PPM) alongside the everyday toolkit — descriptive statistics, ANOVA, correlation, contingency tests, and regression with diagnostics — plus data mining (decision trees, random forests, boosted trees, clustering) and multivariate methods (PCA, correspondence analysis, MANOVA). Import your .csv, .xlsx, fixed-width ASCII, SPSS .sav or Stata .dta and try it on your own process data first.
Nine: I-MR (individuals and moving range), X̄-R and X̄-S for subgrouped data, p and np for defectives, c and u for defects, and CUSUM and EWMA for time-weighted monitoring — with all eight Nelson rules, toggled per chart.
Yes — Cp, Cpk, CPL, CPU and Cpm against your specification limits, with Pp, Ppk, PPL and PPU on the overall sigma, observed and expected PPM, Z-bench within and overall, and a capability histogram. Each index is reported with a confidence interval, computed from the exact noncentral t.
Yes. Point a phase column at the run and Stratum will either estimate the limits from the Phase I baseline and carry them forward, or re-estimate the center and limits inside each stage. You can also supply limits directly from historical or standard values instead of estimating them.
Fit a lognormal, Weibull or exponential distribution and Stratum computes the capability indices from the fitted percentiles, following ISO 22514-2, with the goodness-of-fit test shown next to the choice.
Yes — Stratum is a native app for both macOS 14+ and Windows 10/11, so SPC works the same on either.
No — Stratum is a one-time purchase. You can upgrade from Standard to Professional later.
 Stratum