 Stratum
Import & First Look
Every analysis starts the same way: you have a file, and you need to see it. Here's how Stratum takes you from a raw CSV to a clean, typed dataset and a complete statistical summary — in under a minute, without writing a line of code.
You've just downloaded a spreadsheet of housing listings. Fifteen columns, fifteen hundred rows. Before you can ask a single interesting question — Are prices skewed? Which neighborhoods cost more? Does age predict value? — you need to get the data into a tool and orient yourself. In a lot of statistical software, that's where the friction starts: import wizards, type declarations, a notebook to spin up. In Stratum, you just drag the file in.
Importing is just drag-and-drop
Getting data in is as simple as dragging the CSV onto Stratum's window — or its icon in the Dock. The app detects the delimiter (comma, tab, or semicolon), recognizes that the first row is a header, and reads the file straight in. For a tidy file, there's nothing else to do.
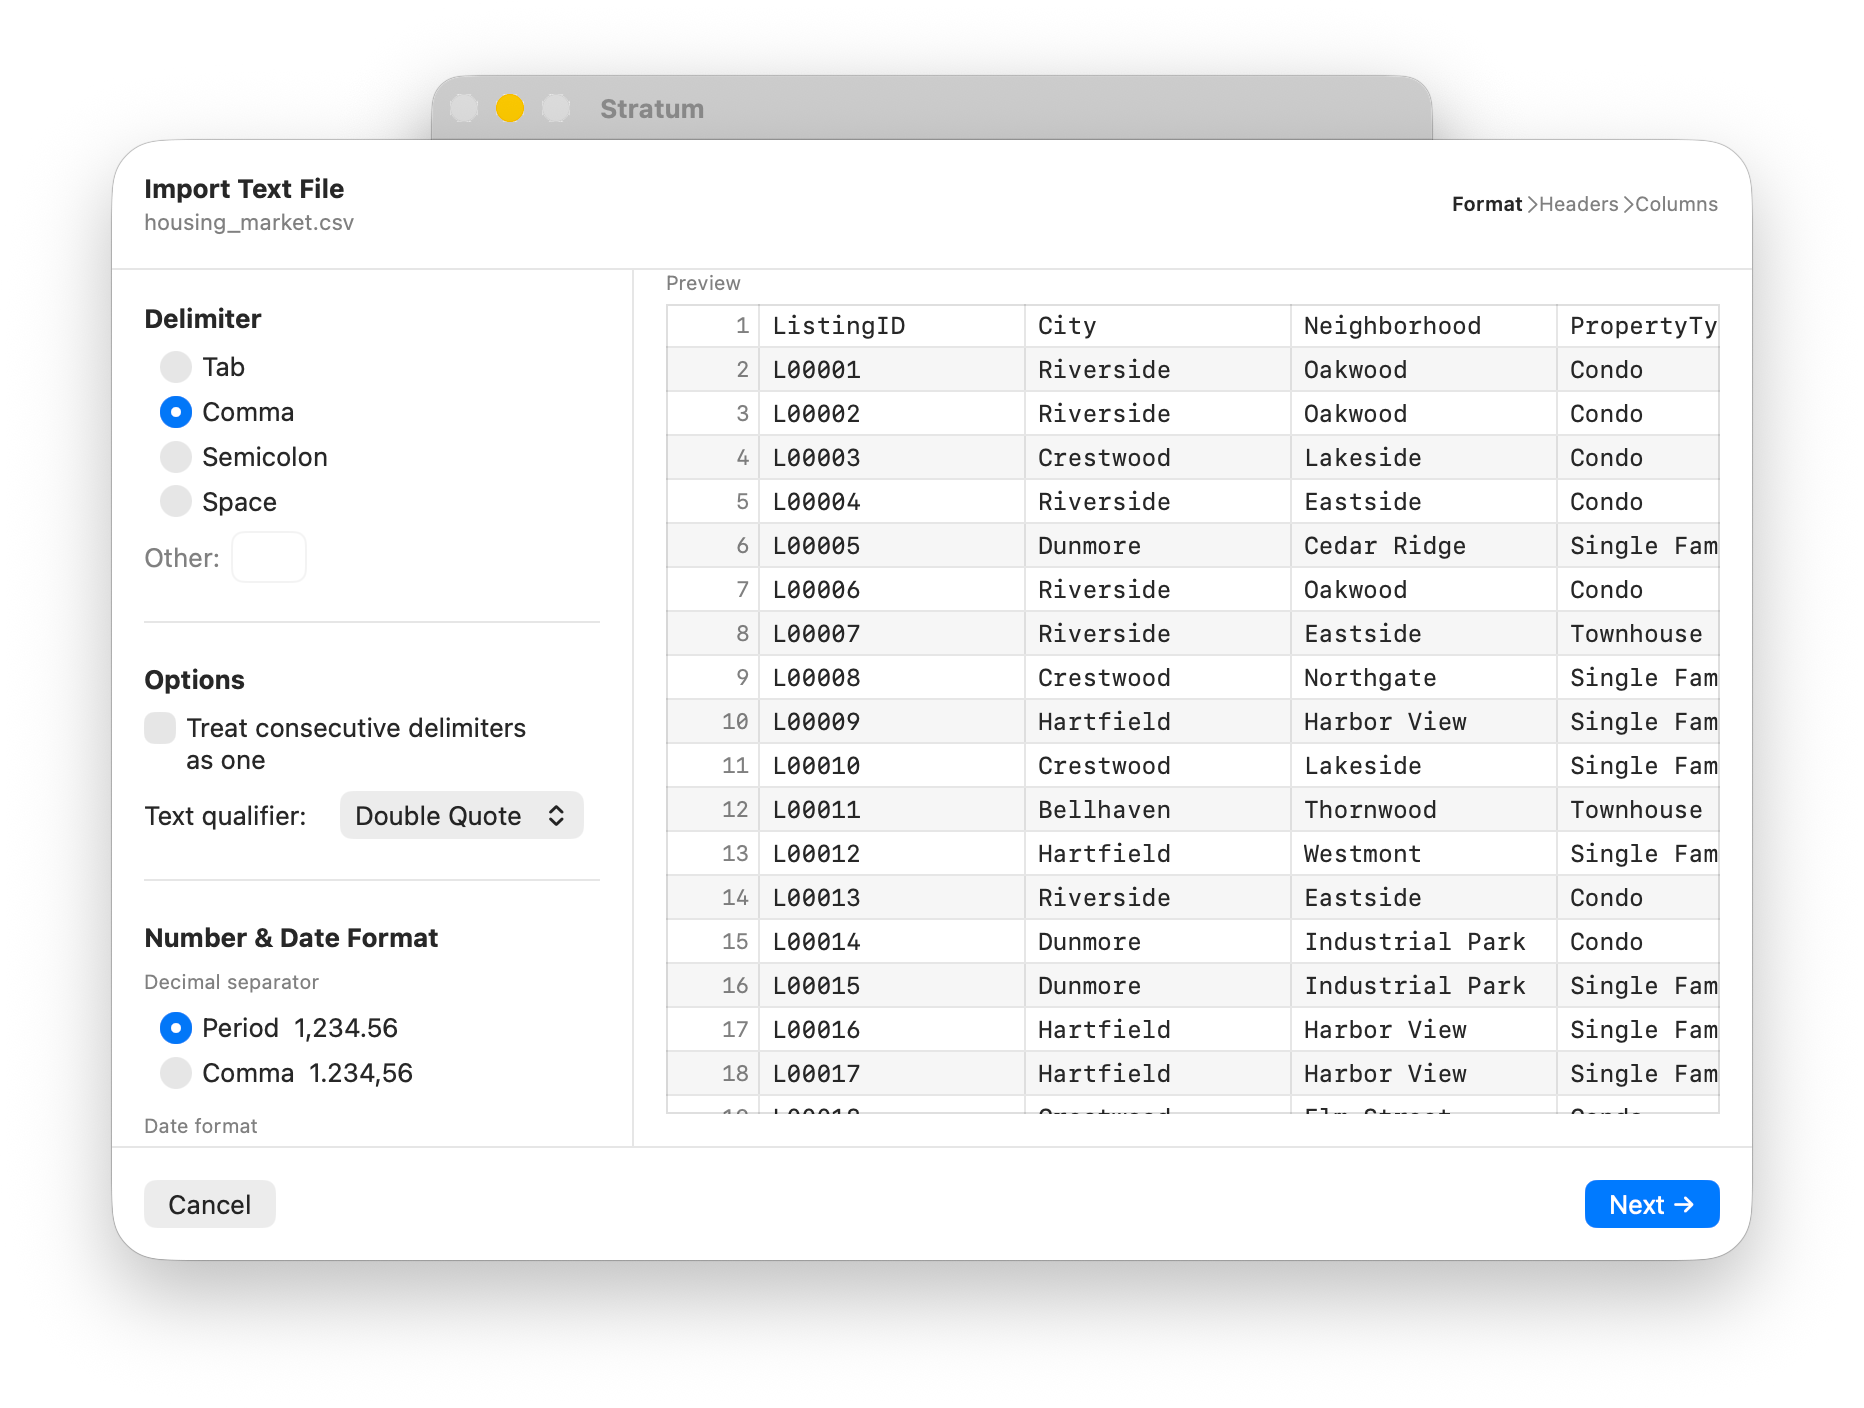
Need finer control — a custom delimiter, a specific text encoding, or rows to skip at the top of the file? There's a full import wizard for that too. But for clean files like this one, drag-and-drop just works.
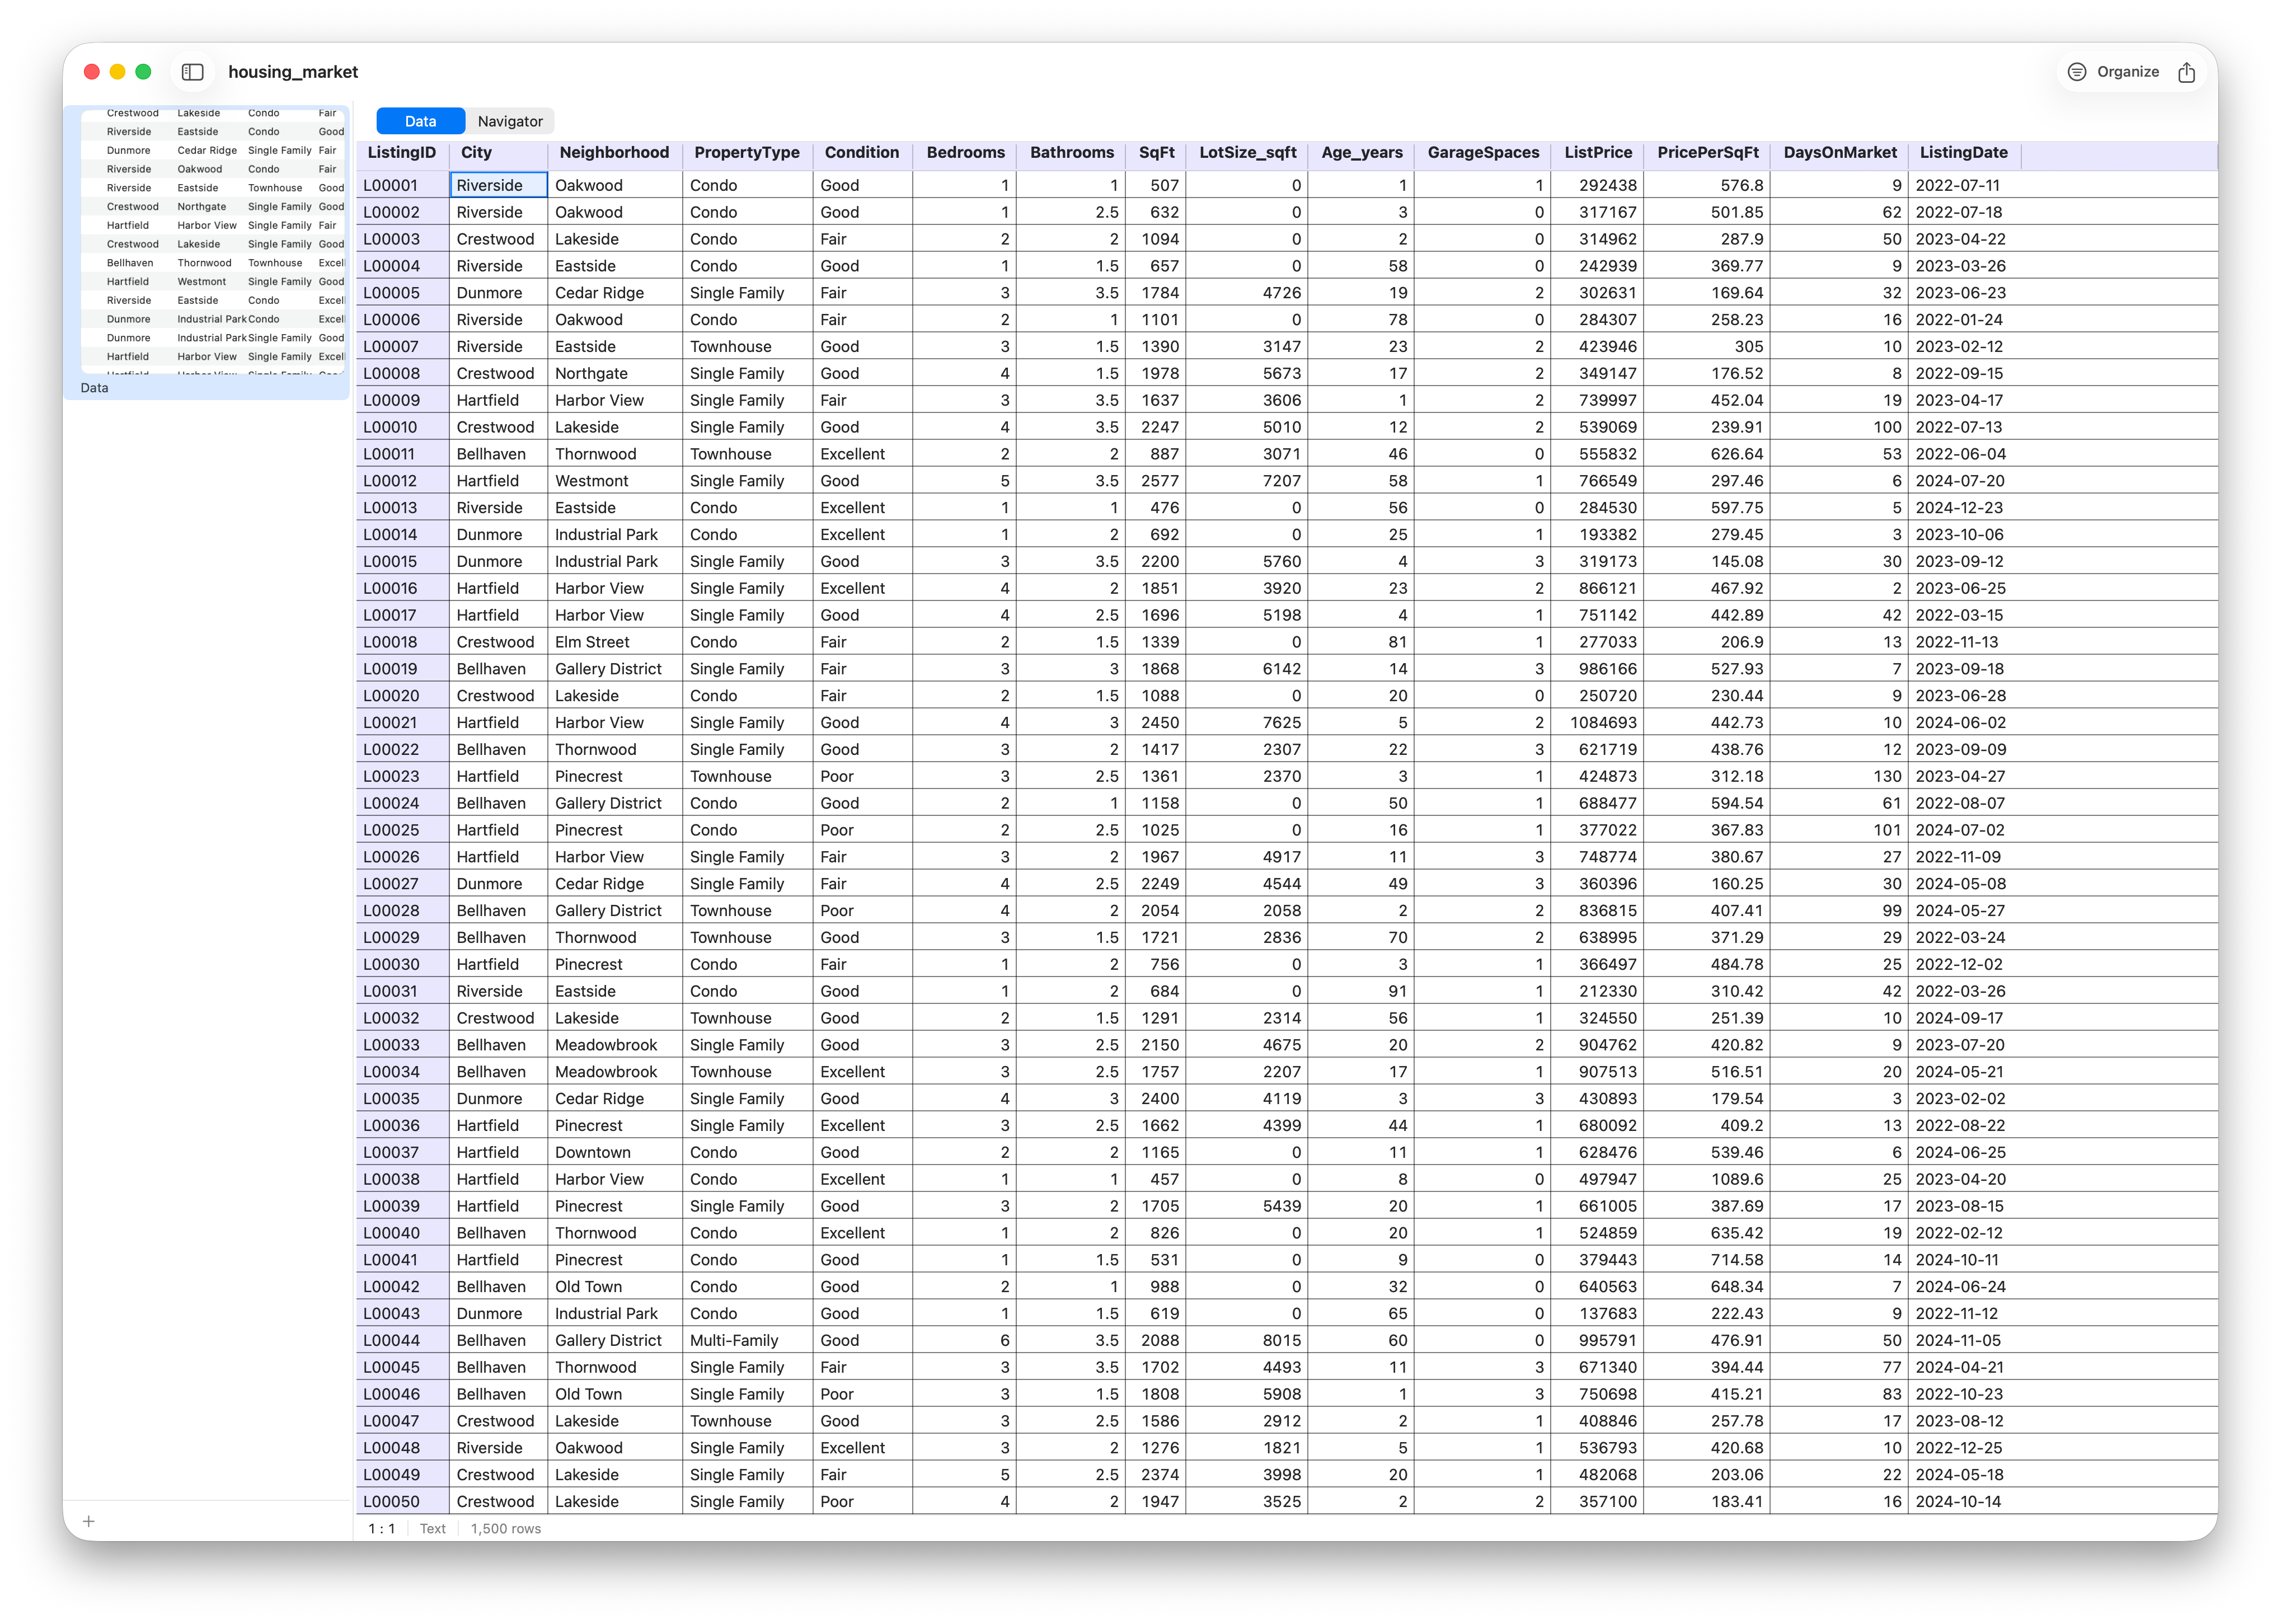
And there it is — all fifteen hundred rows, in a fast, native table that scrolls smoothly even as the data grows.
Excel files (.xlsx) work the same way, and when you're ready to save your work, Stratum's native .stratum format keeps everything — data, analyses, filters, and styling — together in a single document you can reopen exactly where you left off.
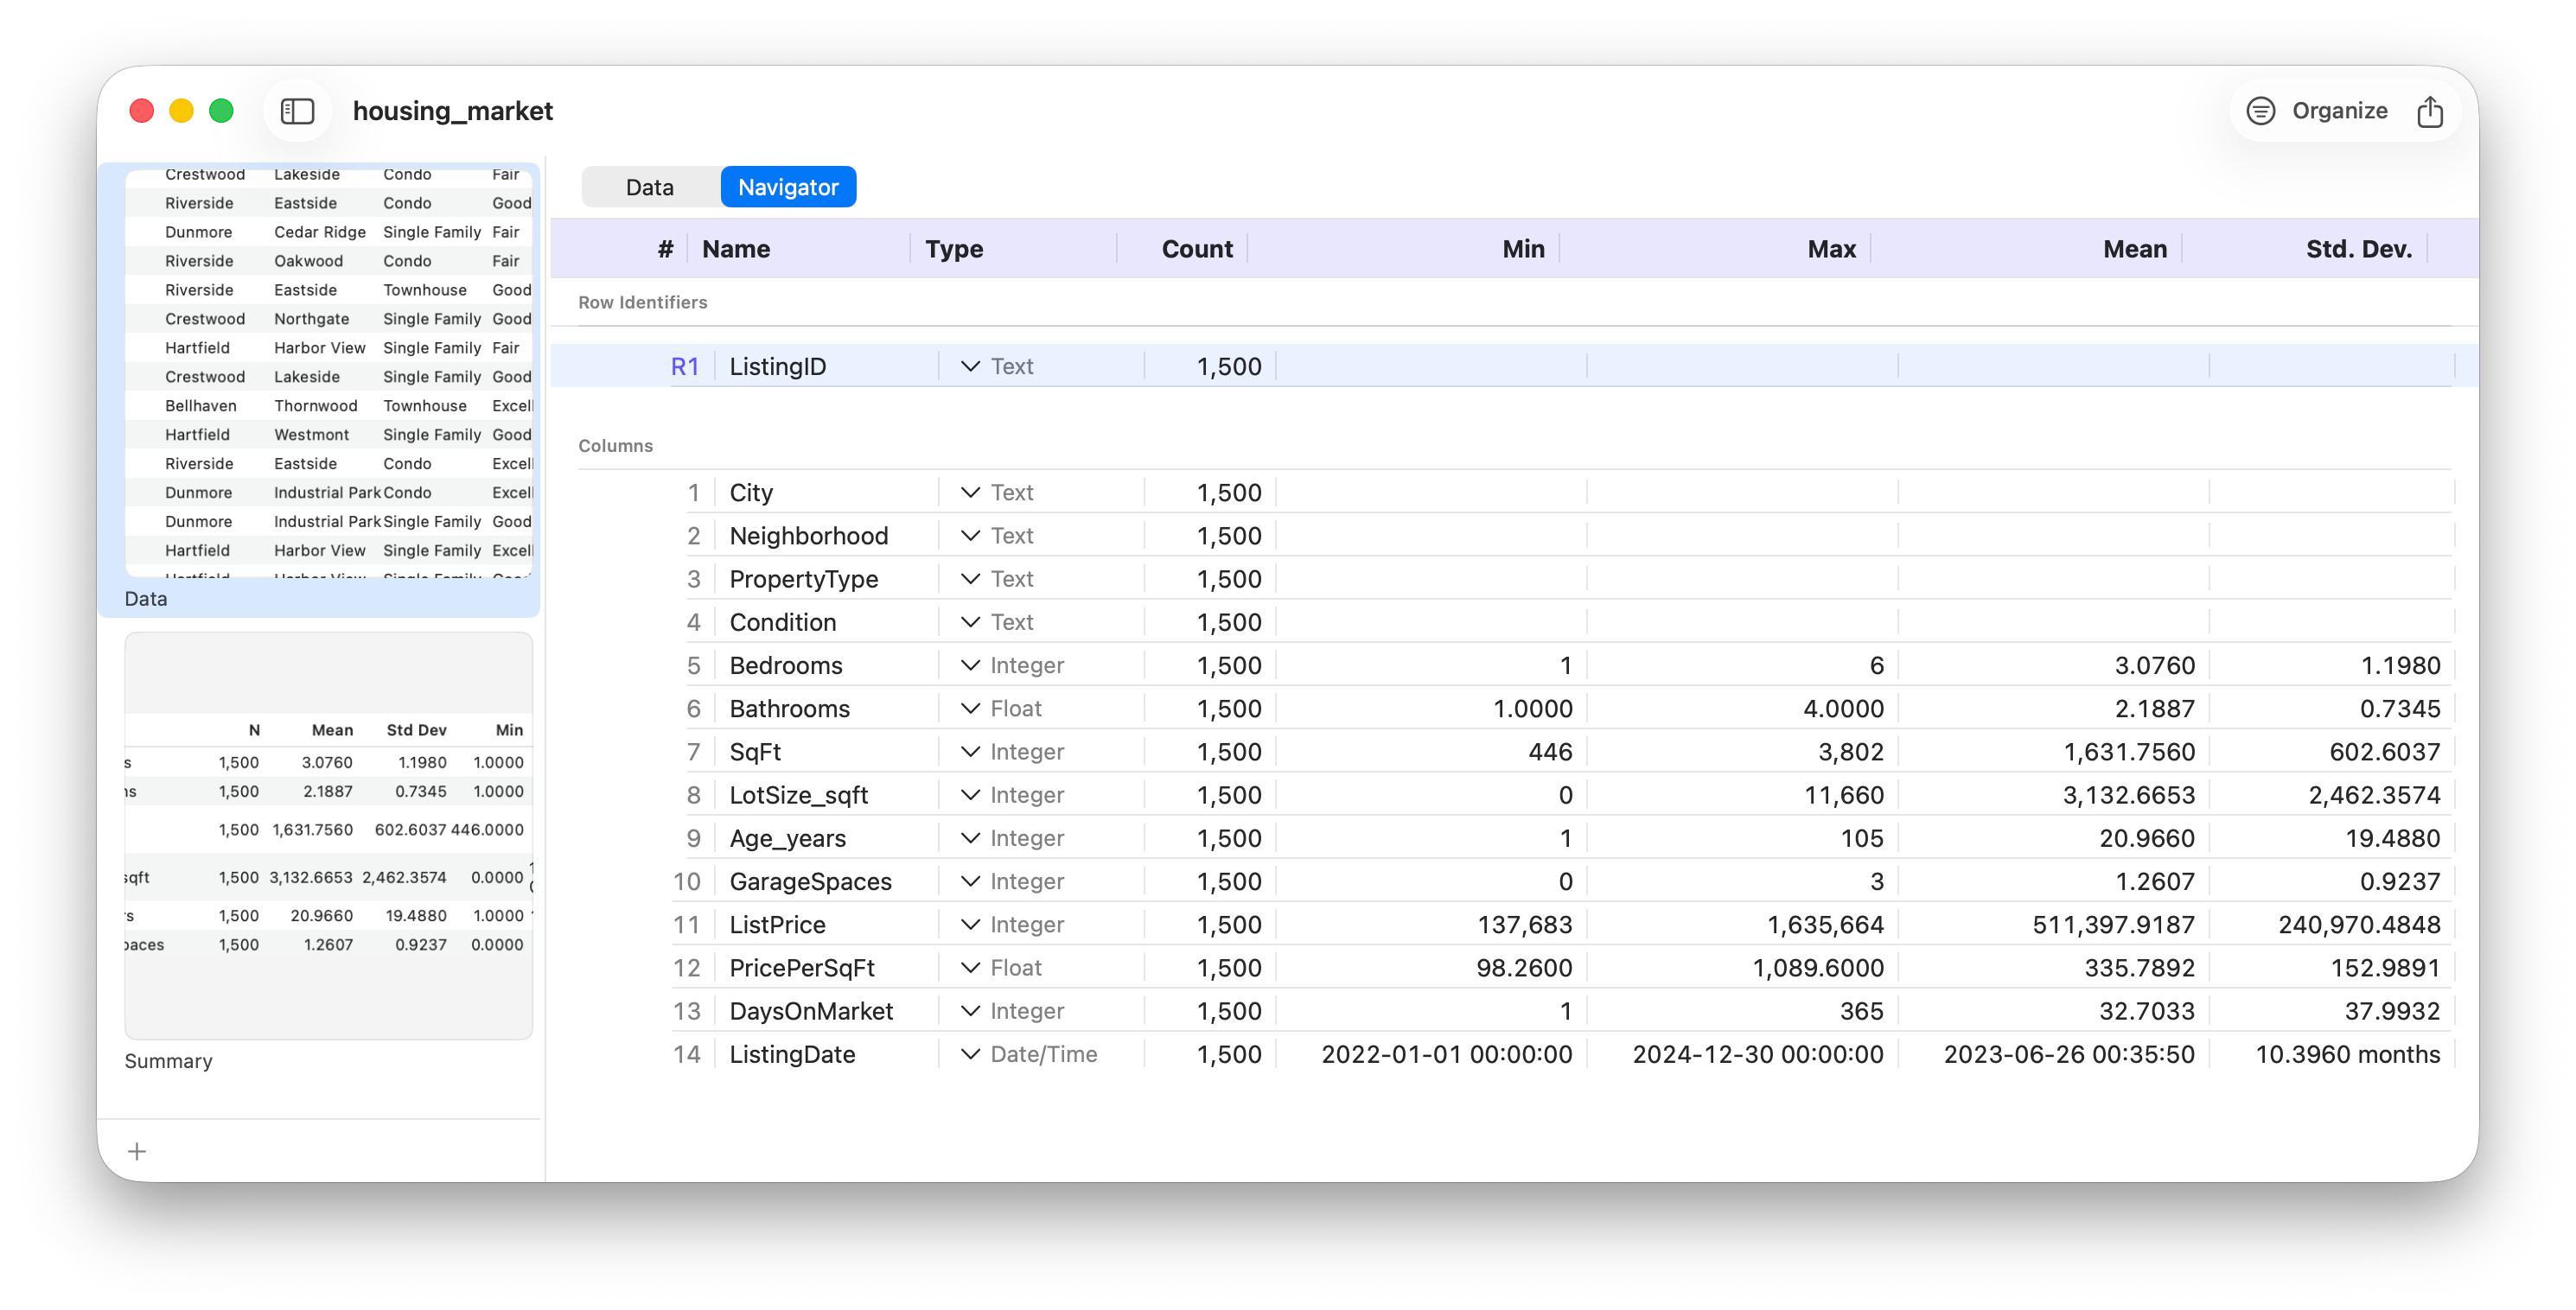
Stratum reads your columns' minds (well, their types)
The most important thing that happens at import is invisible: Stratum figures out what kind of data each column holds. This matters because statistics begins with knowing your variable types.
- Categorical variables — like
City,Neighborhood, orPropertyType— take a value from a fixed set of labels. They're summarized by counts and proportions. - Numeric variables — like
SqFt,ListPrice, orDaysOnMarket— are measured quantities, summarized by their center and spread.
Stratum's rule of thumb is simple and robust: if a column parses as a number at least ~90% of the time, it's treated as numeric; otherwise it's categorical. Dates are recognized too. You can always override a column's type, but for clean data you rarely need to.
Your first insight: the Summary report
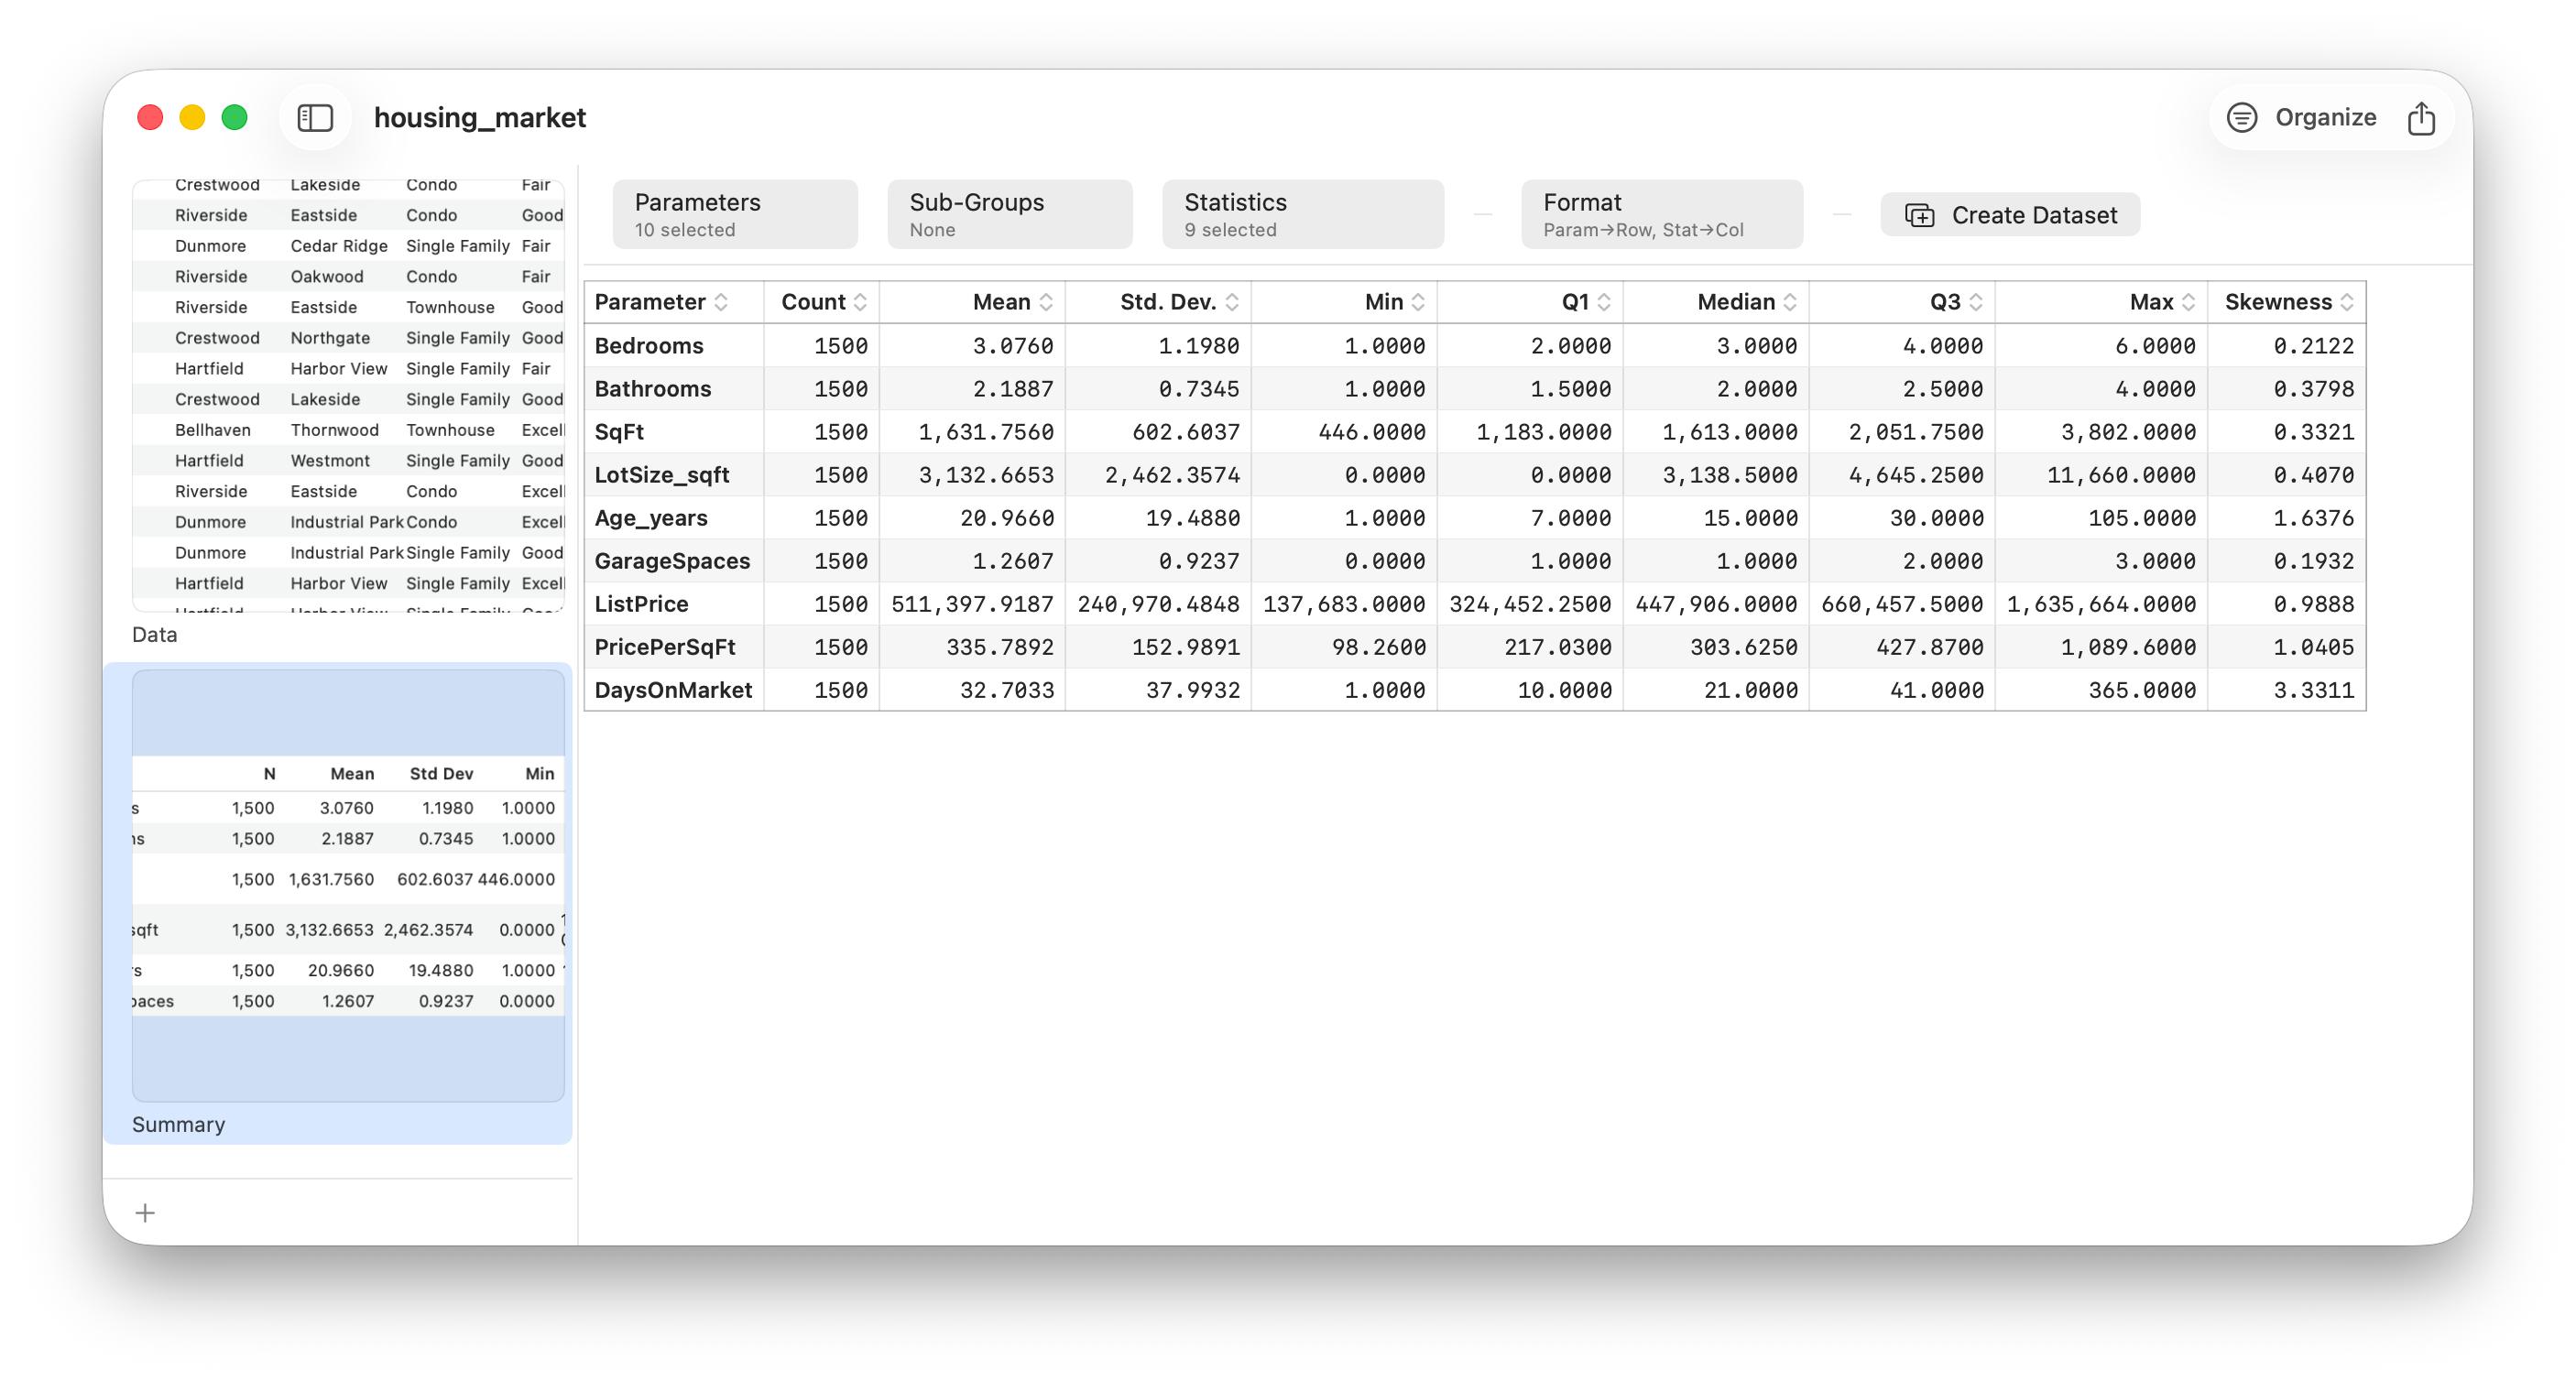
With the data loaded, choose Analyze ▸ Summary. In one click, Stratum produces a full descriptive-statistics report for every numeric column at once: count, mean, median, standard deviation, minimum and maximum, the quartiles, range, interquartile range, coefficient of variation, skewness, and kurtosis.
How to read it
A descriptive summary tells you three things about each variable:
- Center — the mean (arithmetic average) and the median (the middle value). When the mean sits noticeably above the median, the data is right-skewed.
- Spread — the standard deviation, the range, and the interquartile range (Q3 − Q1), which is more resistant to outliers.
- Shape — skewness (asymmetry) and kurtosis (how heavy the tails are).
ListPrice, you'll typically see the mean come out higher than the median, with positive skewness. That's the signature of a handful of expensive homes pulling the average upward — and it's a fact that will shape every model and test you build later. Seeing it now, on day one, is the point of a good first look.
Save it and move on
Choose File ▸ Save and store the document as Housing Market.stratum. Reopen it and your Summary report is still there. Because the native format preserves your analyses alongside the data, the work you do in Stratum compounds rather than evaporating when you close the window.
.stratum document keeps data and analyses together.Follow along
- Dataset
- housing_market.csv — 1,500 listings × 15 columns
- You'll use
- Import, the data grid, automatic type inference, and the Summary report
- Up next
- Computed Columns & the Formula Engine
That's the entire on-ramp: open a file, trust the type inference, read a summary, save. From here, every lesson in this series builds on the same dataset and the same fast loop. In the next post we'll start shaping the data — creating new variables with Stratum's formula engine.