 Stratum
One-Way & Two-Way ANOVA: Compare Many Groups
Two groups are easy. Three, four, or more is where the trouble starts — and where ANOVA earns its keep. It compares all the means at once, in a single honest test, and then tells you exactly which groups drove the difference.
Our process data was made on three recipes: Standard, Fast, and Fine. Do they produce the same film thickness on average? You might be tempted to run a t-test on every pair. Don't. With three groups that's three tests; with five it's ten. Each test carries its own chance of a false alarm, and those chances pile up. Run enough comparisons and you're almost guaranteed to find a "significant" difference that isn't real. ANOVA — Analysis of Variance — solves this by asking one question instead of many.
One-way ANOVA: one factor, many groups
Run Analyze ▸ ANOVA ▸ One-Way ANOVA, set Responses to Thickness_nm and Sub-Groups to Recipe. The output is a compact table that answers a single question: are all three recipe means equal, or is at least one different?

The clever idea behind ANOVA is to partition the variance. The total spread in thickness gets split into two parts: variation between the recipe groups (the signal) and variation within each group (the noise). The F-statistic is simply their ratio. If between-group variation dwarfs the within-group noise, F is large and its p-value is small — the recipes really do differ. If the groups overlap heavily, F is near one and you can't tell them apart.
Checking the assumption: equal variances
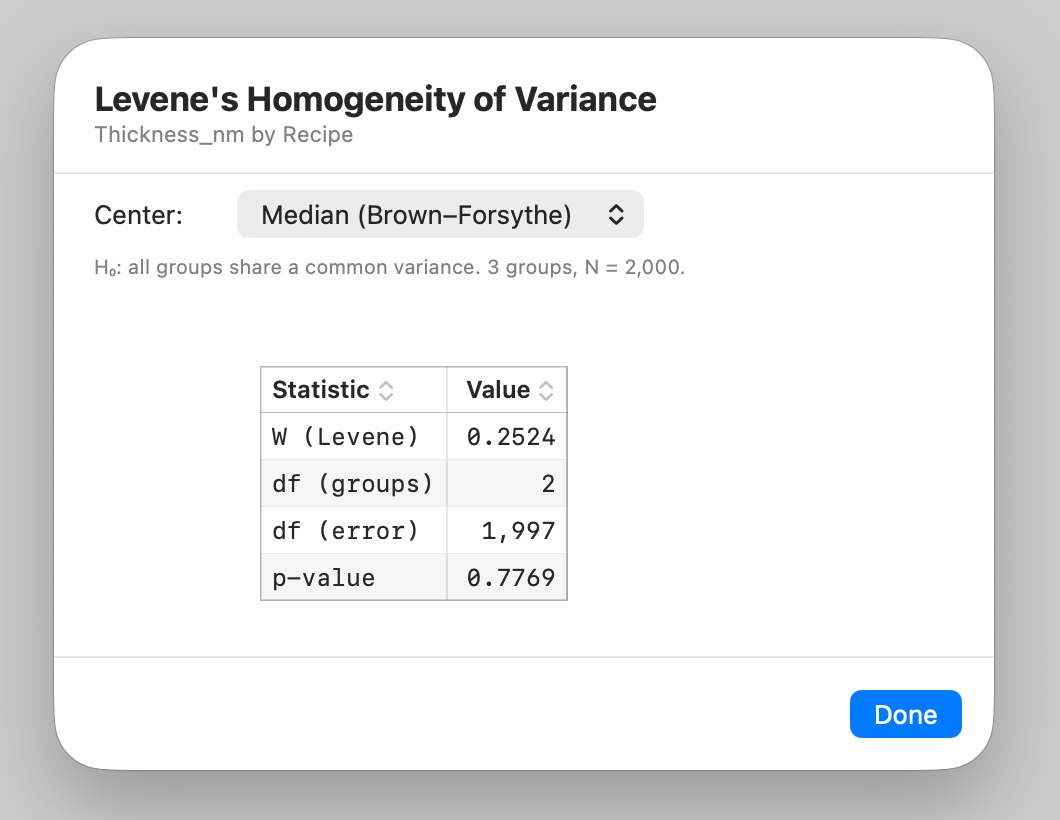
Before you lean on that F, it's worth one quick check. ANOVA assumes the groups share a similar spread — homogeneity of variance. If one recipe is wildly more variable than the others, the F-test can mislead. To test it, right-click the ANOVA row and choose Test homogeneity of variance (Levene's)…. Levene's test asks the same between-versus-within question, but about the spread rather than the means; Stratum uses the robust median-centered (Brown–Forsythe) form. A comfortable p-value — above the usual 0.05 — says the assumption holds and your F-test stands; a tiny one warns the groups vary too differently to take the F at face value.
Post-hoc tests: which groups actually differ?
A significant ANOVA tells you something differs, but not what. For that you need a post-hoc test that compares each pair while keeping the inflated-error problem in check. Right-click the ANOVA row and choose Post-hoc (Tukey HSD)… — the standard choice for all pairwise comparisons after a one-way ANOVA. Stratum opens a sheet listing every pair's mean difference, q statistic, adjusted p-value, and 95% interval.
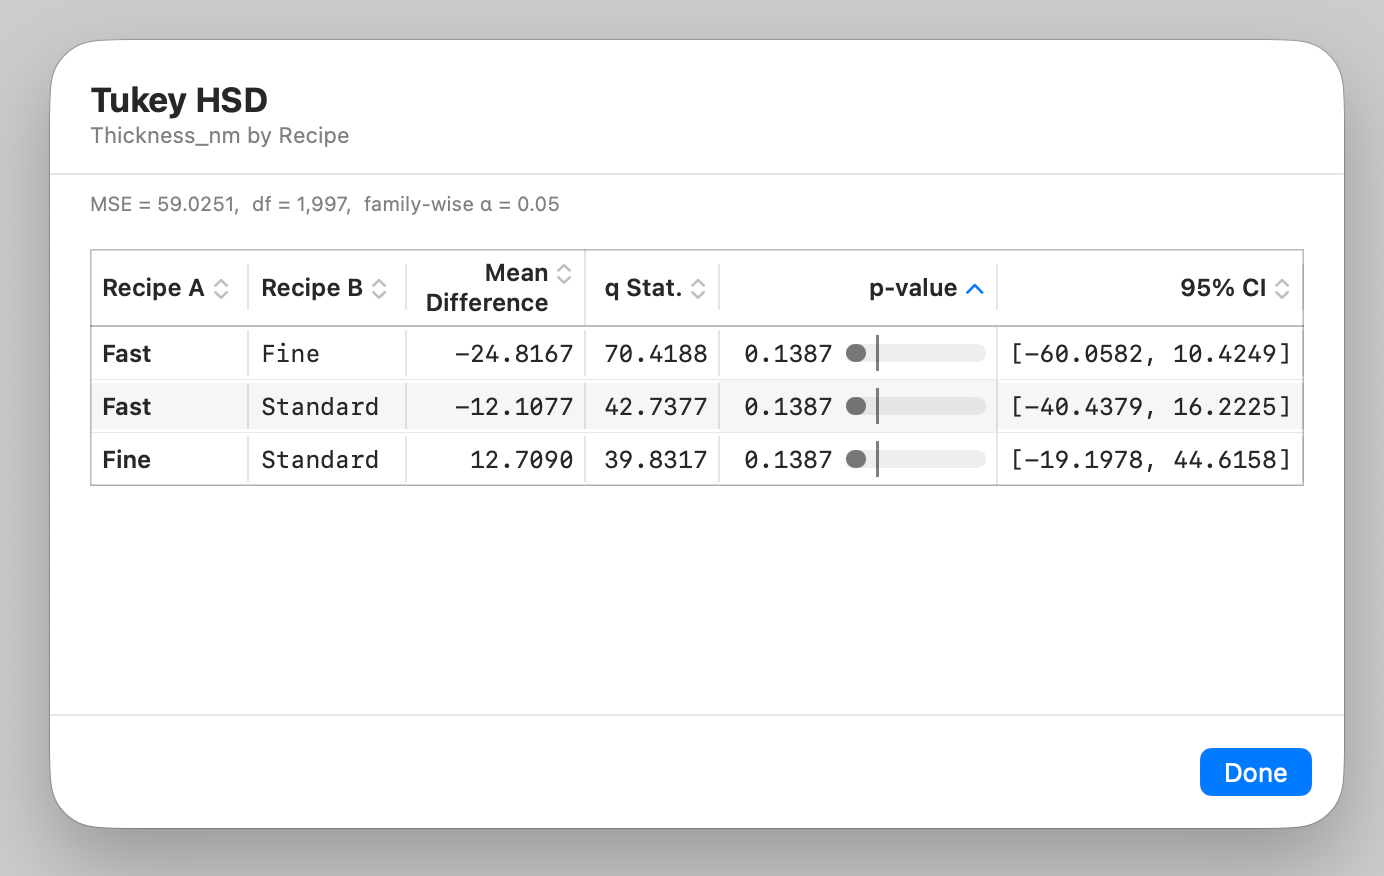
Now you can say something concrete: perhaps Fine differs from both Standard and Fast, while Standard and Fast are statistically indistinguishable. That's the level of detail ANOVA plus post-hoc gives you.
Two-way ANOVA: two factors at once
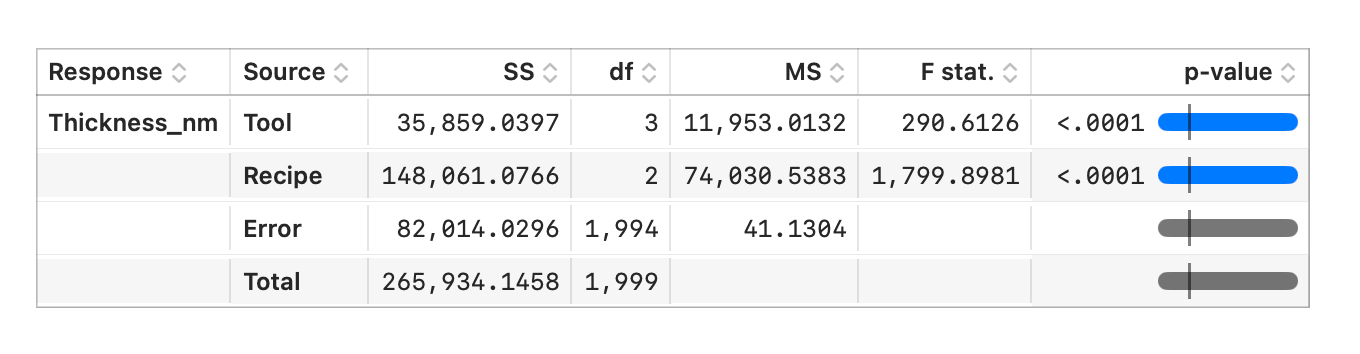
Thickness might depend on more than the recipe. The Tool that ran the lot could matter too. Analyze ▸ ANOVA ▸ Two-Way ANOVA lets you test both factors in one model: set Responses to Thickness_nm, add Tool and Recipe in the Factors picker, and turn on the Interaction toggle. It separates each factor's own main effect from the way they combine.
The interaction effect
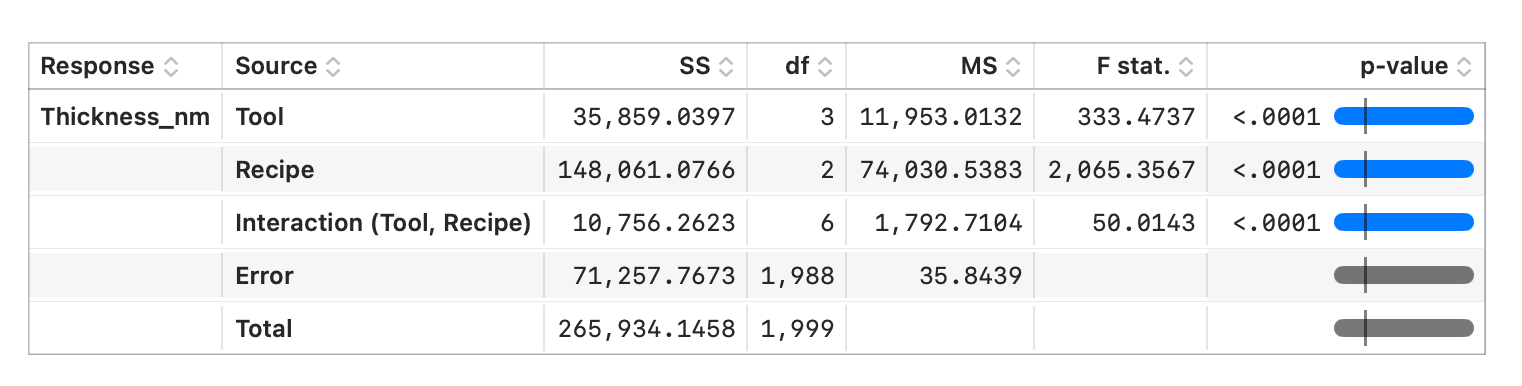
The most interesting row in a two-way table is often the interaction. A main effect says "recipe matters, on average." An interaction says something subtler: the effect of one factor depends on the other — maybe the Fine recipe is best on Tool-A but worst on Tool-D. When the interaction is significant, you can't talk about either factor in isolation; they only make sense together.
Follow along
- Dataset
- process_measurements.csv
- You'll use
- One-way ANOVA (thickness by recipe), Levene's homogeneity-of-variance check, Tukey HSD post-hoc comparisons, two-way ANOVA (tool and recipe), and the interaction term
- Up next
- Lesson 16 — MANOVA, Contingency & Differences
ANOVA compares many groups on a single response. But what if you measure several responses at once — thickness, conductivity, resistivity — and want to test them together? And what about variables that are categories rather than numbers? Those are the questions for the next lesson.