 Stratum
Computed Columns & the Formula Engine
Raw data rarely arrives in the shape your analysis needs. Stratum lets you build new variables the way a spreadsheet wishes it could — with 100+ functions, live recompute, and formulas you can come back and edit at any time.
You have list prices and square footage, but what you really want is price per square foot. You have a home's age in years, but your analysis calls for age bands. You have a condition label — "Poor," "Fair," "Good," "Excellent" — but a model needs a number. These are the everyday transformations that stand between raw data and real analysis, and in Stratum they're all the same thing: a formula column.
Your first computed column
Add a column, choose Formula, and type an expression. To get price per square foot, that's simply ListPrice / SqFt. The moment you apply it, the column fills in for all 1,500 rows.
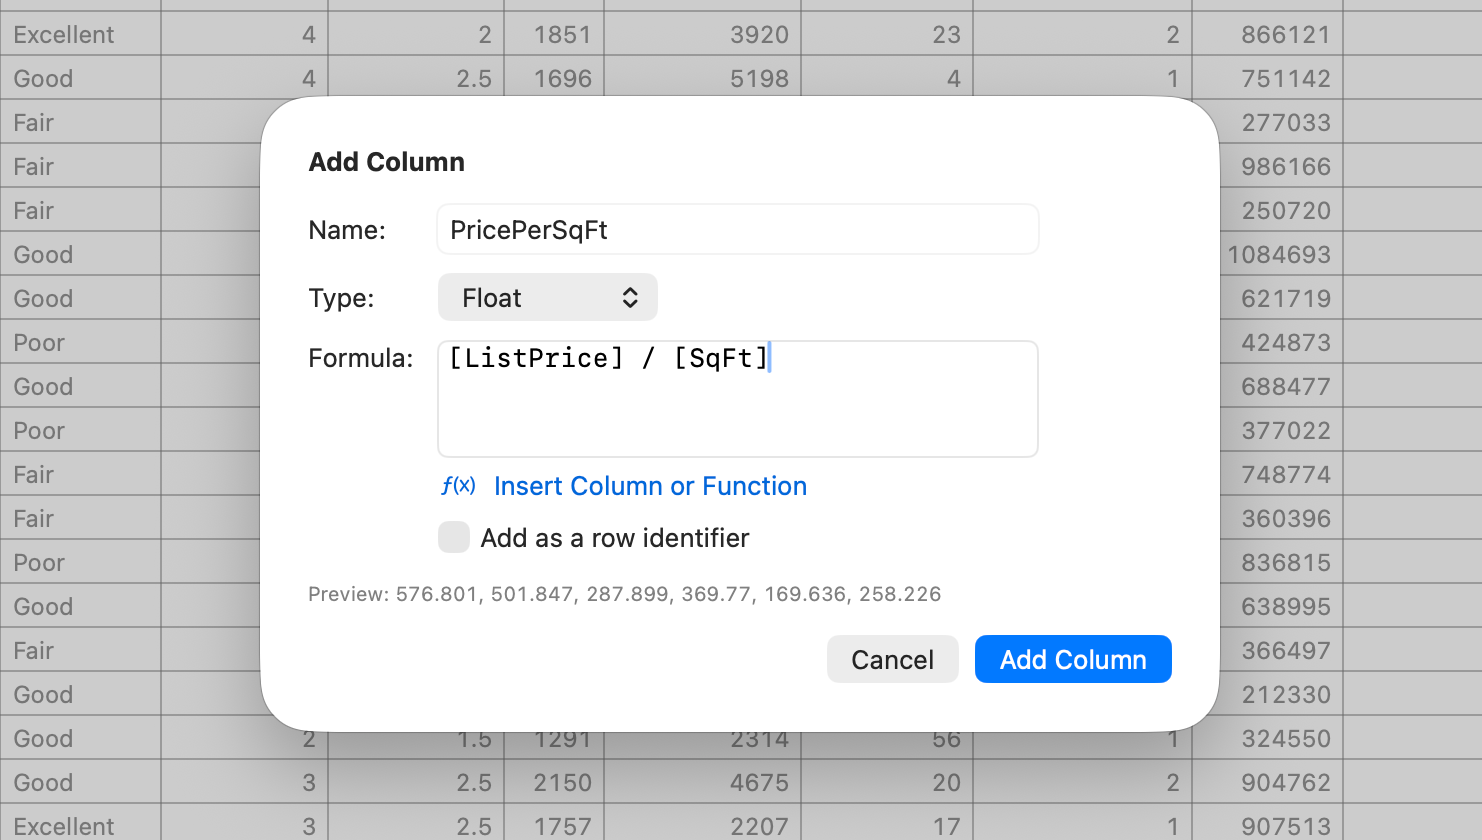
PricePerSqFt = ListPrice / SqFt — it populates instantly.That ratio is more than convenience. Dividing price by size removes the size effect, making a compact condo and a sprawling house comparable on a level field. This is the simplest form of normalization, an idea we'll lean on repeatedly in later lessons.
One hundred functions, one popover away
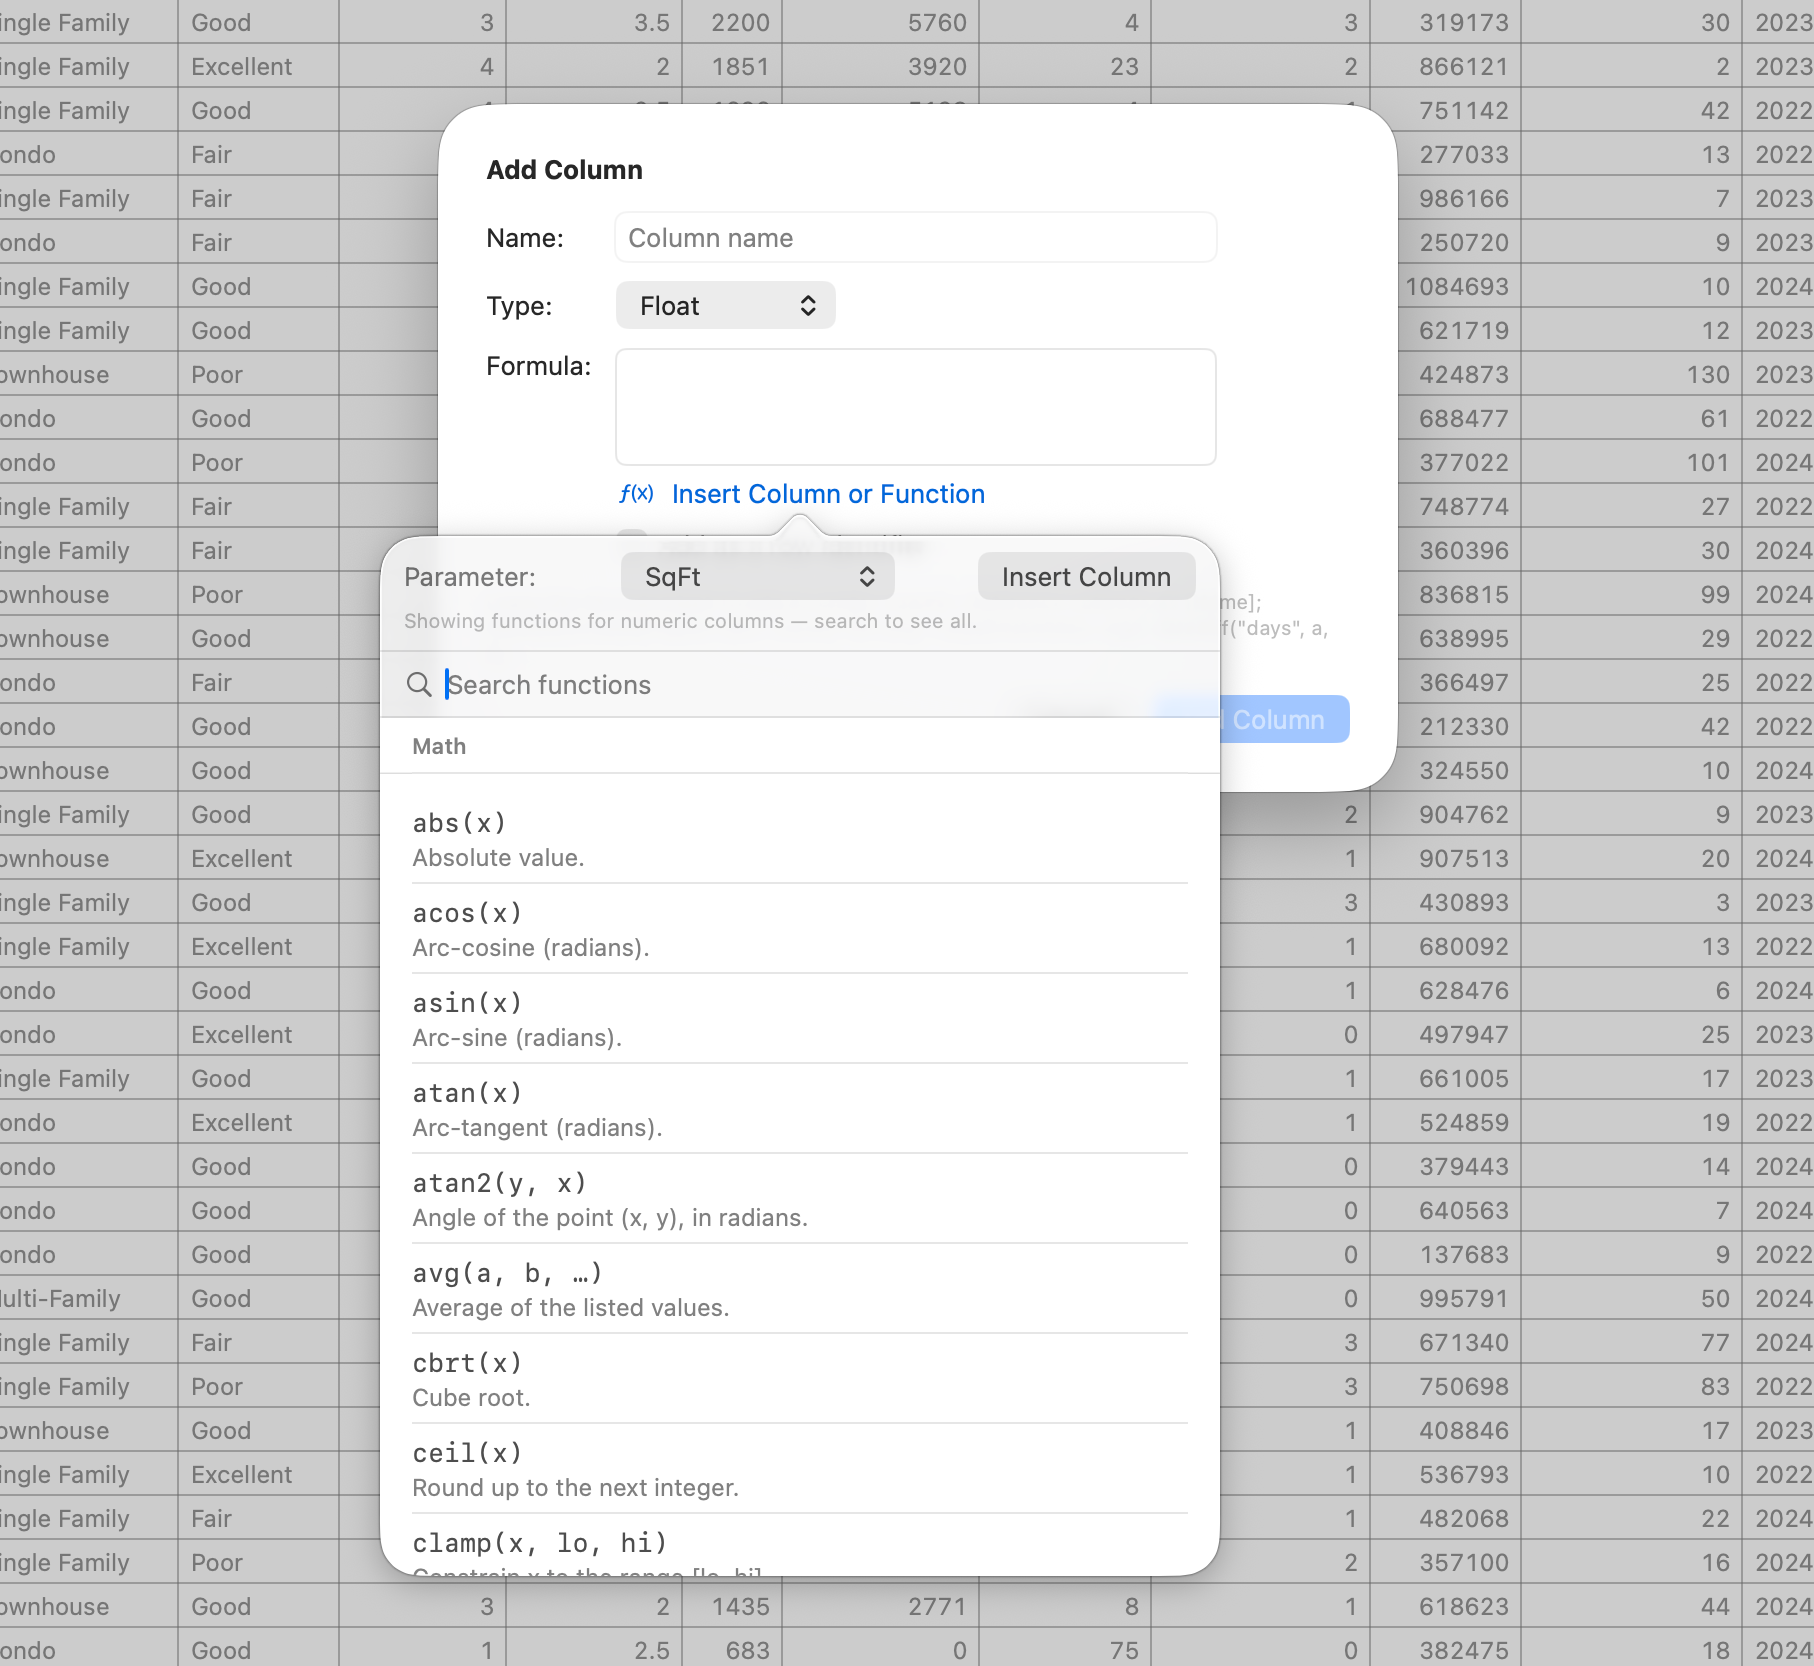
Expressions can do far more than arithmetic. Stratum's formula engine ships with over a hundred functions — mathematical, statistical, string, date, and logical — and they're all browsable from the built-in Functions reference. No need to memorize syntax; open the popover and scroll.
Binning: turning a number into categories
Binning converts a continuous variable into ordered groups — useful for charts, cross-tabs, and simple segmentation. To split home age into four bands, use ewbin(Age_years, 4):
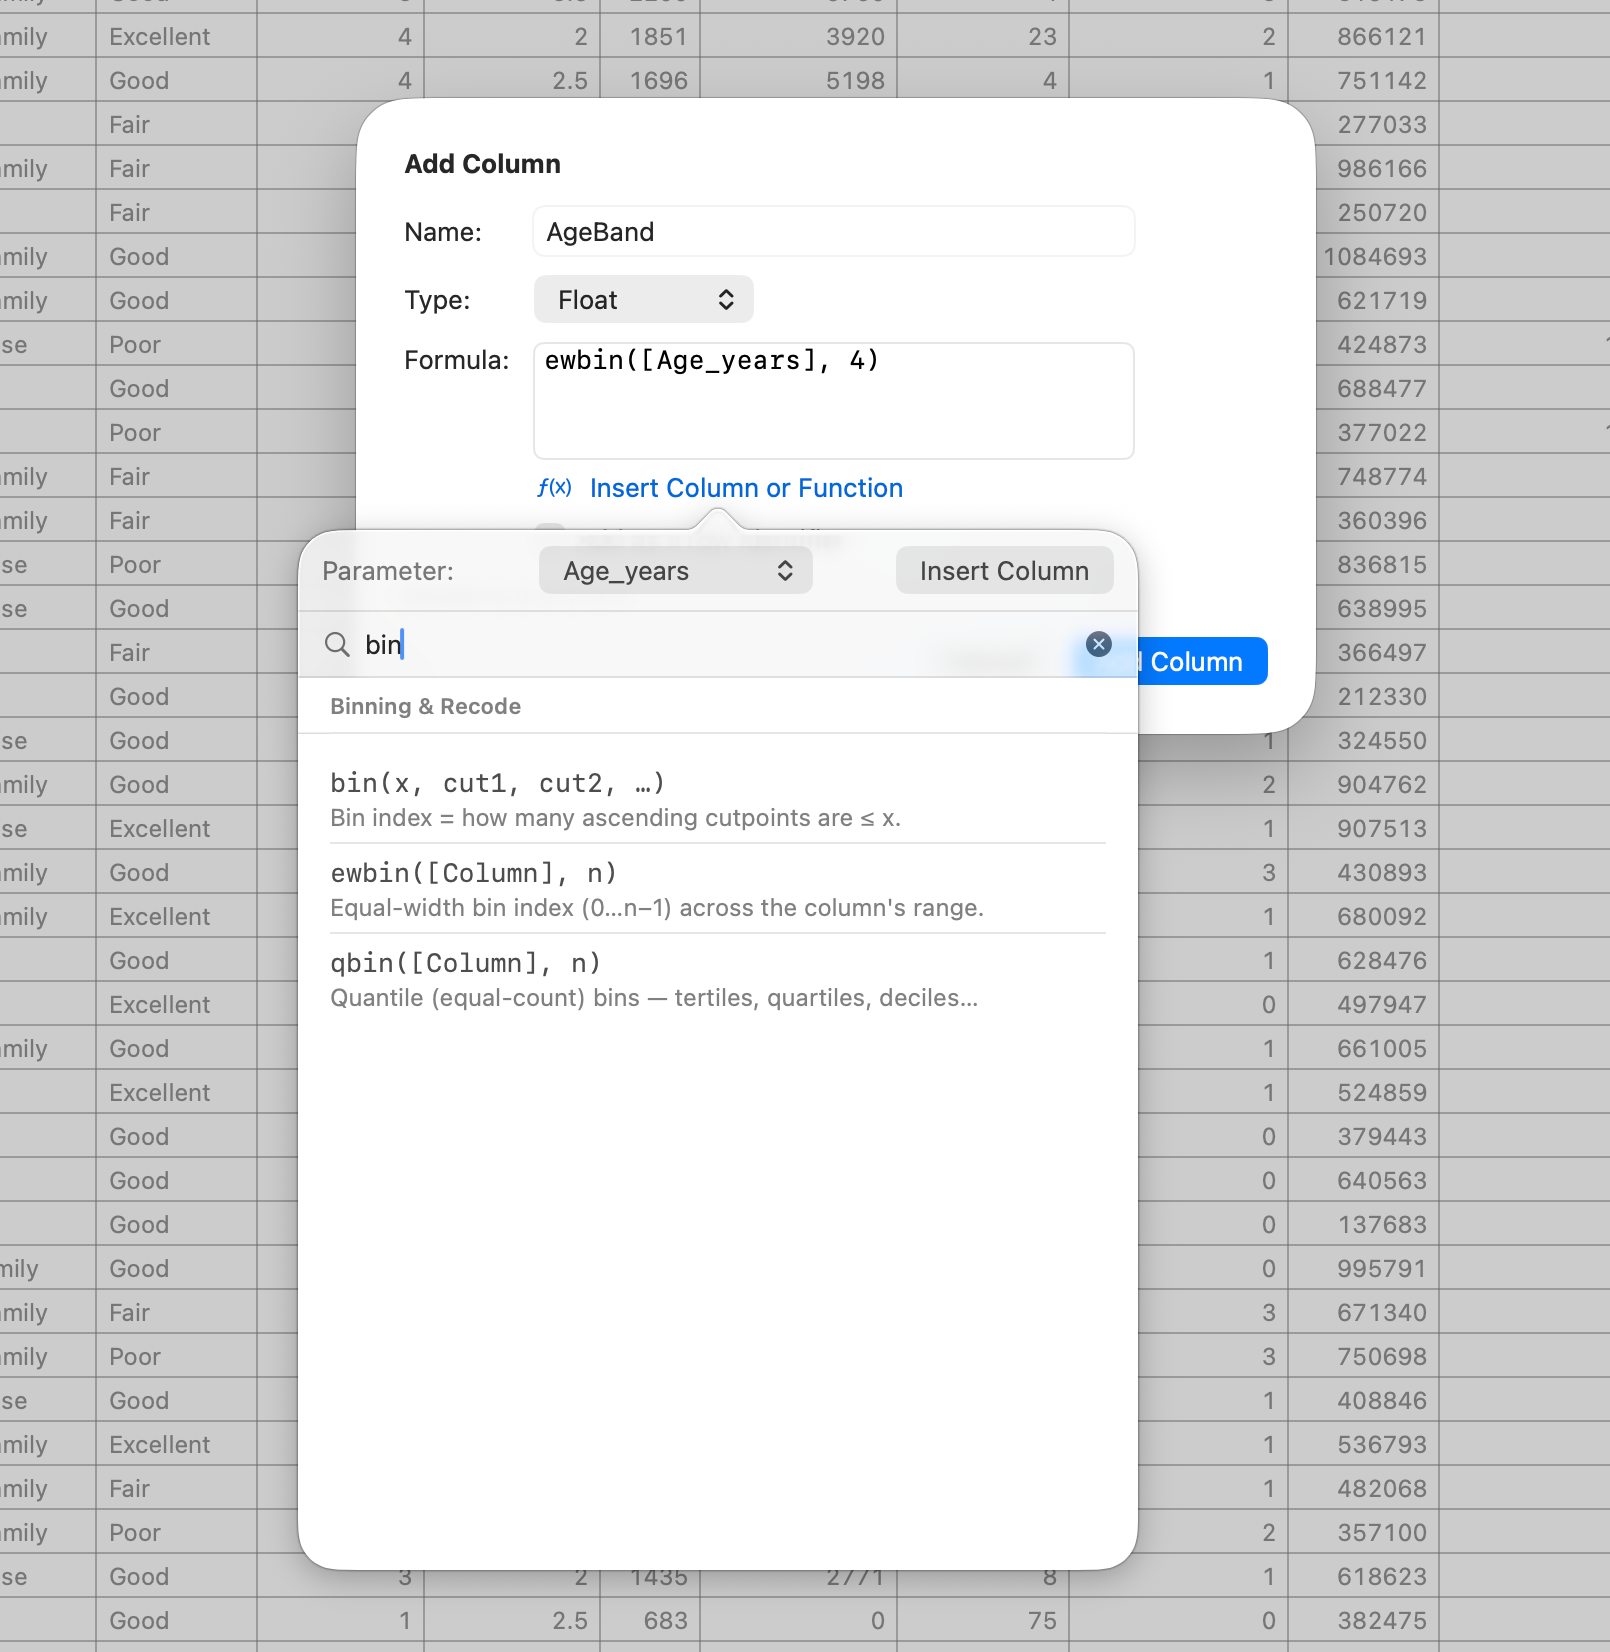
ewbin().Stratum offers two binning styles, and the difference matters:
ewbin()makes equal-width bins — intuitive, but lopsided when data is skewed.qbin()makes equal-frequency (quantile) bins — roughly the same count in each bucket.
ewbin(ListPrice, 4) dumps most homes into the cheapest bin. Switch to qbin(ListPrice, 4) and you get four balanced price tiers instead. Same goal, very different result — and a good reminder to look at your distribution before you bucket it.
Recoding labels into numbers
An ordinal label like Condition carries an order — Poor < Fair < Good < Excellent — but a model can't use the words. The map() function recodes them:
map(Condition, "Poor",1, "Fair",2, "Good",3, "Excellent",4)Now you have a ConditionScore you can correlate, plot, or feed into a regression.
The payoff: formulas stay editable
Here's where Stratum departs from a spreadsheet. In most tools, a transformation is a destructive paste — to change it, you redo the work. In Stratum, the column remembers its formula. Reopen the age-band column, change the bin count from 4 to 5, and every row recomputes instantly.
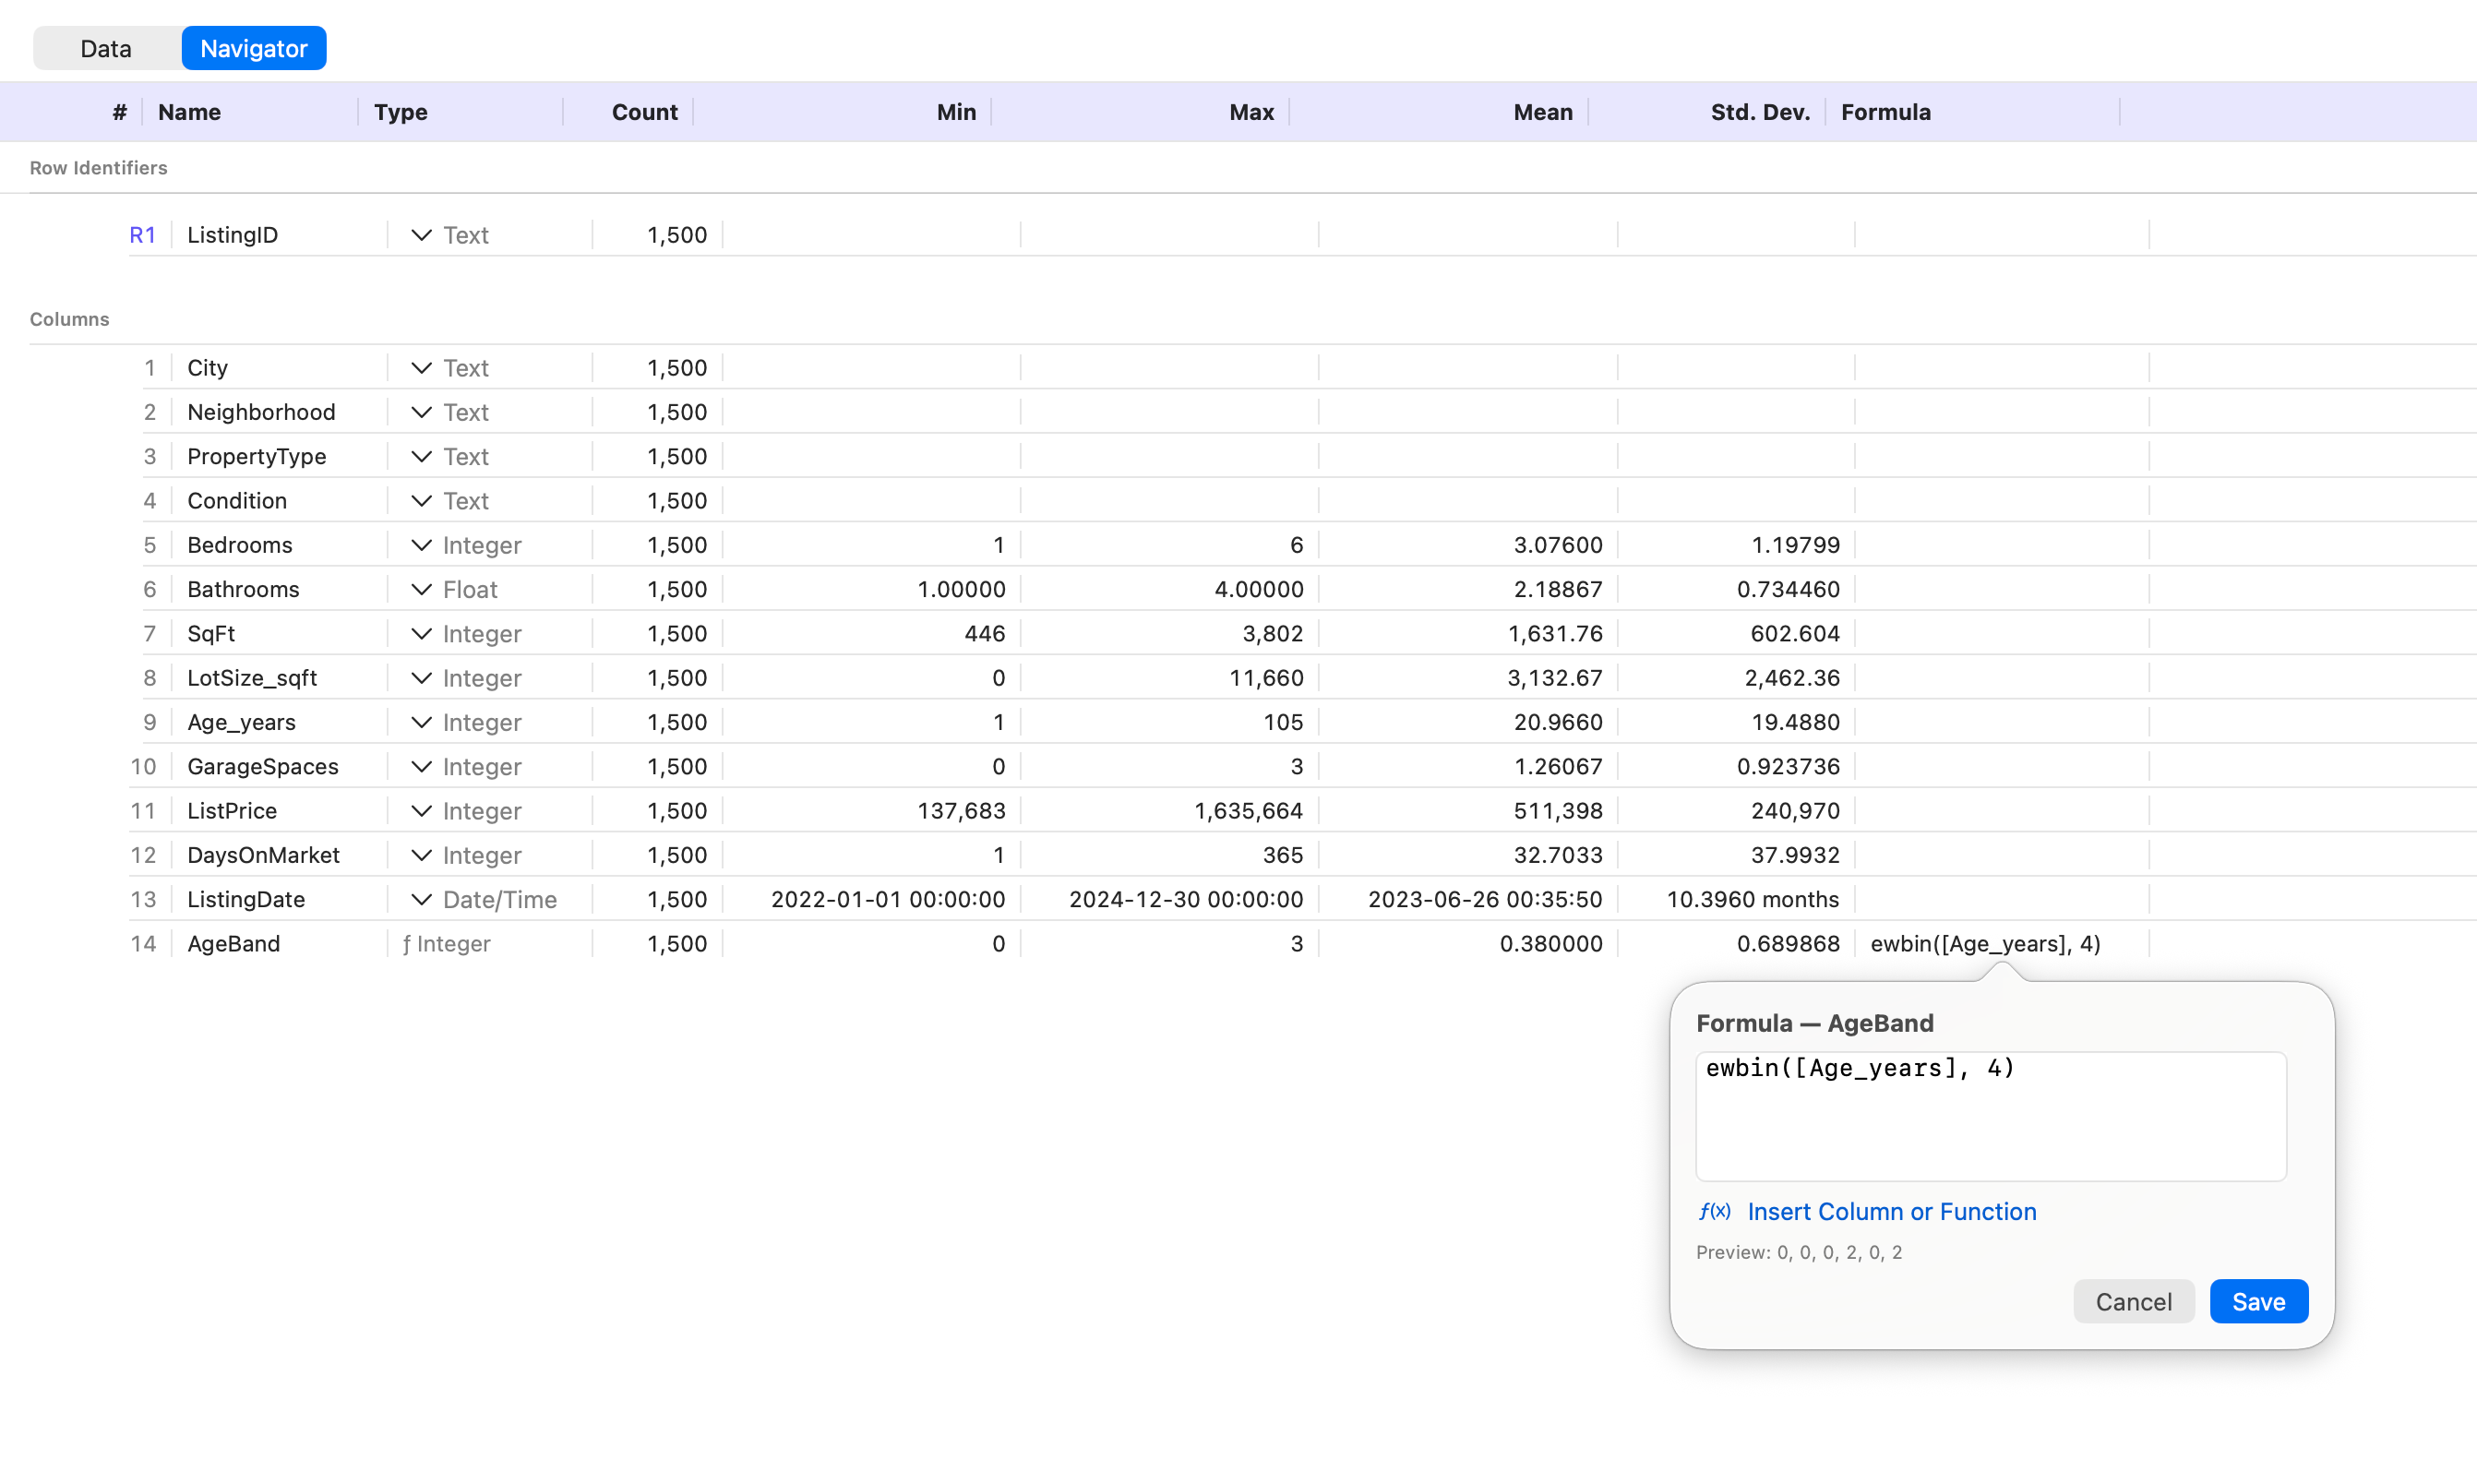
That re-editability is what keeps an analysis auditable. Anyone who opens your document can see exactly how every derived variable was computed — no mystery columns, no lost steps.
Standardizing in a single expression
Finally, a taste of the per-column aggregates. To put a variable on a common scale, wrap it in zscore(): zscore(ListPrice) rescales price to a mean of 0 and a standard deviation of 1. Standardized variables are essential when you combine measurements on different scales — exactly what distance-based methods like clustering and PCA require, later in this series.
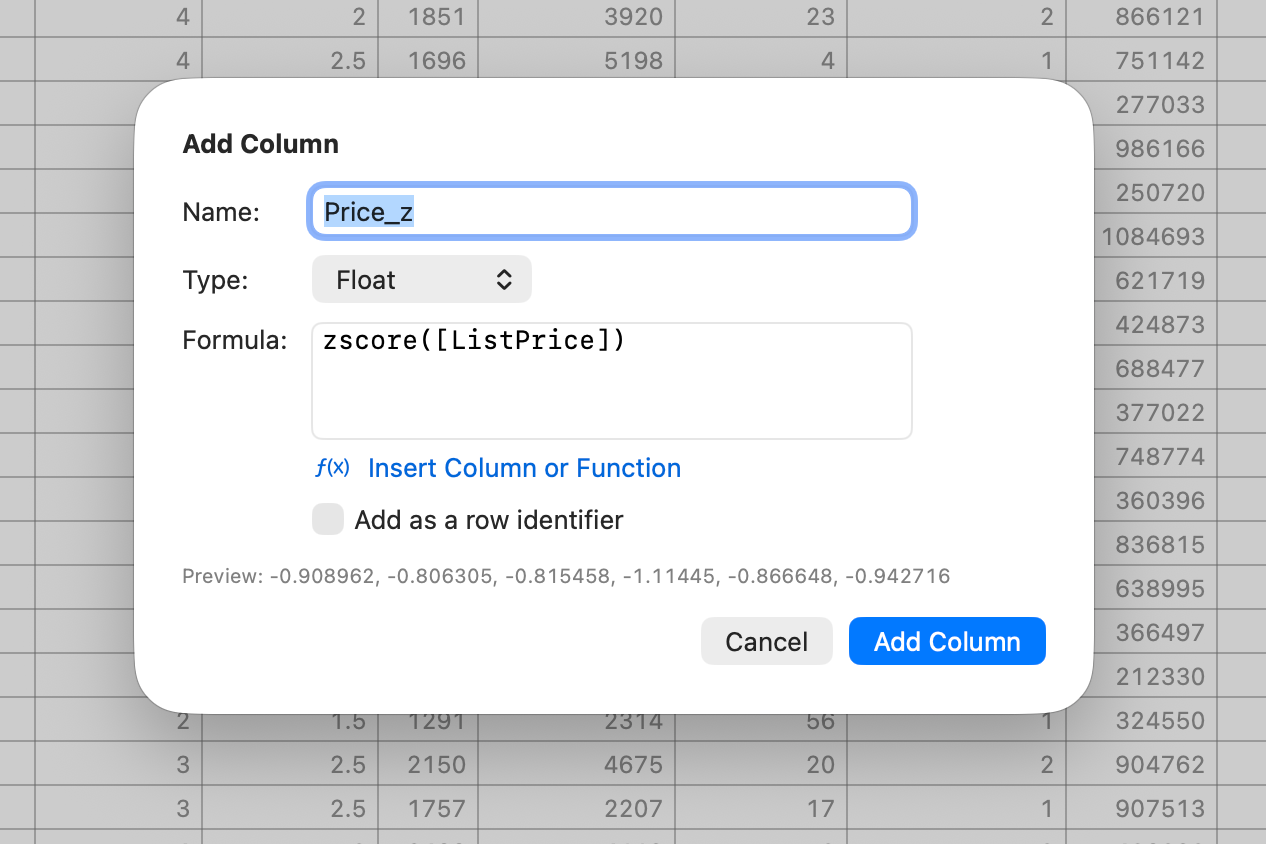
zscore().Follow along
- Dataset
- housing_market.csv
- You'll use
- Formula columns, the Functions reference,
ewbin/qbin,map, andzscore - Up next
- Filtering & Sorting
With derived variables in hand, the next question is how to focus on just the rows that matter. That's filtering — and it's the subject of the next lesson.