 Stratum
Filtering & Sorting
Analysis is a conversation with your data: "show me only the condos," "now only the recent ones under $400k," "sort those by days on market." Stratum makes that conversation fluid with a filter panel that's always there — and a filter that every chart and report respects.
Most apps treat filtering as a chore you do in a modal dialog: open it, set a rule, click apply, and it disappears. Stratum treats it as a persistent lens. The Filter Inspector docks alongside your data and stays open while you work, and whatever slice it defines applies everywhere at once — the grid, every chart, every report. You think in subsets, and the whole app follows along.
One condition at a time
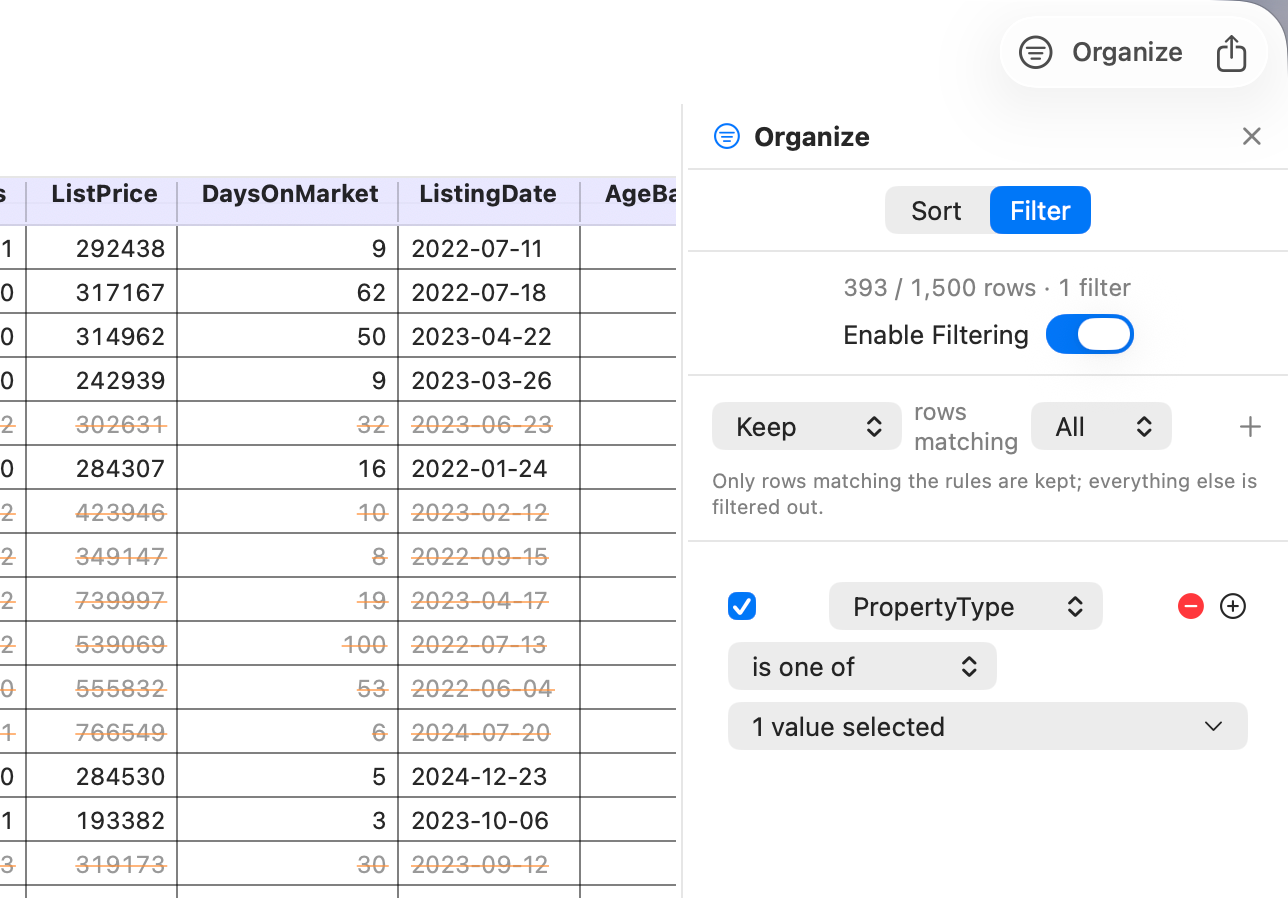
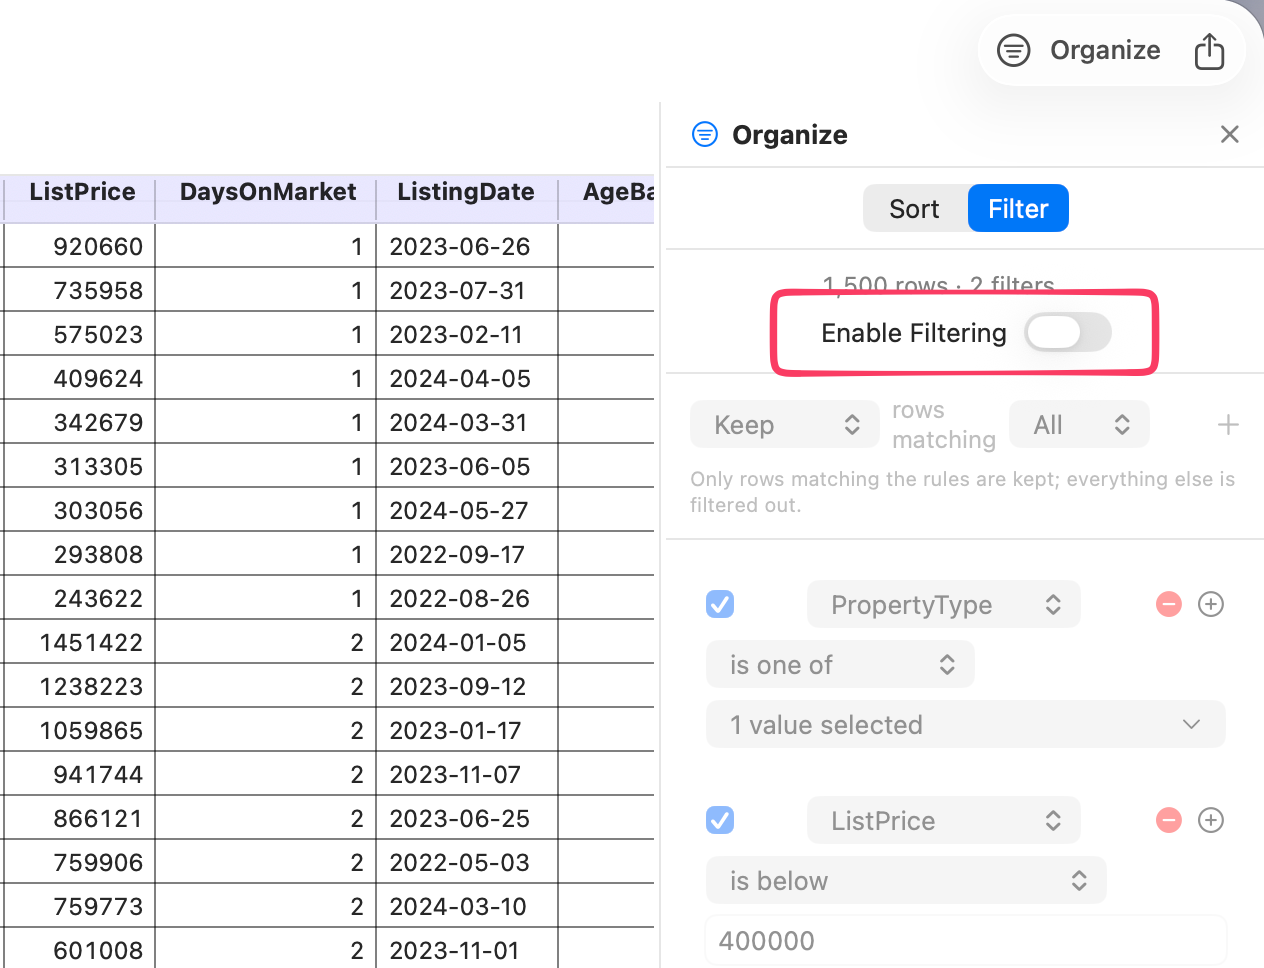
Start simple. Add a categorical condition — PropertyType is Condo — and watch the row count update live as the grid narrows to just condos. Filters can target any column: pick from a list for categorical fields, set thresholds for numbers, choose ranges for dates.
Combining conditions with logic
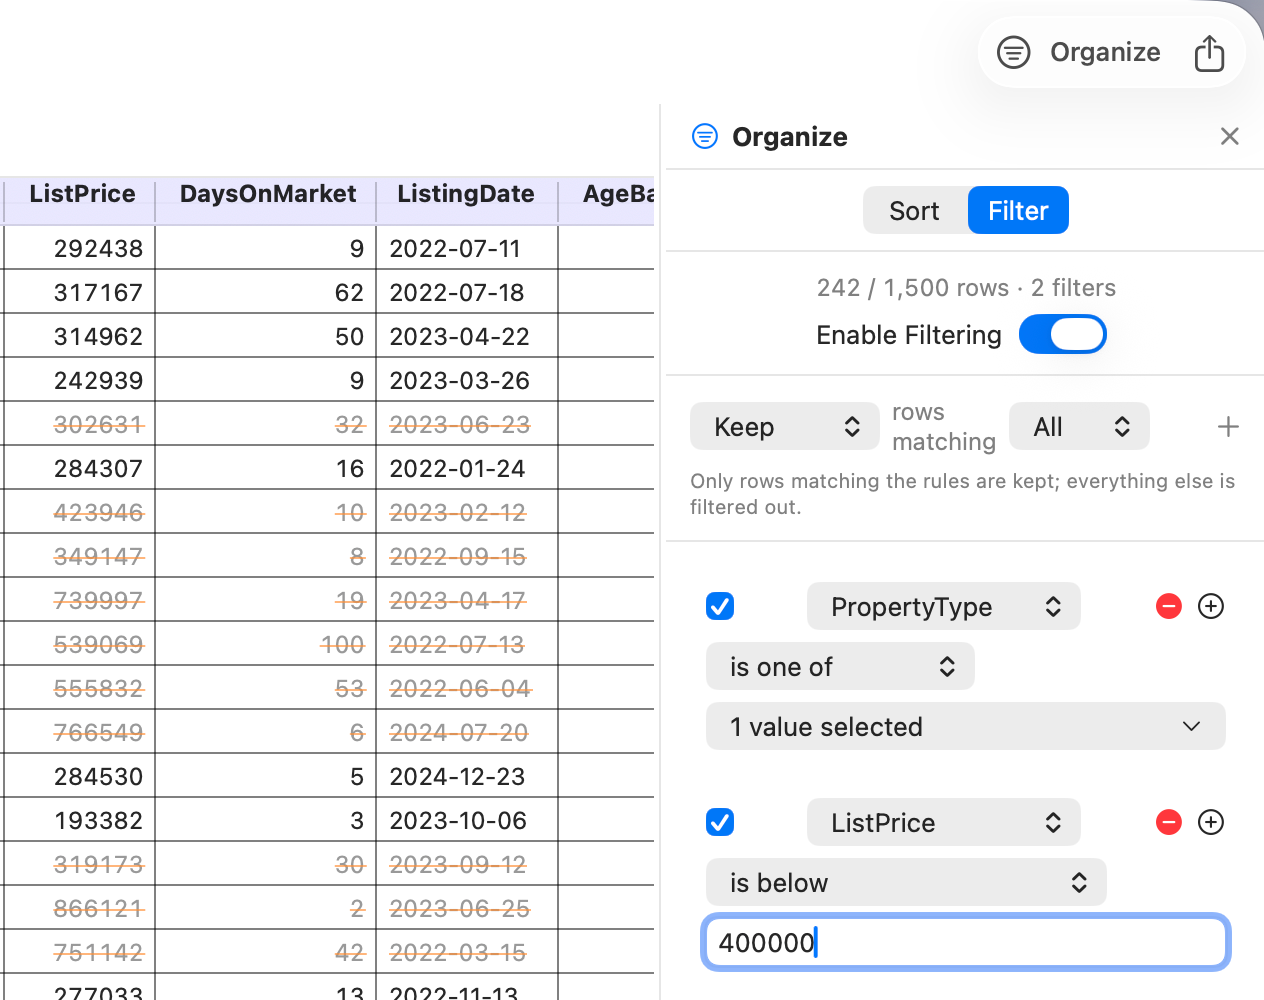
The real power comes when you stack conditions. Add a numeric rule — ListPrice < 400000 — and tell Stratum how to combine it with the first. This is where a little Boolean literacy pays off:
- All = logical AND — every condition must hold. "Condos and under $400k" — a narrow slice.
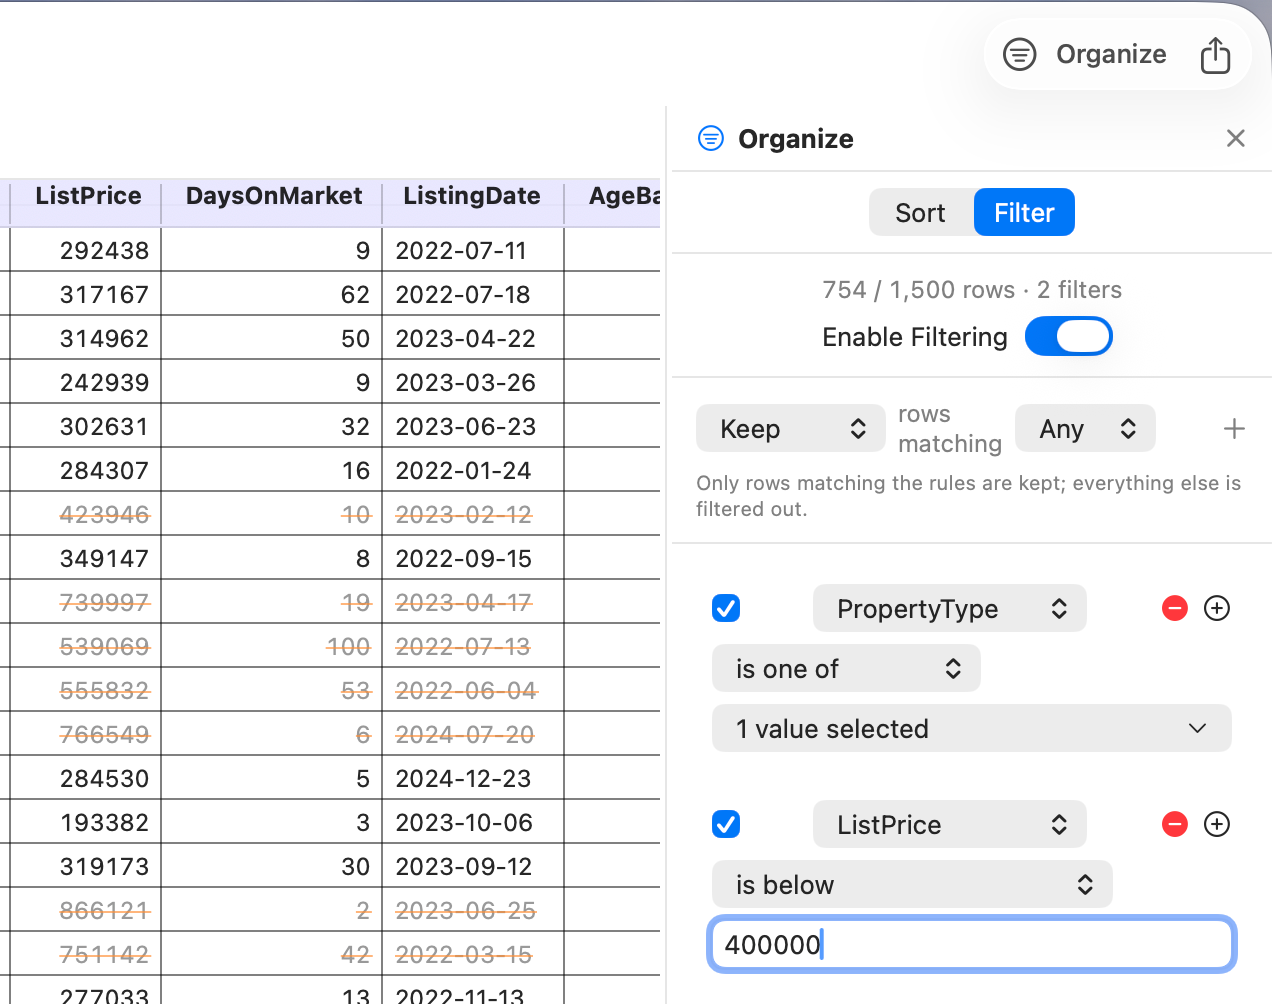
- Any = logical OR — at least one condition holds. "Condos or under $400k" — a much wider one.
- None = exclude rows matching any condition.
Flip the combiner from All to Any and the same two conditions produce a completely different dataset. Being able to toggle between them — and see the row count jump — makes the logic tangible in a way a textbook never can.
Sorting, with tiebreakers
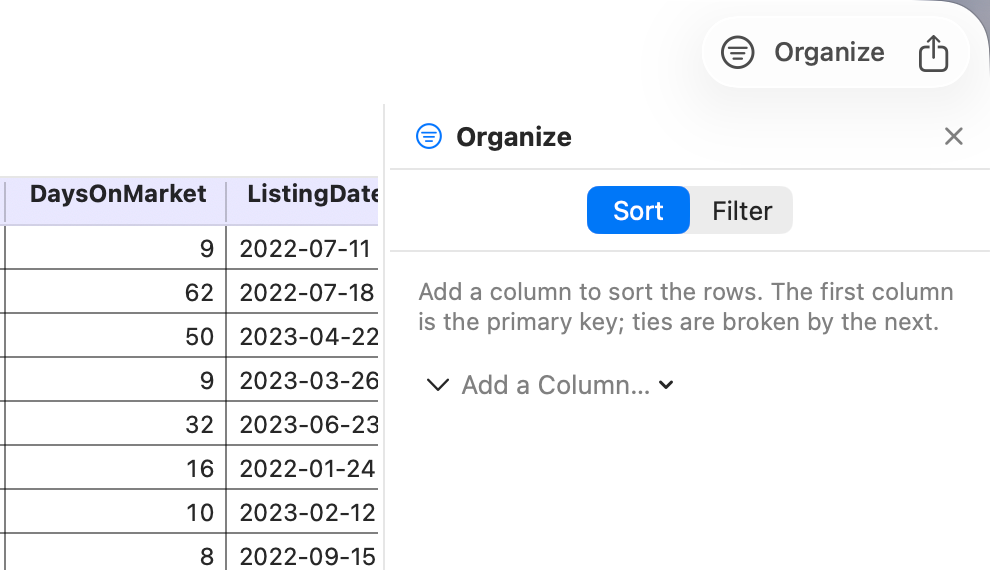
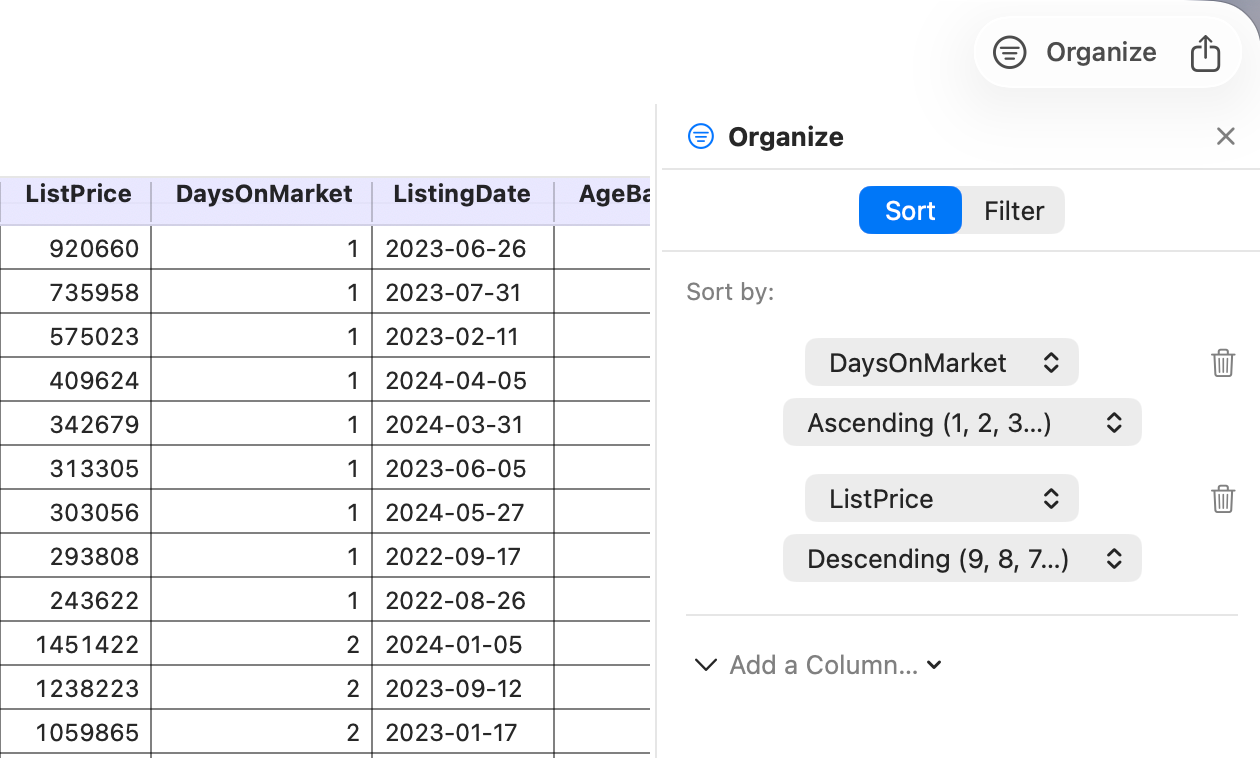
Filtering decides which rows; sorting decides their order. Stratum supports multi-key sorts: order by a primary column, then break ties with a second. To rank the fastest-selling homes and, among equally fast sellers, list the cheapest first, sort by DaysOnMarket ascending and add ListPrice descending as a tiebreaker.
The master switch
Above all your conditions sits a single toggle that enables or disables the entire filter. It's deceptively important: with one click you can compare your carefully-defined slice against the full dataset, then switch back — no need to dismantle and rebuild your conditions. And because the filter is part of your document, it's saved in the .stratum file and restored when you reopen it.
Because the filter is global, anything you do next inherits it. Run a Summary while the condo filter is active and the statistics describe condos only. That consistency — one lens, applied everywhere — is the whole point.
Follow along
- Dataset
- housing_market.csv
- You'll use
- The Filter Inspector, All/Any/None logic, multi-key sort, the master toggle
- Up next
- Reshaping Data
So far we've worked within a single table. But real data usually lives in several — and rarely in the right shape. Next we'll combine and reshape tables without ever leaving Stratum.