 Stratum
Linear Regression with Full Diagnostics in Stratum
Comparison tests ask whether groups differ. Regression asks something richer: how does one thing predict another? It's the workhorse of applied statistics — and Stratum builds the model graphically, then hands you every diagnostic you need to trust it.
What drives a home's list price? Square footage, surely — but also bedrooms, bathrooms, age, garage spaces, and more, all at once. Linear regression fits an equation that predicts the response (here ListPrice) from a weighted combination of predictors. With one predictor it's a line; with several it's a plane in higher dimensions. Either way, the method finds the coefficients that make the predictions miss the actual prices by as little as possible.
Build the model graphically
You don't write a formula by hand. Stratum's model builder gives you four slots: a Response (Y), a Numeric Predictors picker for raw numeric columns like SqFt and Age_years, a Categorical Predictors picker that turns category columns into dummy variables automatically, and Add Formula… for richer derived terms. Choose the response, add the predictors that should explain it, and the model fits live.
Reading the coefficients
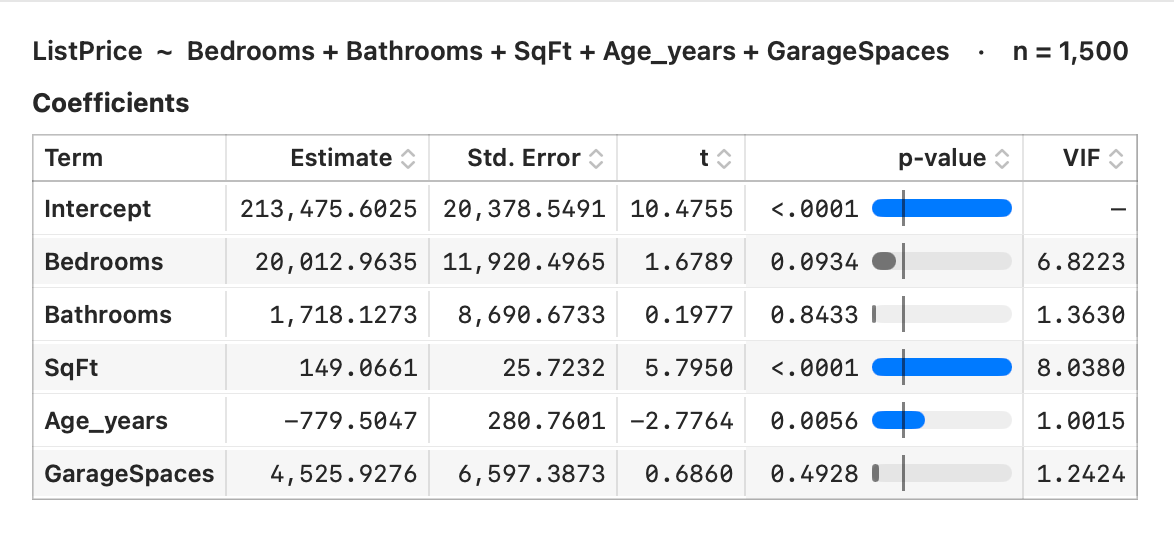
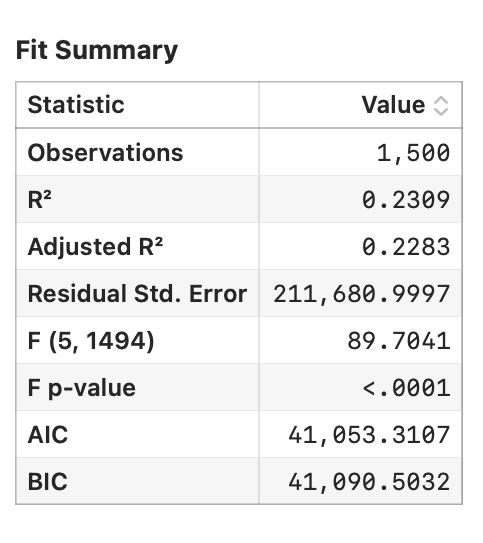
The heart of the output is the coefficients table. Each predictor gets a coefficient — its estimated effect on price, holding the others fixed — along with a standard error, a t-statistic, and a p-value telling you whether that effect is distinguishable from zero. A positive coefficient on SqFt means bigger homes list higher; its p-value tells you how confident you can be that the relationship is real. In this five-predictor fit only SqFt and Age_years come out significant, and the model explains a modest share of the variation (R² ≈ 0.23) — a realistic reminder that more predictors don't automatically mean a better model.
Diagnostics: don't trust a model you haven't checked
A high R-squared doesn't mean the model is sound. Linear regression assumes the errors are random, evenly spread, and roughly normal — and the way to check is to look at the residuals, the gaps between predicted and actual prices. Stratum opens the standard diagnostic plots individually from a menu: Residuals vs Fitted (look for a shapeless cloud, not a pattern), Normal Q-Q, Scale-Location, and Influence (Leverage).
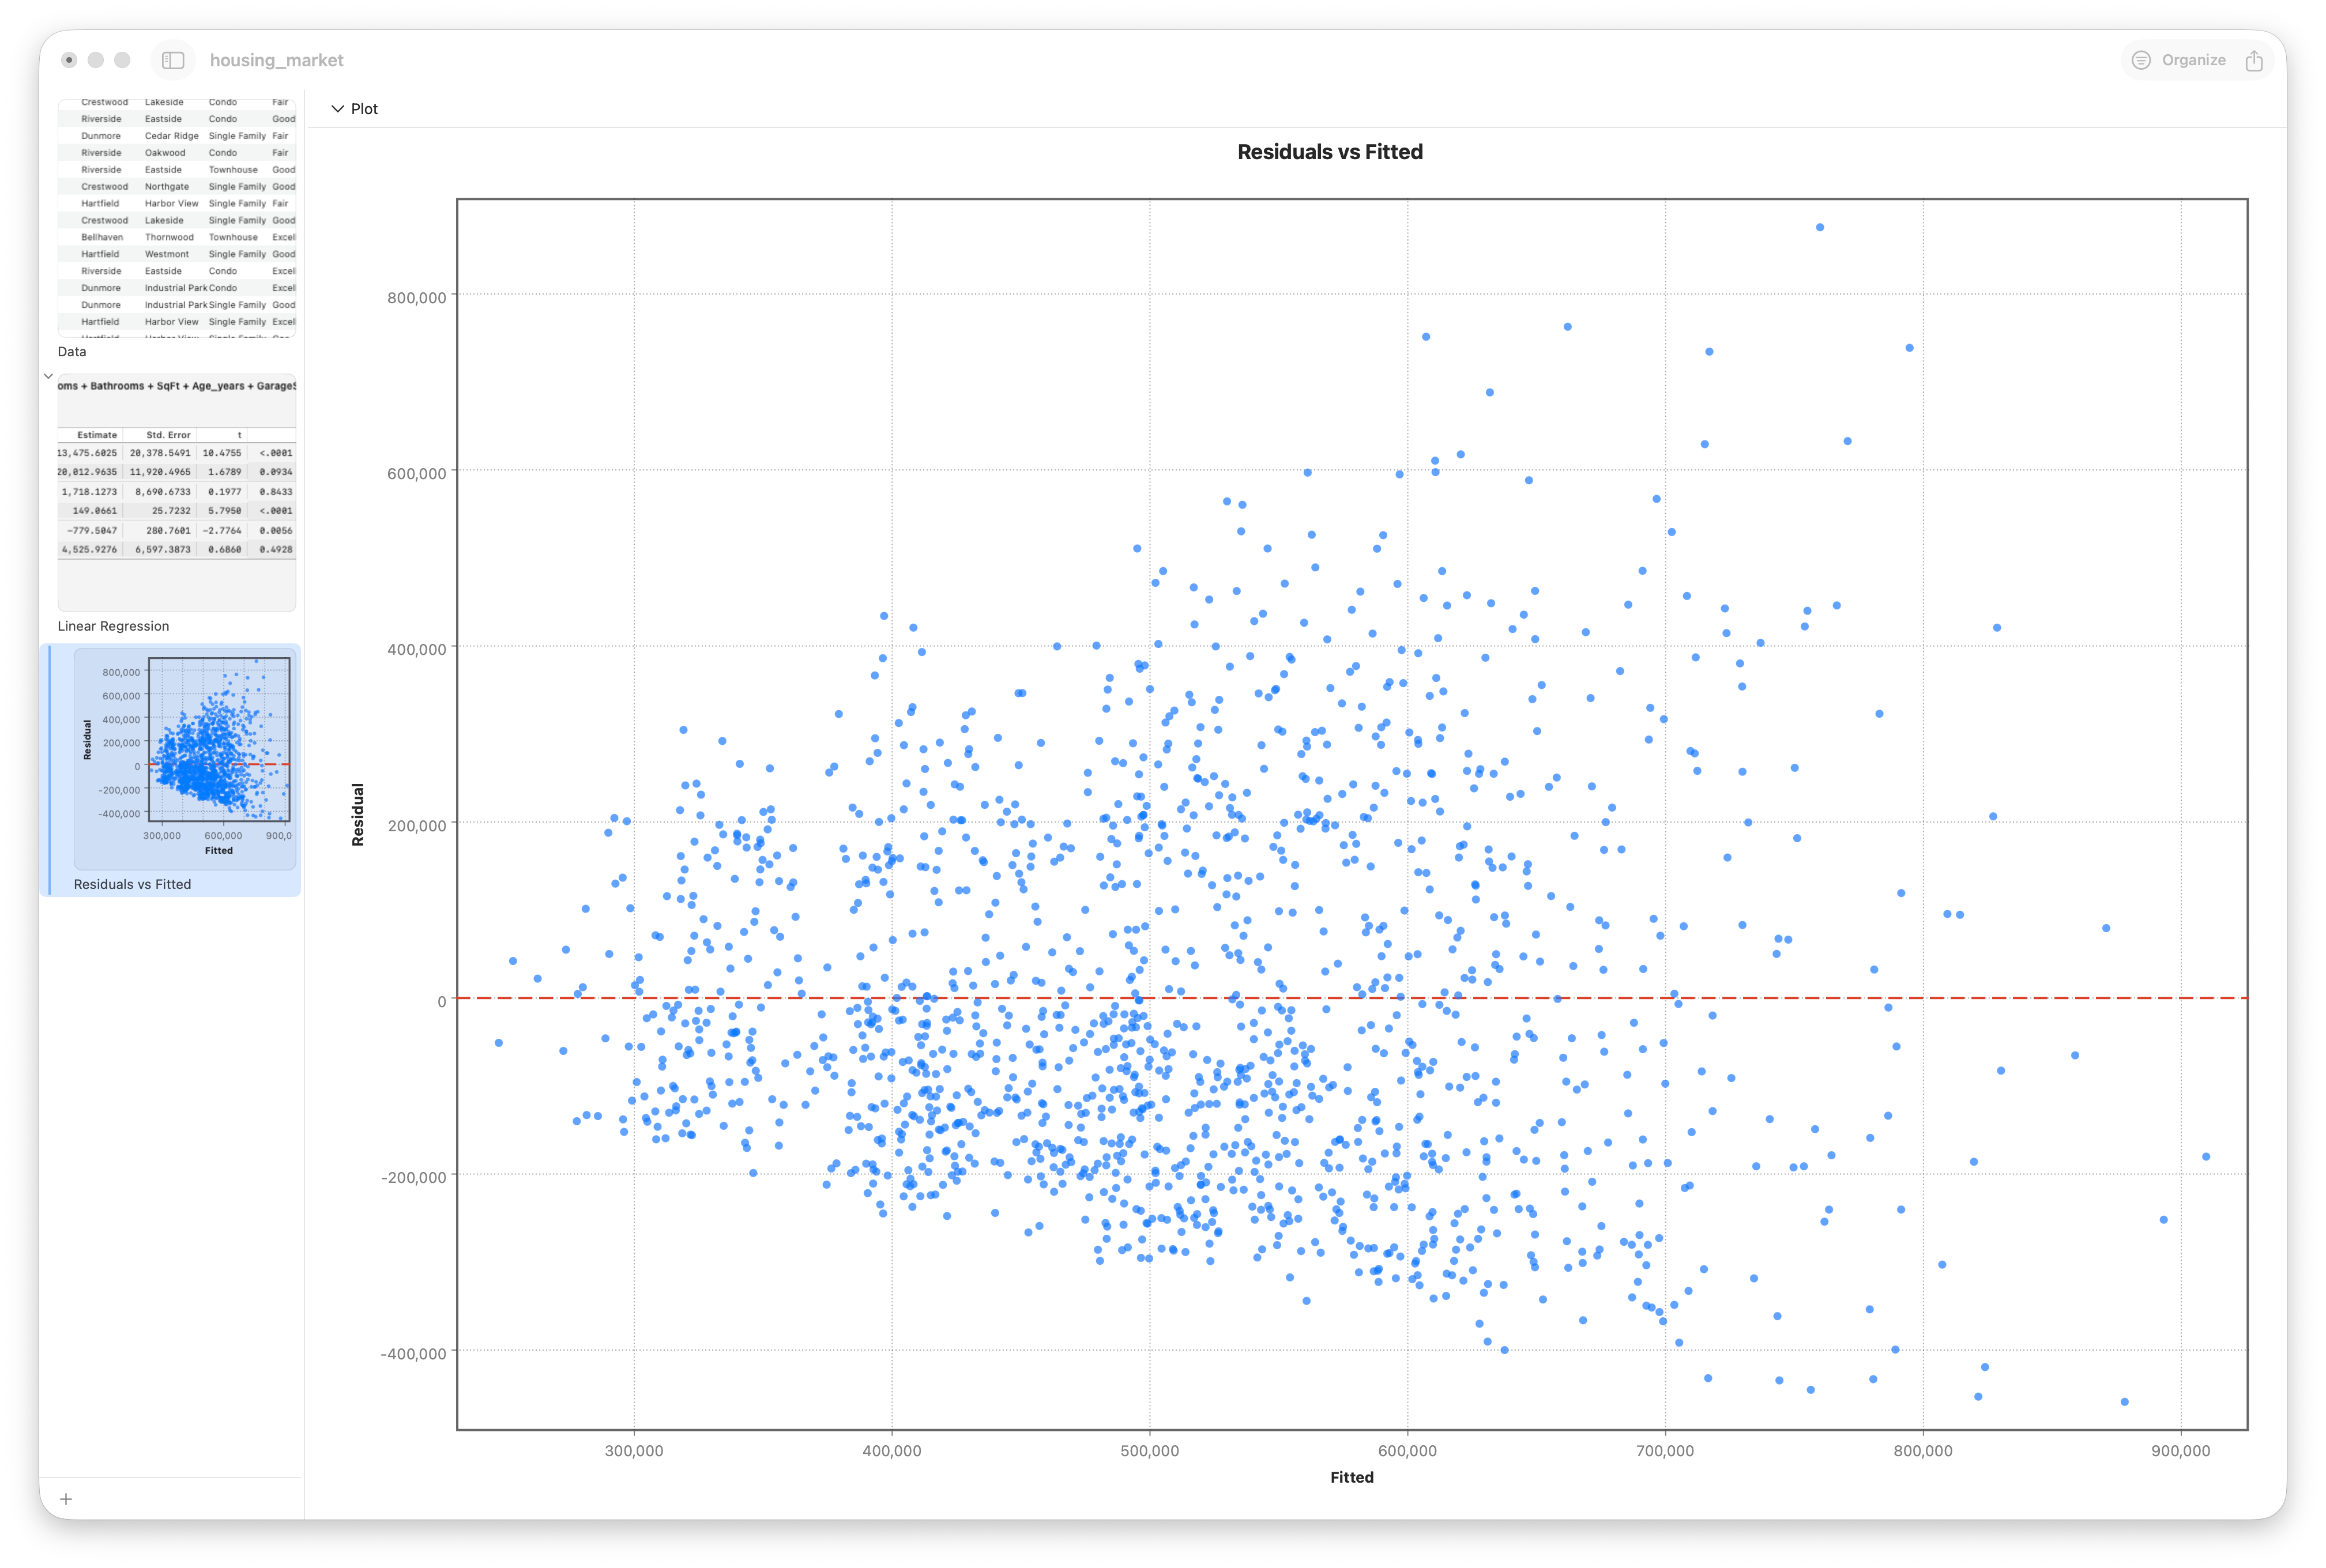
A curve in the residuals means a straight line was the wrong shape. A widening funnel means the spread of errors grows with price — non-constant variance. And a few points sitting far out on the leverage plot are influential: single observations with enough pull to bend the whole fit. Cook's distance and leverage flag them so you can investigate rather than be misled.
Multicollinearity and VIF
When two predictors carry nearly the same information — say SqFt and number of bedrooms — the model can't cleanly separate their effects. This is multicollinearity, and it inflates the coefficients' standard errors, making them unstable and hard to interpret. The variance inflation factor (VIF) measures it for each predictor, and Stratum reports it as the rightmost VIF column of the coefficients table above — no separate view to open. A VIF above about 5 to 10 is a warning sign. Here SqFt (VIF ≈ 8) and Bedrooms (≈ 6.8) clearly overlap — bigger homes tend to have more bedrooms, so the two predictors compete to explain the same variation.
Which predictors? Best-subsets selection
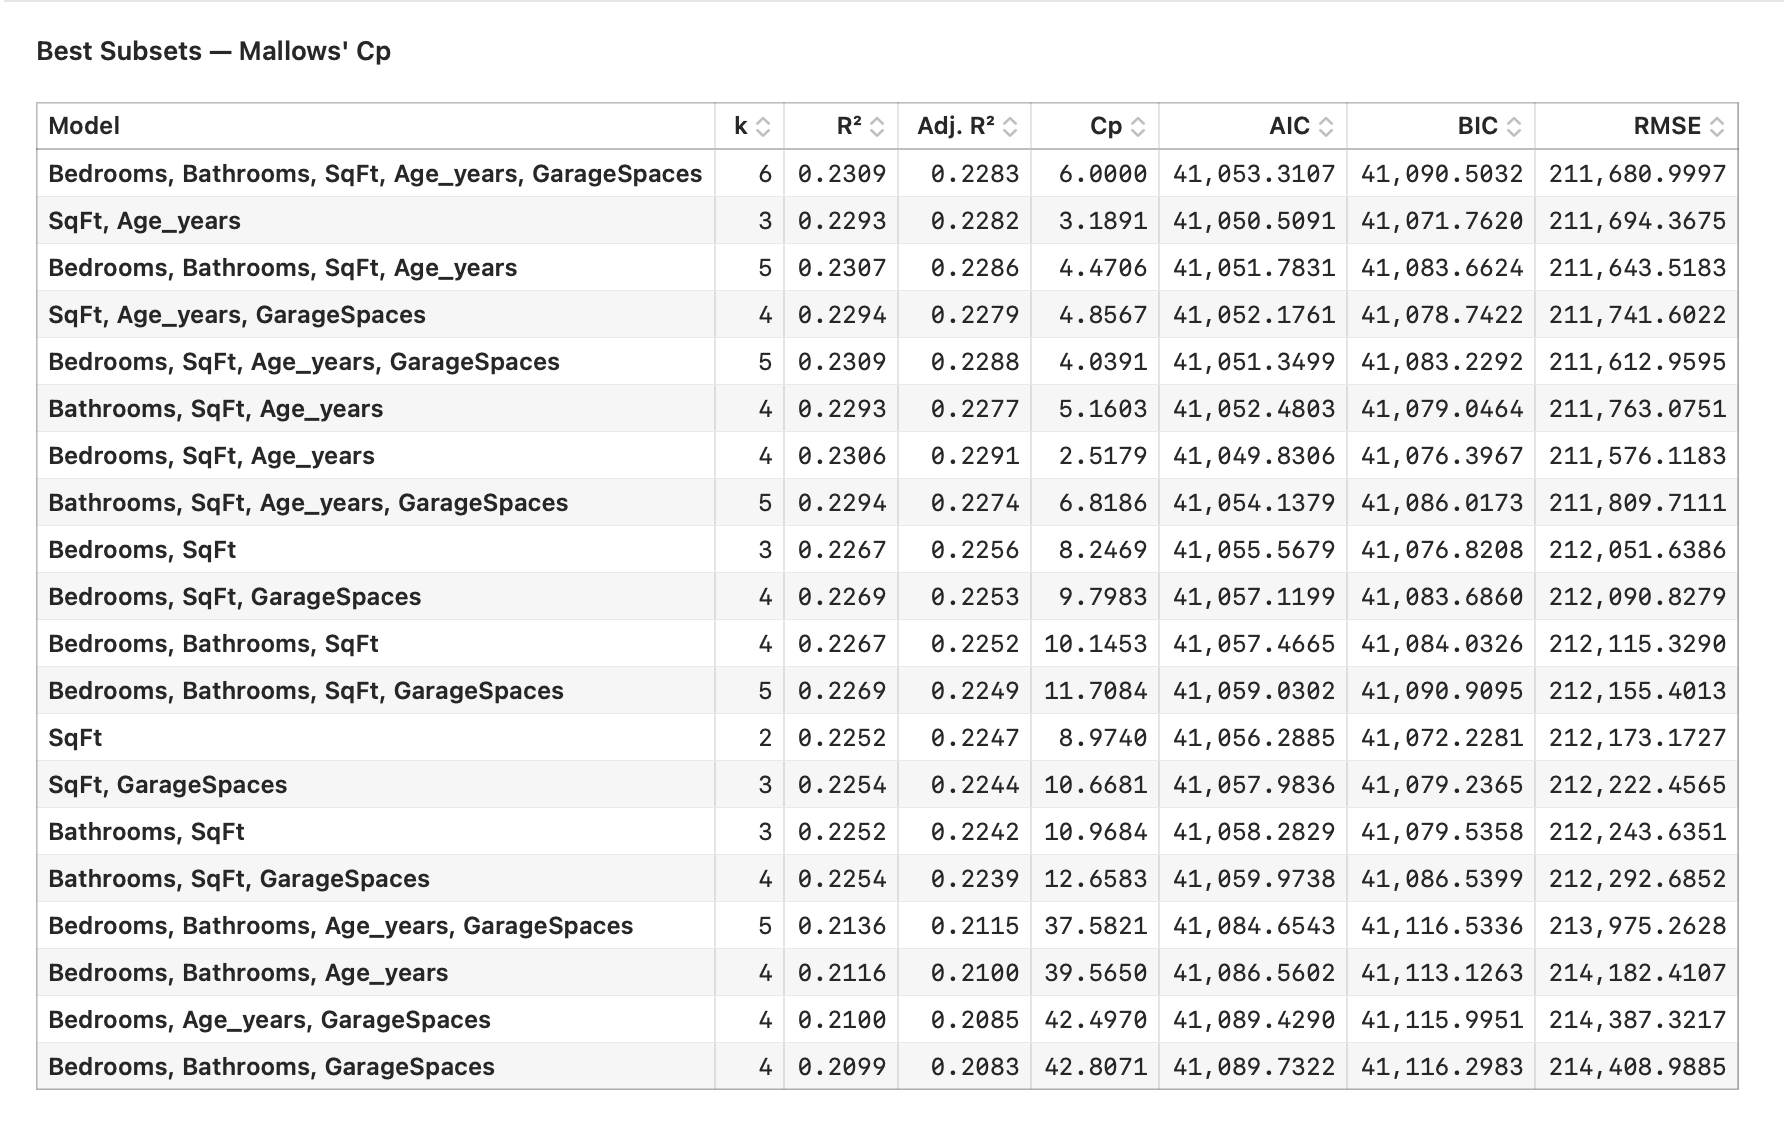
With many candidate predictors, which combination makes the best model? Throwing them all in risks overfitting — a model that memorizes this sample's noise and predicts new data poorly. Switch the operation mode from Fit Model to Best Subsets, and Stratum fits and ranks the leading combinations so you can pick a model that's both accurate and parsimonious.
Put the model to work
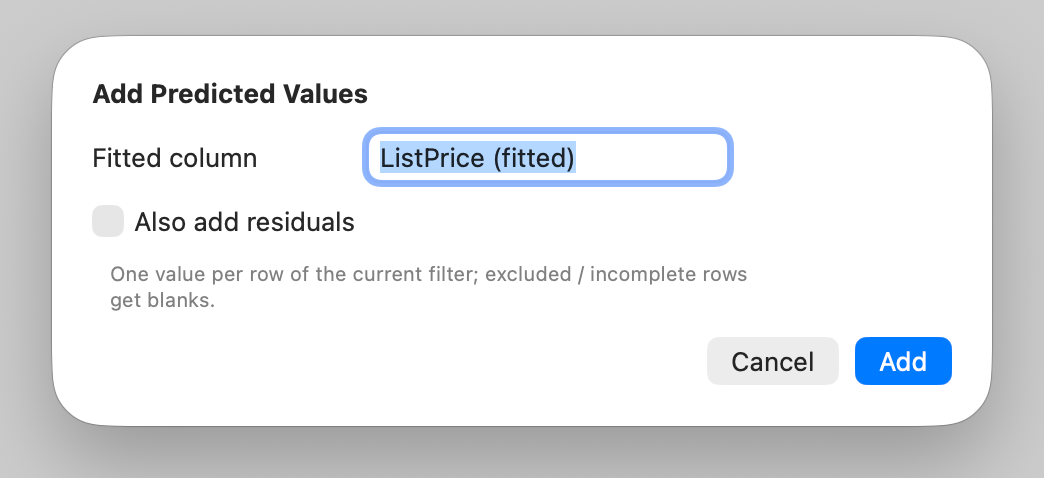
Once you trust the model, use it. Stratum can add a predicted-value column to your data, scoring every row from the fitted equation — turning a statistical model into a practical tool you can sort, filter, and chart like any other column.
Follow along
- Dataset
- housing_market.csv
- You'll use
- The model builder, coefficients and R-squared, residual diagnostics, VIF, best-subsets selection, and a predicted-value column
- Up next
- Lesson 18 — Trend & Time-Series
Regression modeled a response from other variables measured at the same time. But some data unfolds in order — readings over hours, prices over months — and that sequence carries information of its own. Next we'll work with data that moves through time.