 Stratum
Decision Trees: Interpretable Predictive Models
Most predictive models are black boxes. A decision tree is the opposite — it predicts by asking a short series of plain yes-or-no questions, and you can read the whole thing like a flowchart. That transparency makes it the perfect place to start with modeling.
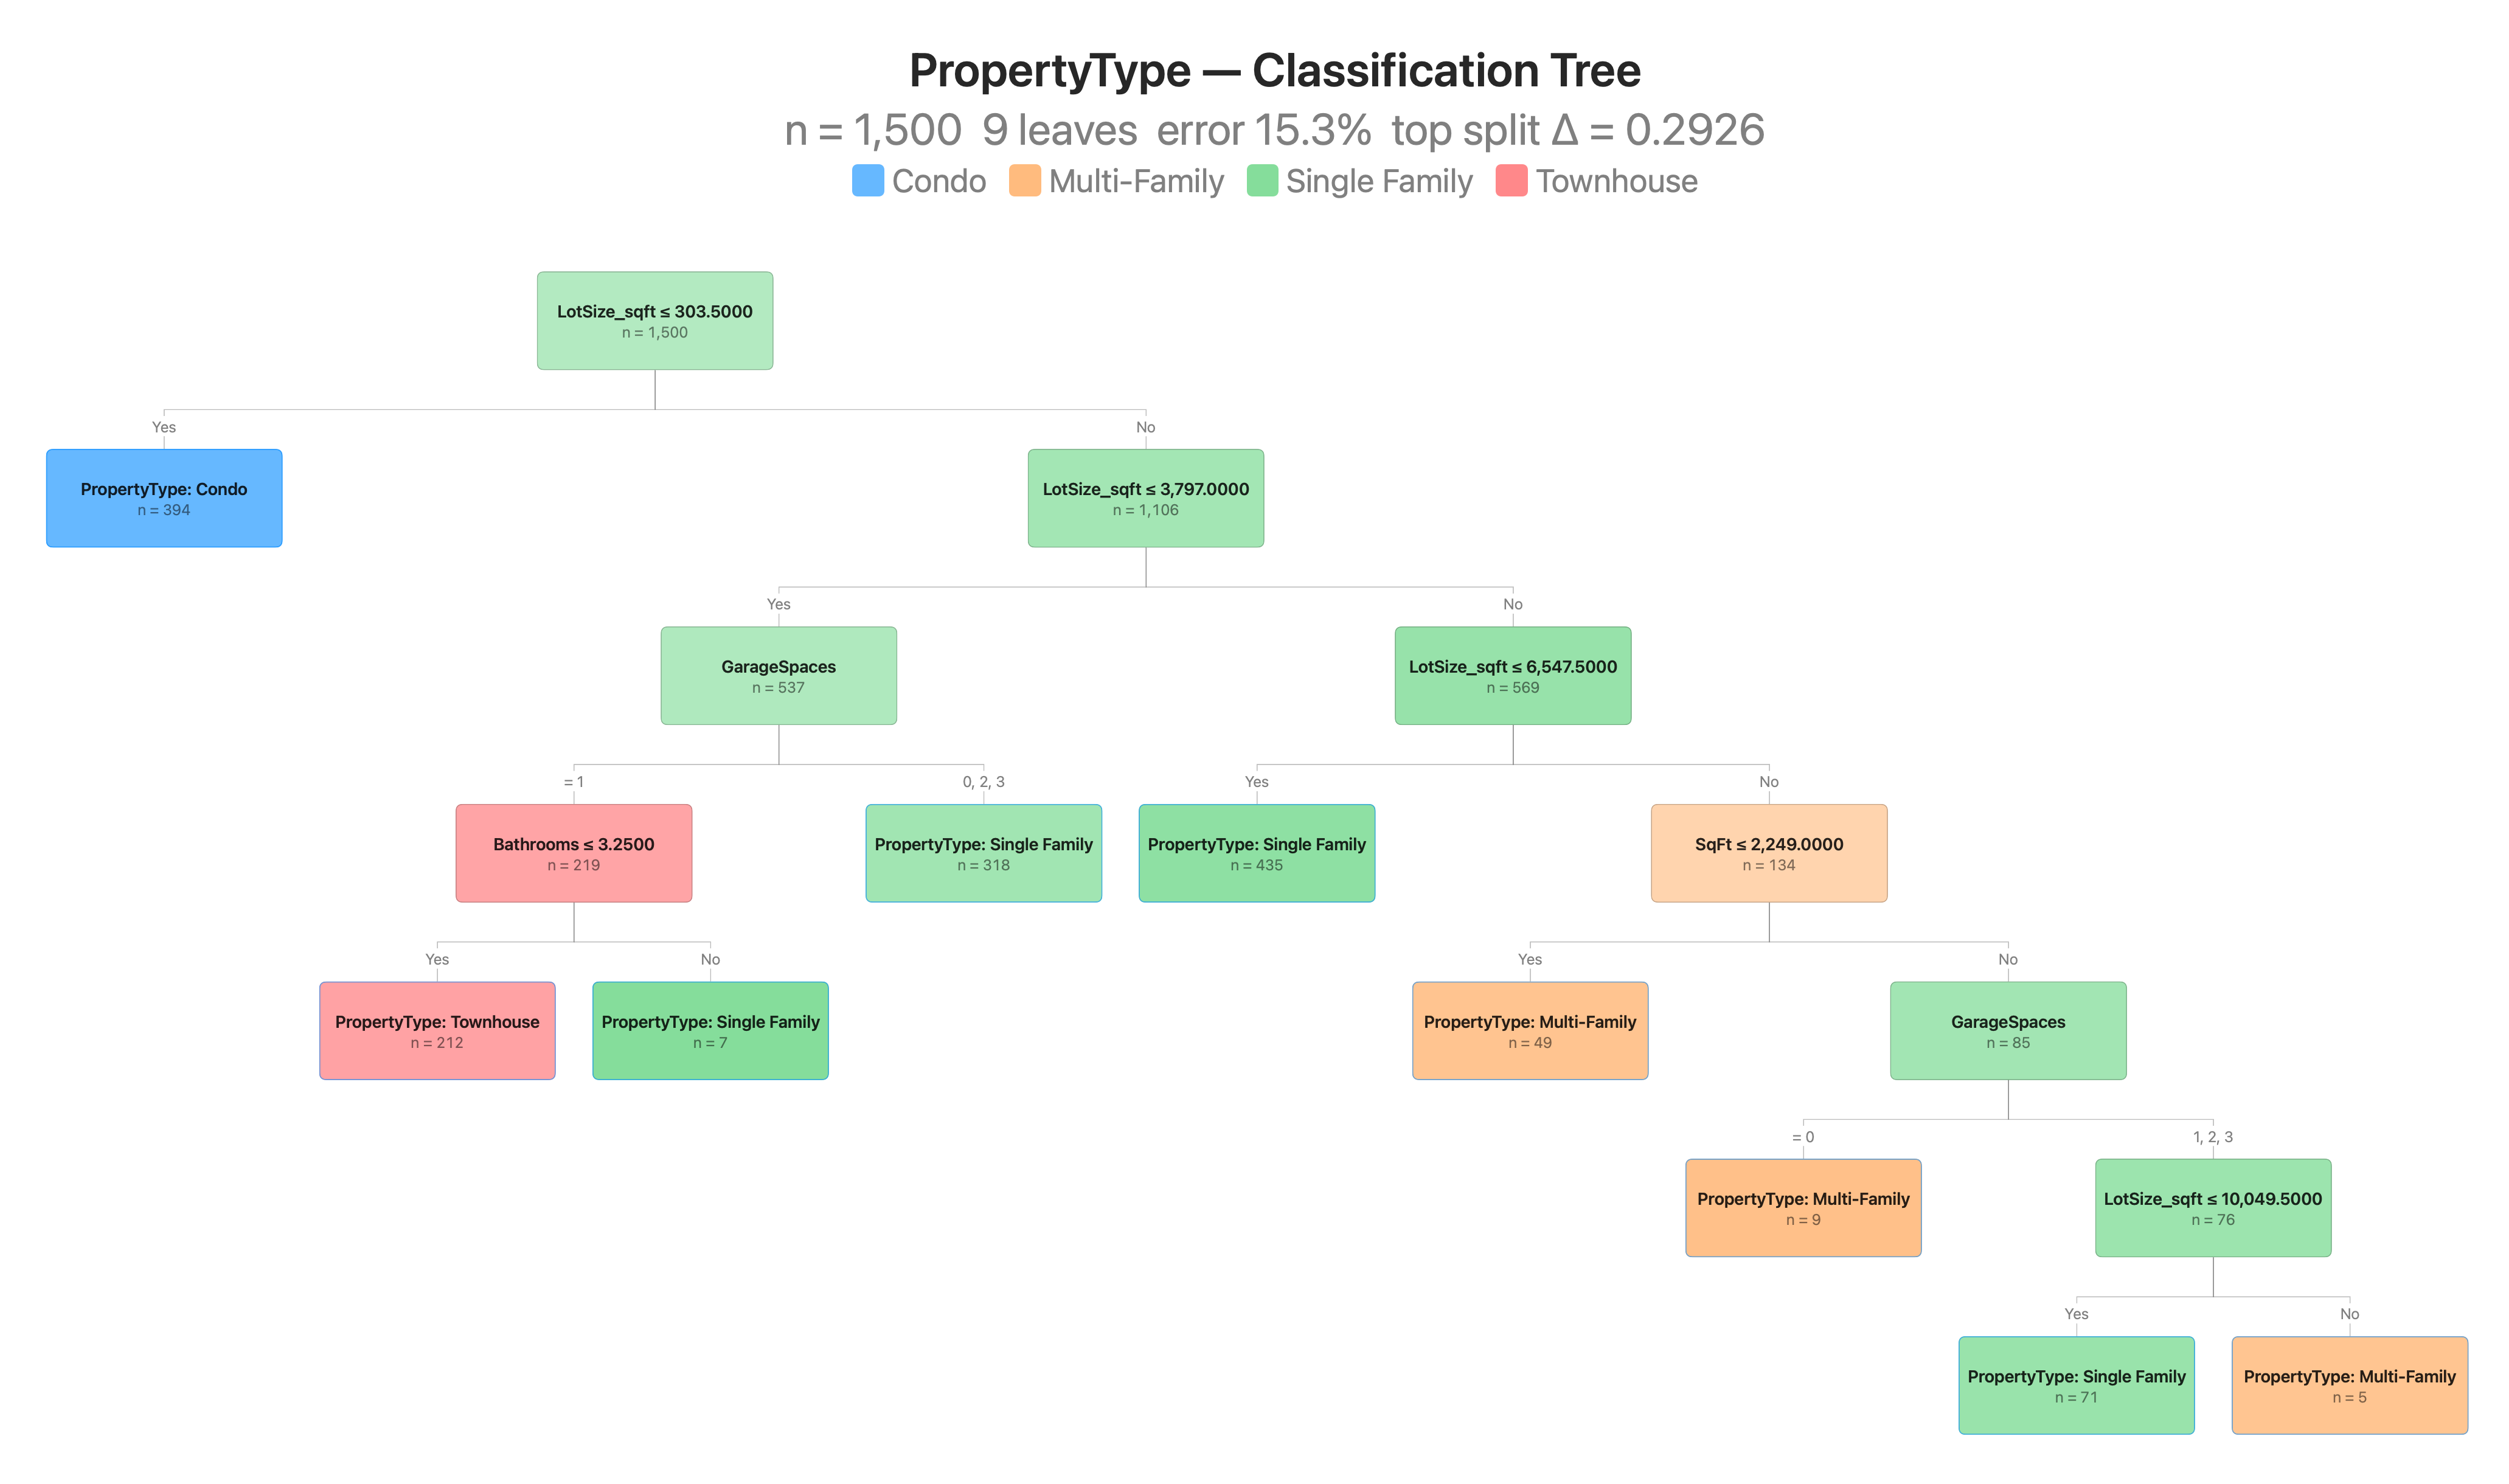
Suppose you want to predict a home's property type from its features — square footage, number of bedrooms, lot size, age. A decision tree learns to do this by splitting the data into smaller and smaller groups, each split chosen to make the groups as pure as possible. The result is a model you can actually explain to someone: "If the lot is large and there's a garage, it's probably a detached house." Build one from Analyze ▸ Data Mining ▸ Decision Tree and learn how it thinks.
How a decision tree learns
The core idea is recursive partitioning. The tree looks at every variable and every possible cut point, and asks: which single split divides the data into the two cleanest groups? It makes that split, then repeats the whole search inside each resulting group, again and again, building branches as it goes. Each rectangle of data it carves out becomes purer than the one above it.
"Cleanest" needs a yardstick, and that's where impurity comes in. For a classification tree, Stratum measures impurity with the Gini index — a number that's zero when a group contains only one category and rises as the categories get more mixed. A split is judged by how much it lowers the combined impurity of its children. The split that buys the biggest drop wins.
Classification trees vs regression trees
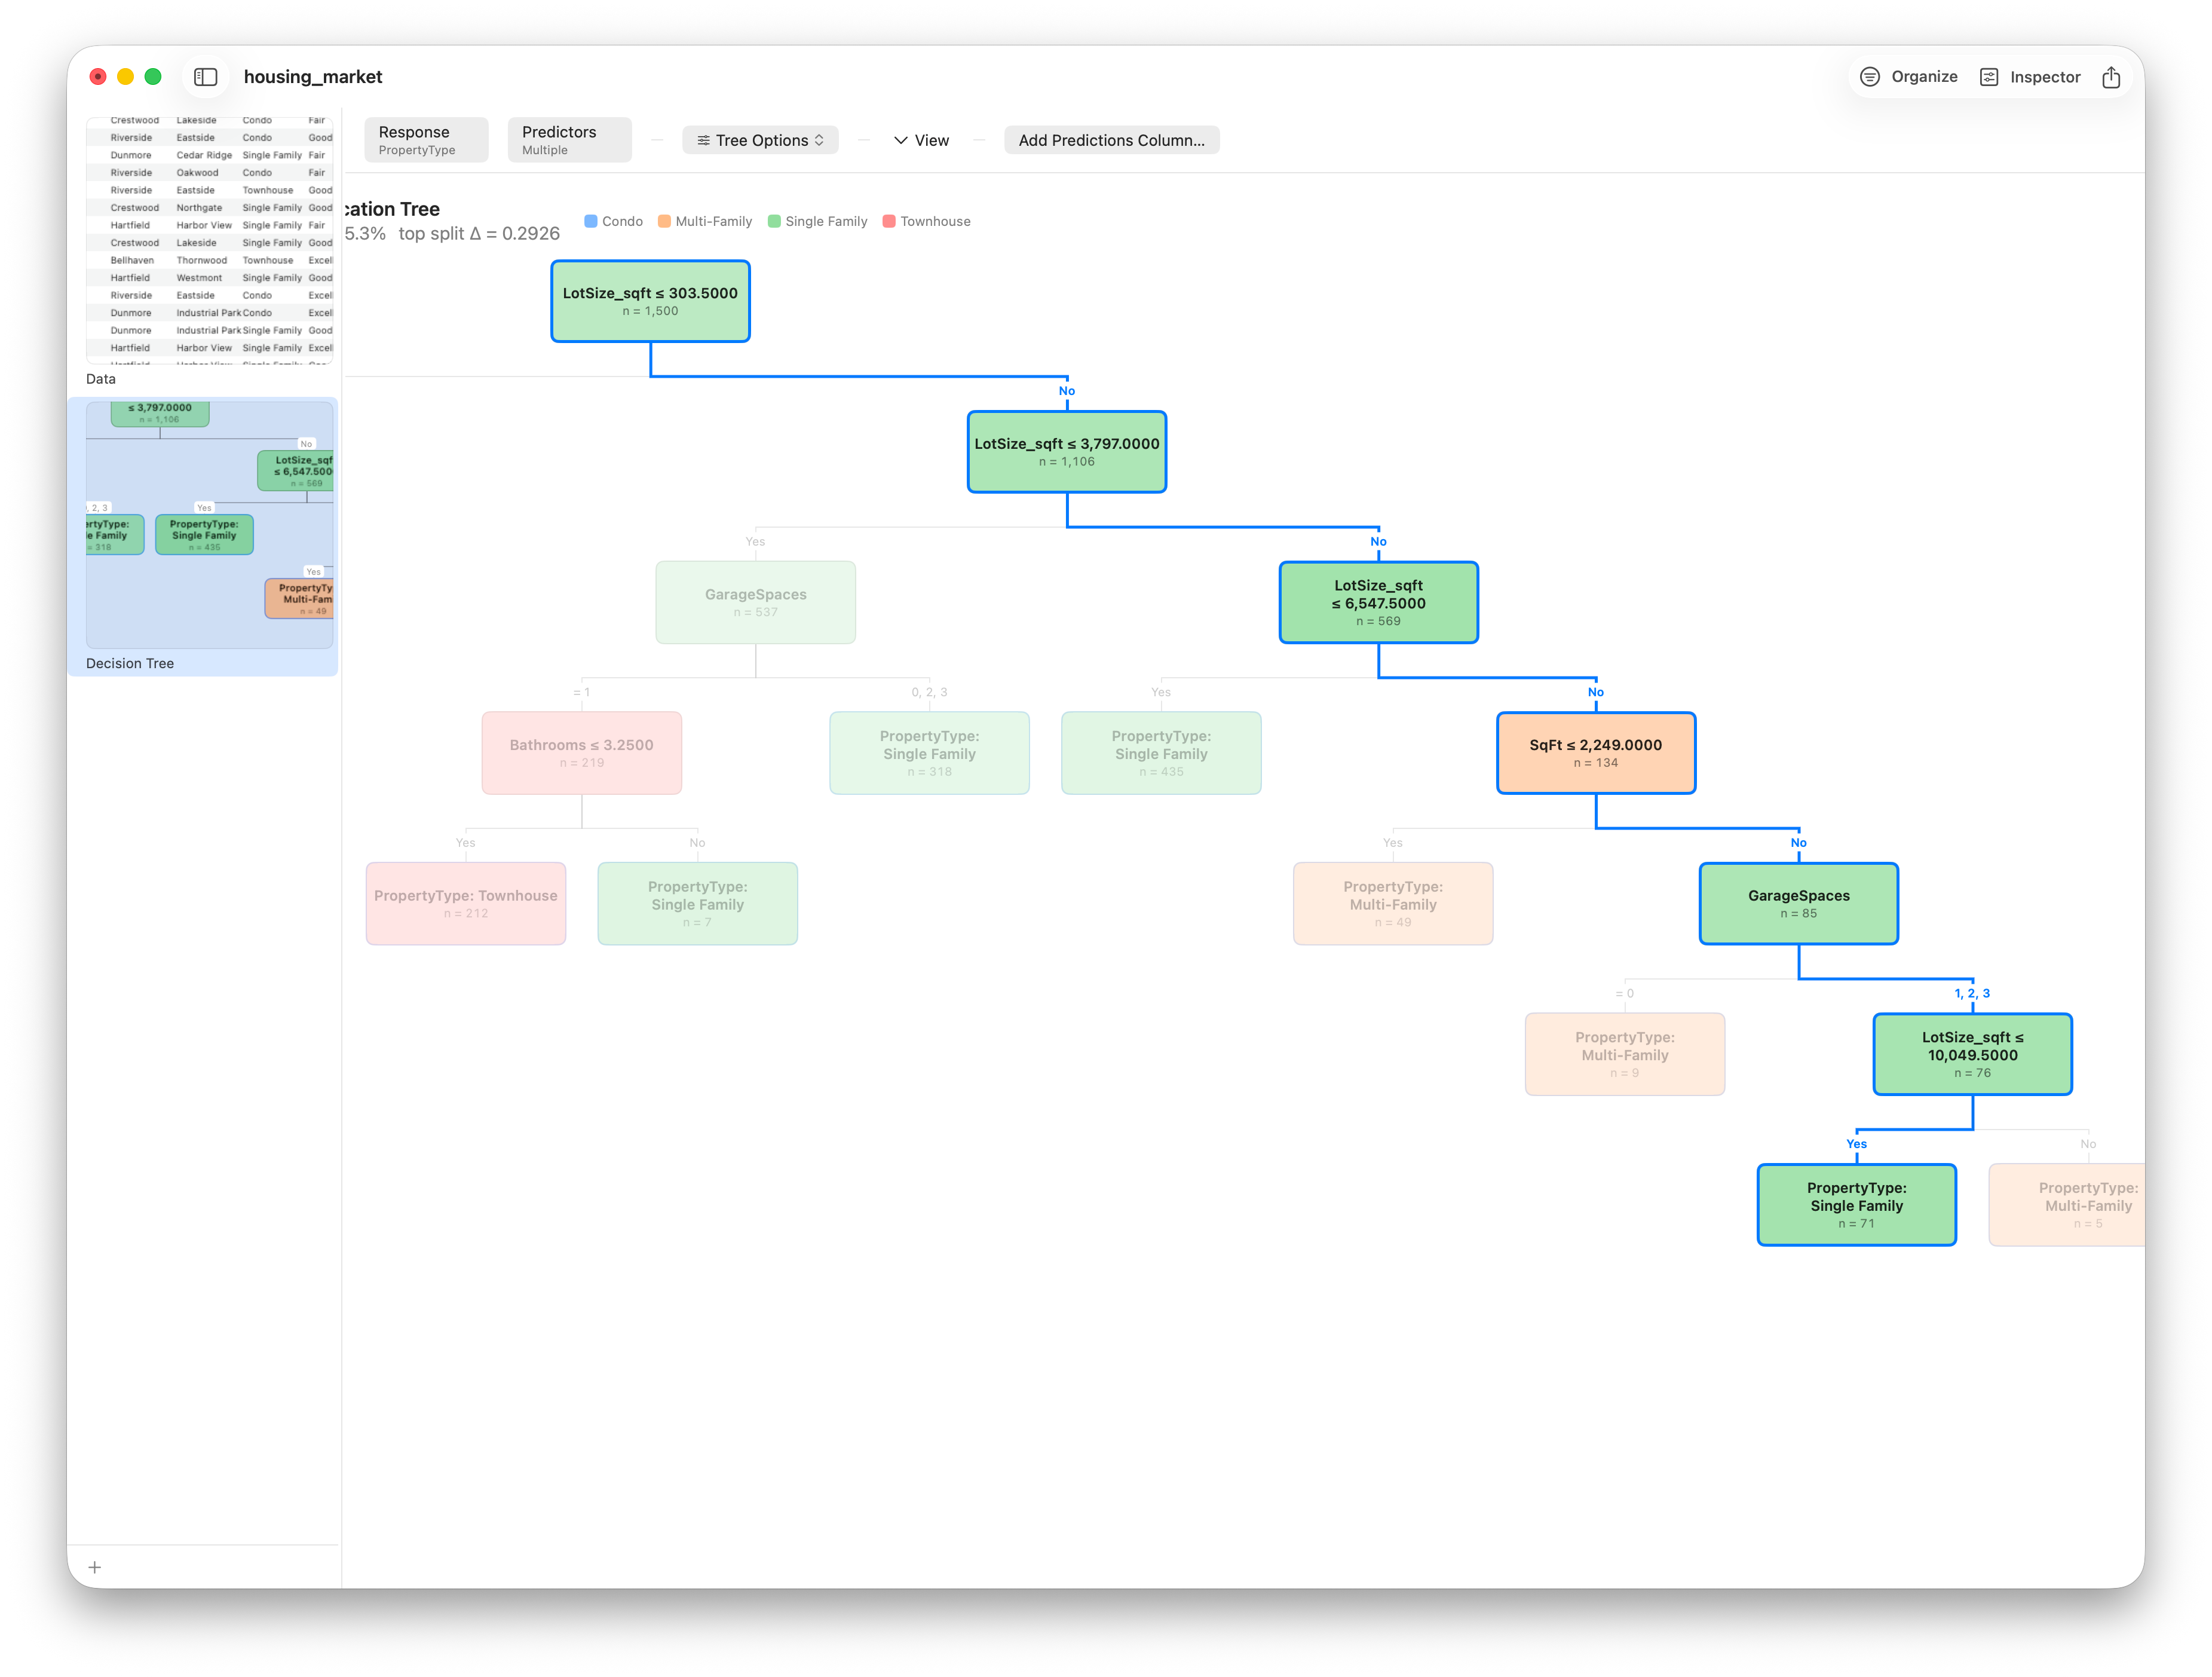
The same machinery predicts numbers too. When your target is a category — property type — you get a classification tree, and each leaf predicts the most common class in it. When your target is a number — list price — you get a regression tree, each leaf predicts the average value of the rows that land there, and impurity is measured as variance instead of Gini. Stratum picks the right mode automatically from the type of the response column you choose, so switching from predicting a category to predicting a price is just a matter of pointing at a different column.
Overfitting and pruning
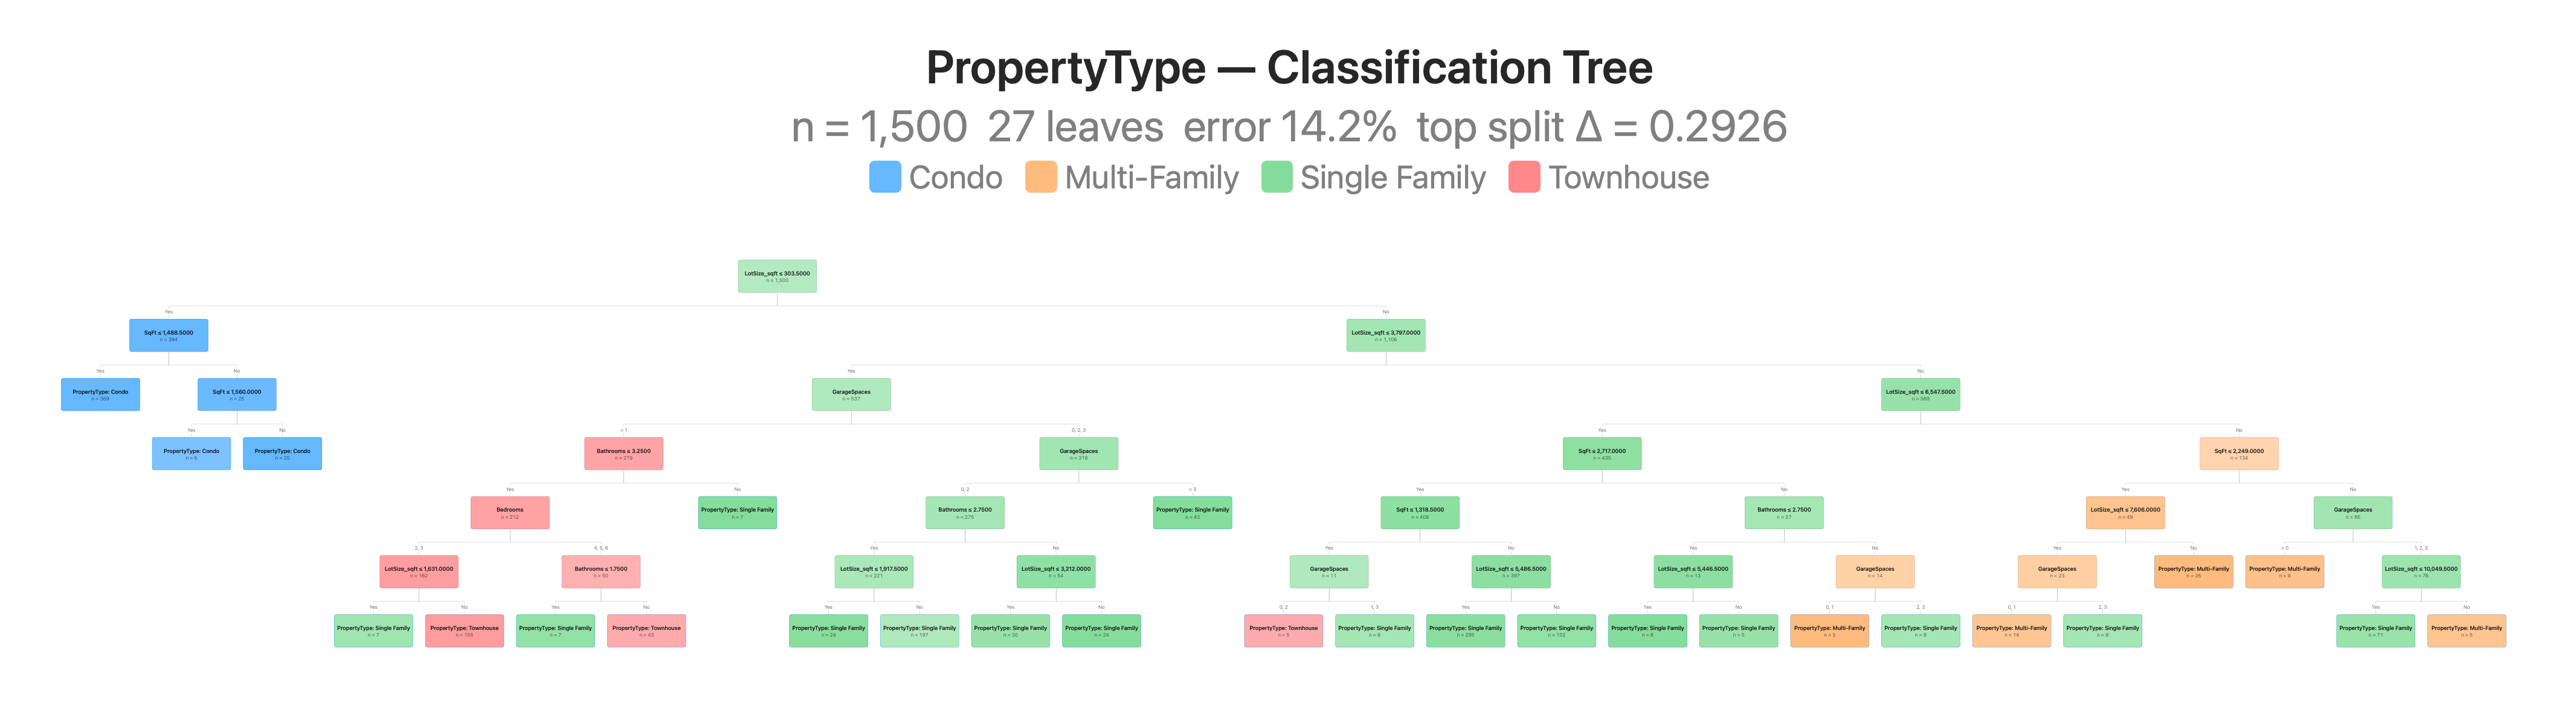
Left unchecked, a tree will keep splitting until every leaf is perfectly pure — memorizing the training data right down to its noise. That tree looks flawless on the data it was built from and fails on anything new. This is overfitting, and the cure is pruning.
Stratum uses cost-complexity pruning guided by cross-validation, and it's on by default. Stratum grows a big tree, then snips back the branches that don't earn their keep, using held-out data to decide how much pruning gives the best honest accuracy. The result is a smaller, more general tree that performs well on data it has never seen — toggle Prune (CV) off in the control bar if you want to see the full, over-grown tree it started from.
Which variables matter most?
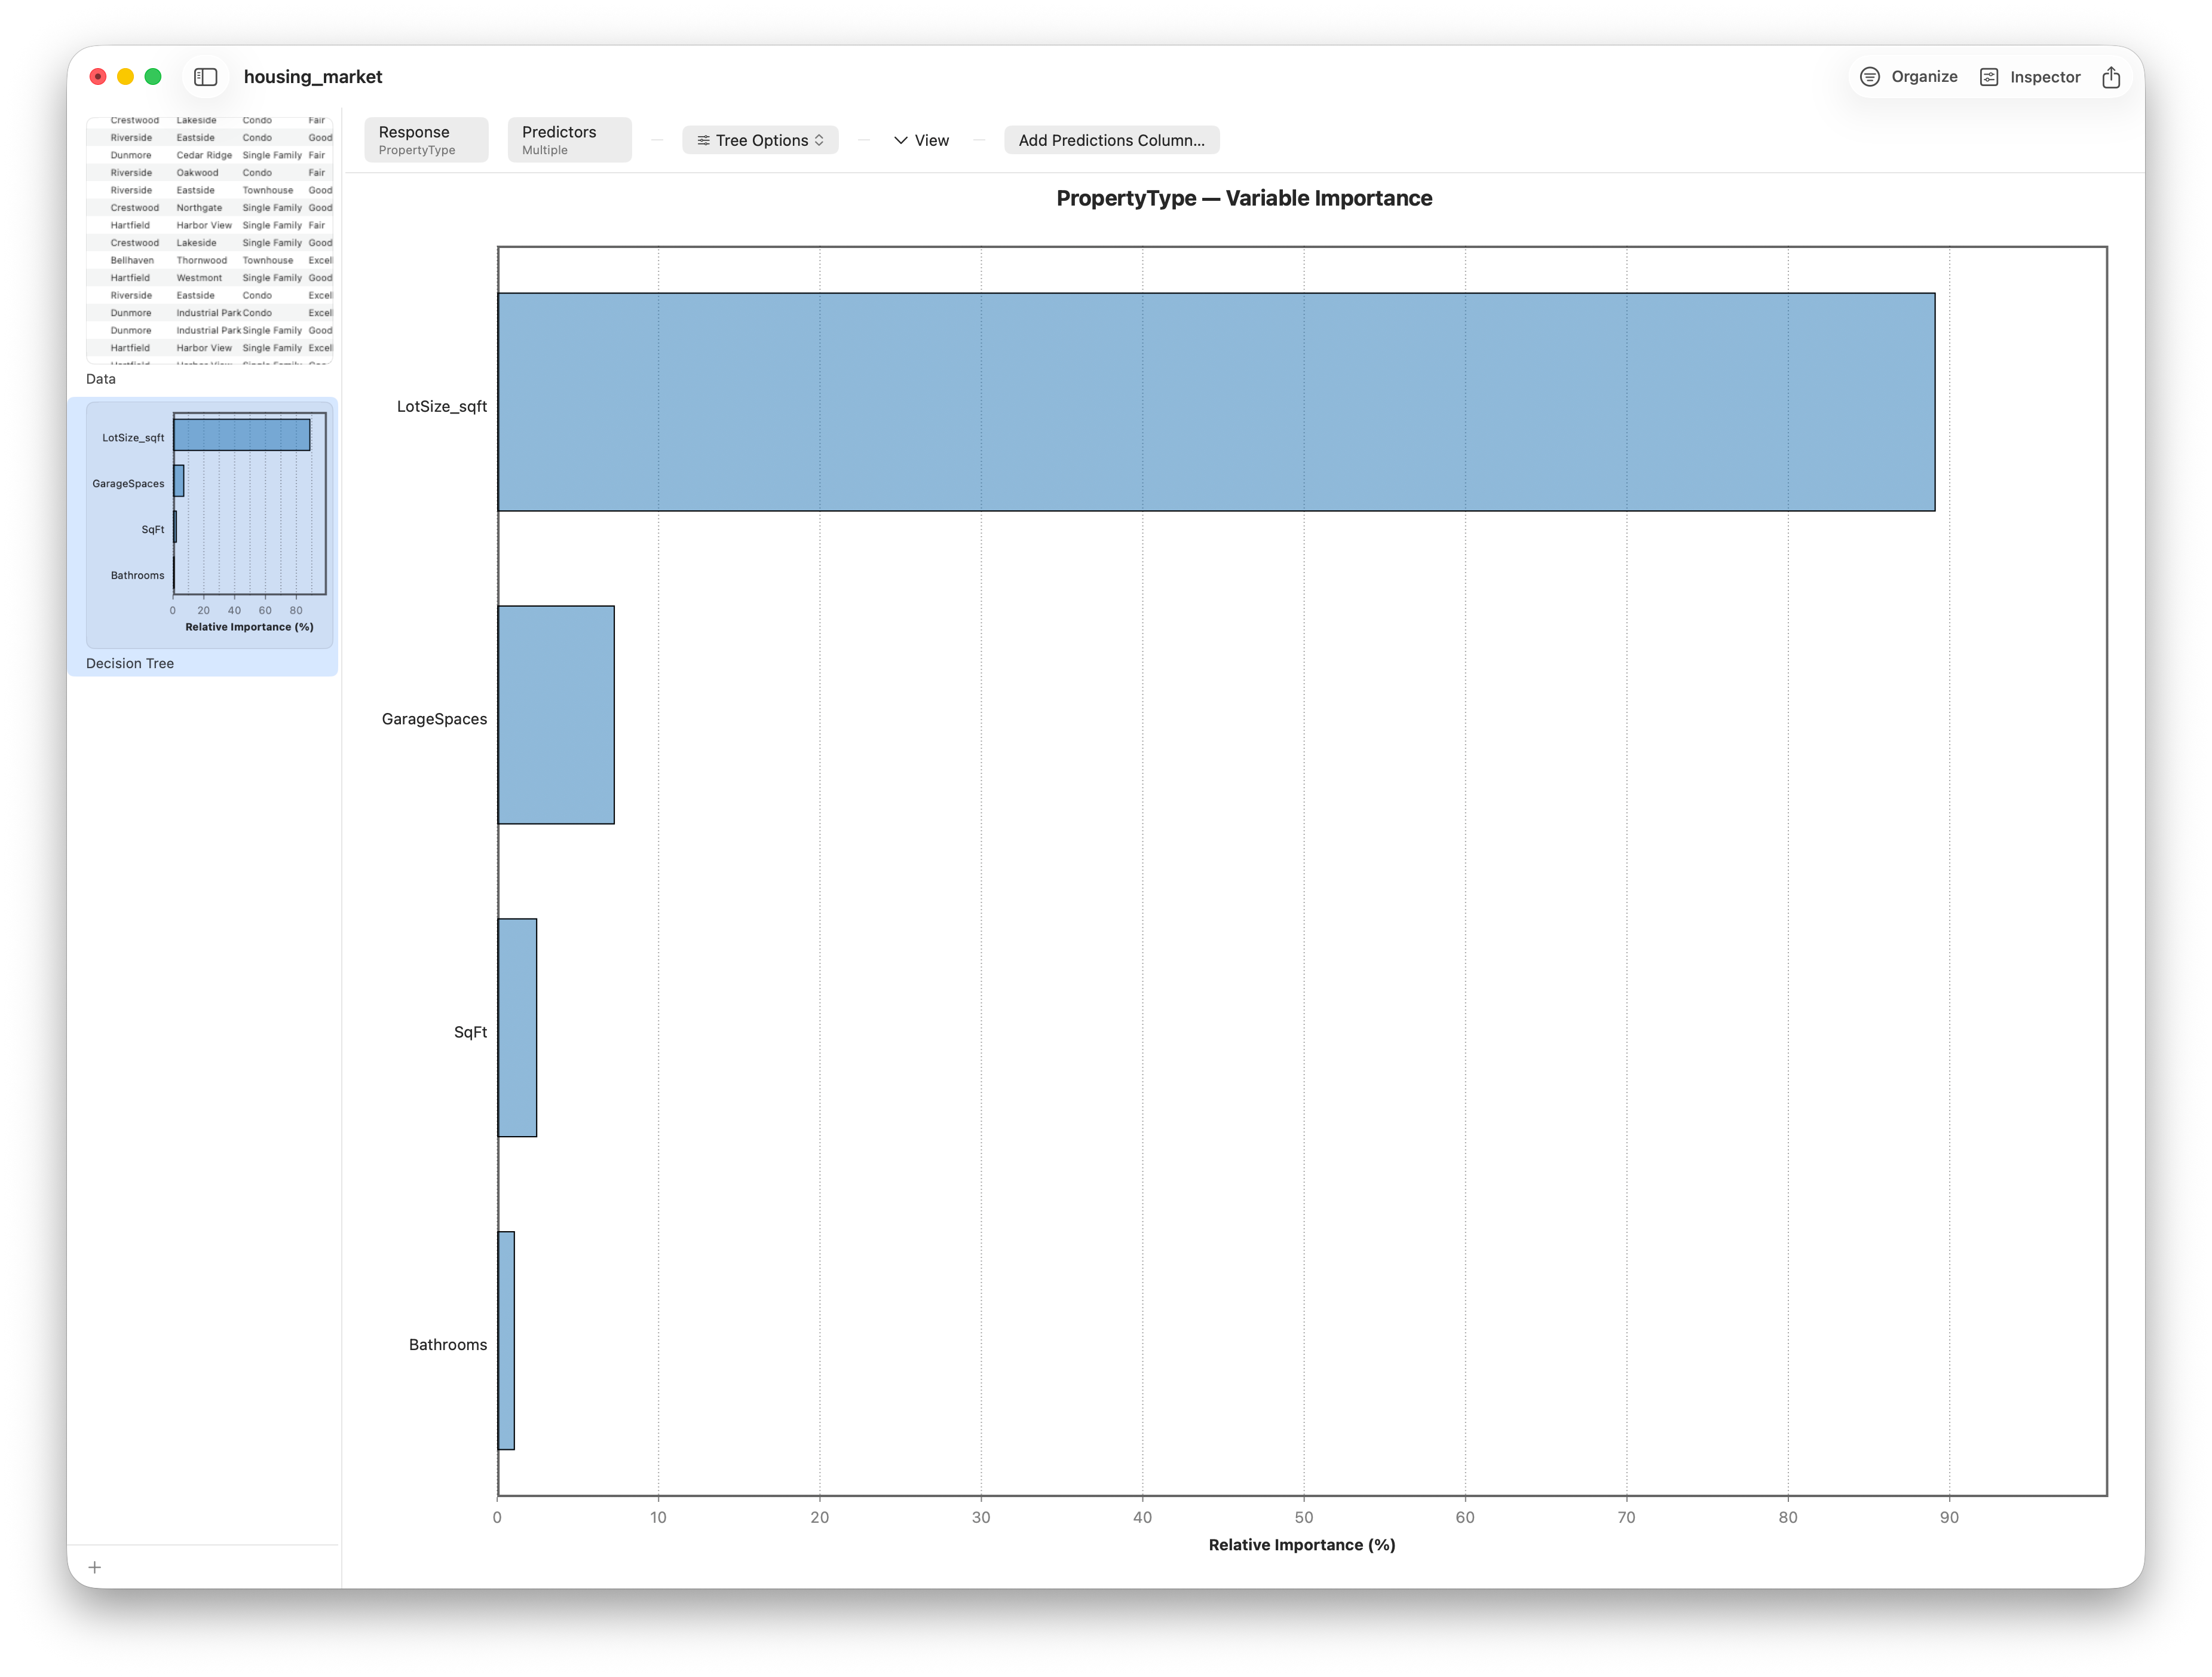
Because each split lowers impurity by a measurable amount, Stratum can add up those gains per variable and rank them. Switch View ▸ Importance and the Variable Importance panel appears — a clear bar chart of which inputs actually drive the predictions. Often a handful of variables carry the model and the rest barely register, which is useful intelligence in its own right.
Putting predictions back to work
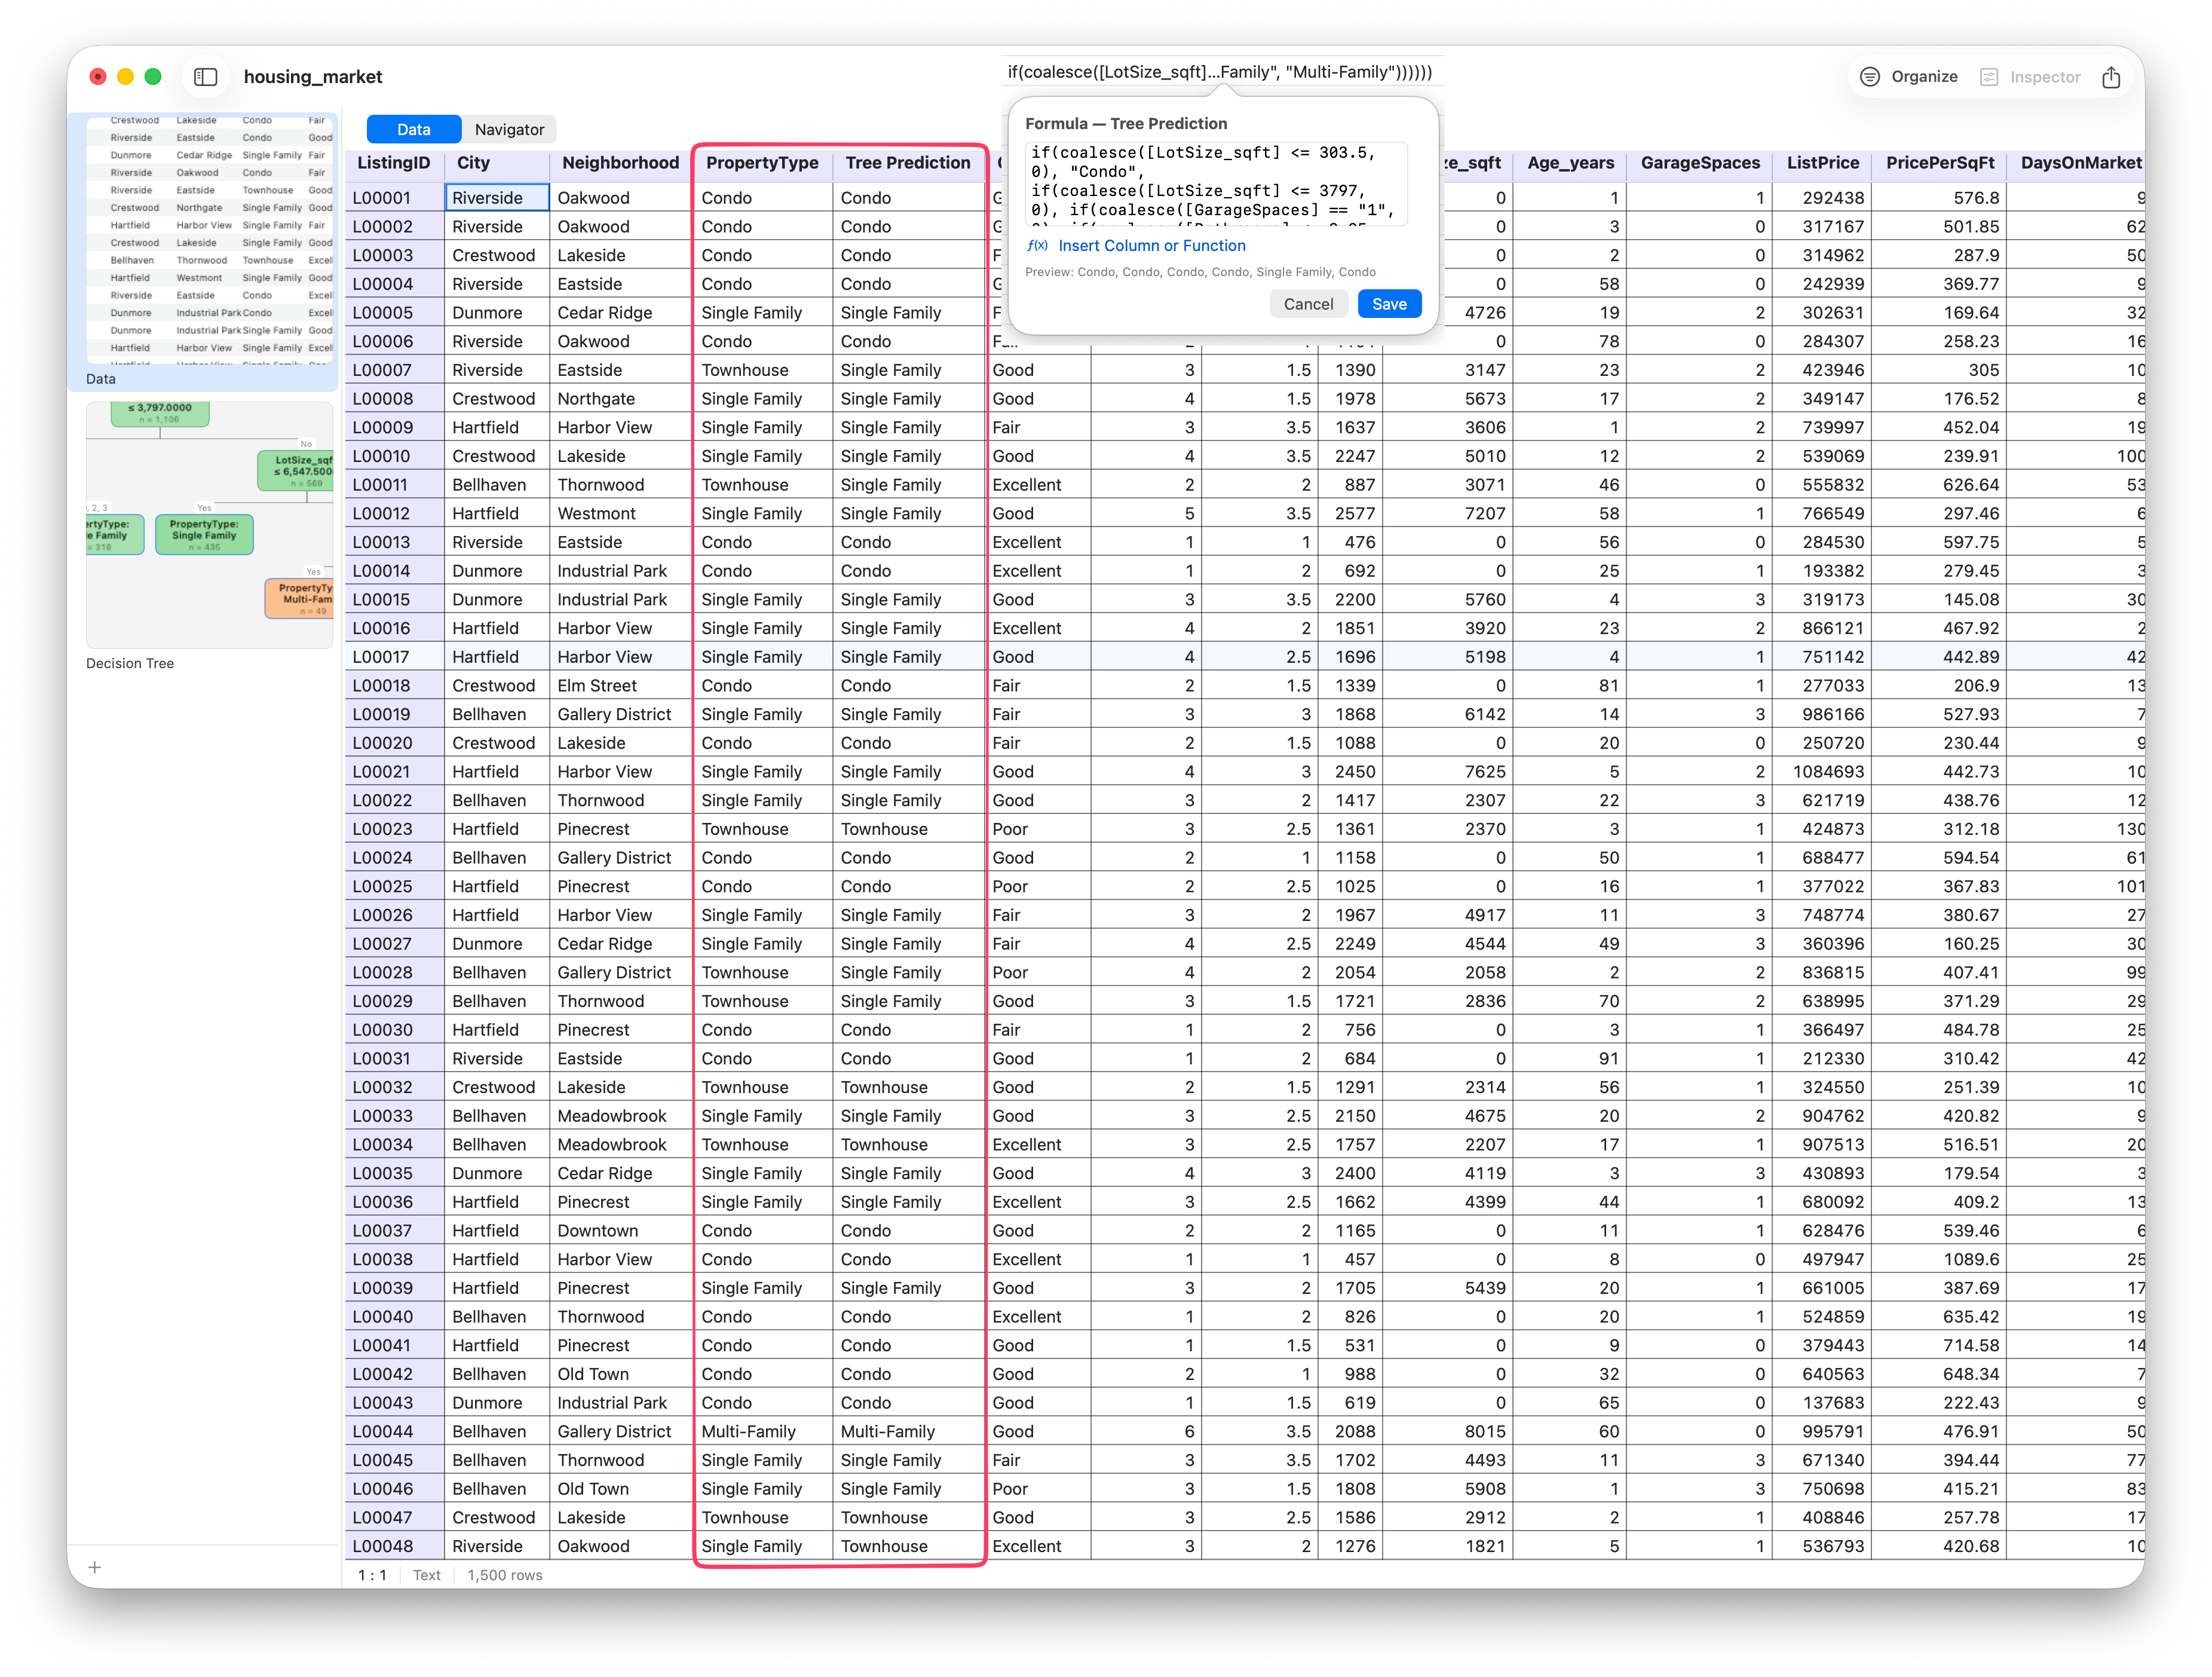
A model is only useful if you can act on it. With one click, Stratum adds the tree's predictions back to your grid as a new column, sitting alongside your raw data. From there you can filter the misclassified rows, compare predicted price against list price, or feed the column into another chart — the model becomes just another part of your dataset.
Follow along
- Dataset
- housing_market.csv
- You'll use
- The Decision Tree analysis — predict
PropertyType(classification) orListPrice(regression), with pruning, feature importance, and an added predictions column - Up next
- Lesson 24 — Random Forest & Boosted Trees
A single tree is wonderfully readable, but it's also a little unstable — change a few rows and the splits can shuffle. In the next lesson we'll fix that by growing many trees and combining them, trading a bit of interpretability for a big jump in accuracy.