 Stratum
Best Statistics Software for Mac & Windows (2026)
There's no single “best” — the right statistics tool depends on what you actually do. Here's an honest map of the options on Mac and Windows in 2026, what each is good at, and a checklist to choose.
Search “best statistics software for Mac” and you'll get a dozen confident, conflicting answers. The honest truth is that the best tool depends on the work: a quick average, a regression with diagnostics, a reproducible pipeline, and a regulated clinical analysis all point to different software. Here's the landscape, what each option is genuinely good at, and a checklist to match a tool to your needs.
How to think about it
Before comparing apps, answer three questions. What's the analysis? Arithmetic and charts, or real inferential statistics and modeling? Do you code? If yes, your options widen; if no, point-and-click matters a lot. What constrains you? Budget, a single-OS shop, privacy/offline requirements, or a tool your field or journal expects. Your answers usually rule out most of the list immediately.
The options, and what each is good at
- Spreadsheets (Excel, Numbers) — unbeatable for entering, storing, and sharing tabular data and quick arithmetic. Thin and error-prone for real inferential statistics, and the charts aren't statistical. Great as a data source, weak as an analysis tool. See Stratum vs Excel.
- R and Python — free, infinitely flexible, fully reproducible, with every method imaginable via packages. The cost is a real coding learning curve and time spent gluing libraries together. The right choice if you already write code or need bespoke methods.
- SPSS / SAS — long-standing standards in the social sciences and enterprise/clinical settings, widely taught and trusted. Powerful and established, but expensive, often subscription-based, and can feel dated on a modern desktop. See Stratum vs SPSS.
- JMP — deep interactive statistics with strong design-of-experiments and reliability tooling, plus JSL scripting. Premium price and a broad surface to learn. See Stratum vs JMP.
- GraphPad Prism — the life-science favorite: dose–response and nonlinear curve fitting, survival analysis, and graphs styled for journals. Excellent in that niche, pricey and narrow outside it. See Stratum vs Prism.
- Minitab — a quality-engineering staple (SPC, DOE, Six Sigma), Windows-first and subscription-priced.
- Native desktop stats apps (Stratum) — point-and-click analysis built for Mac & Windows: fast import, 30+ statistical charts, inferential tests with diagnostics, SPC, and machine learning, offline, at a one-time price.
A buyer's checklist
Weigh the candidates on what actually matters to you:
- Cost model — one-time vs recurring subscription. The big suites are mostly subscriptions; native apps and code are cheaper to own.
- Learning curve — menus you can use today vs a language to learn.
- Statistical charts — box/violin, Q-Q, density, Pareto, mosaic, control charts — not just bar and line.
- Diagnostics — does it give you VIF, Cook's distance, post-hoc tests, normality checks, or just a bare p-value?
- Machine learning — PCA, clustering, trees, forests built in?
- Scale — comfortable past a million rows?
- Native & offline — does it feel like a native desktop app, and does your data stay on your machine?
Quick guide
| If you… | Consider |
|---|---|
| Just need averages, sums, a quick chart | Excel / Numbers |
| Want point-and-click stats + charts + ML, native to Mac & Windows | Stratum |
| Already code and need full control / reproducibility | R or Python |
| Do dose–response / survival / lab graphs | GraphPad Prism |
| Need DOE / reliability depth | JMP or Minitab |
| Must match an institutional standard | SPSS / SAS |
Where Stratum fits
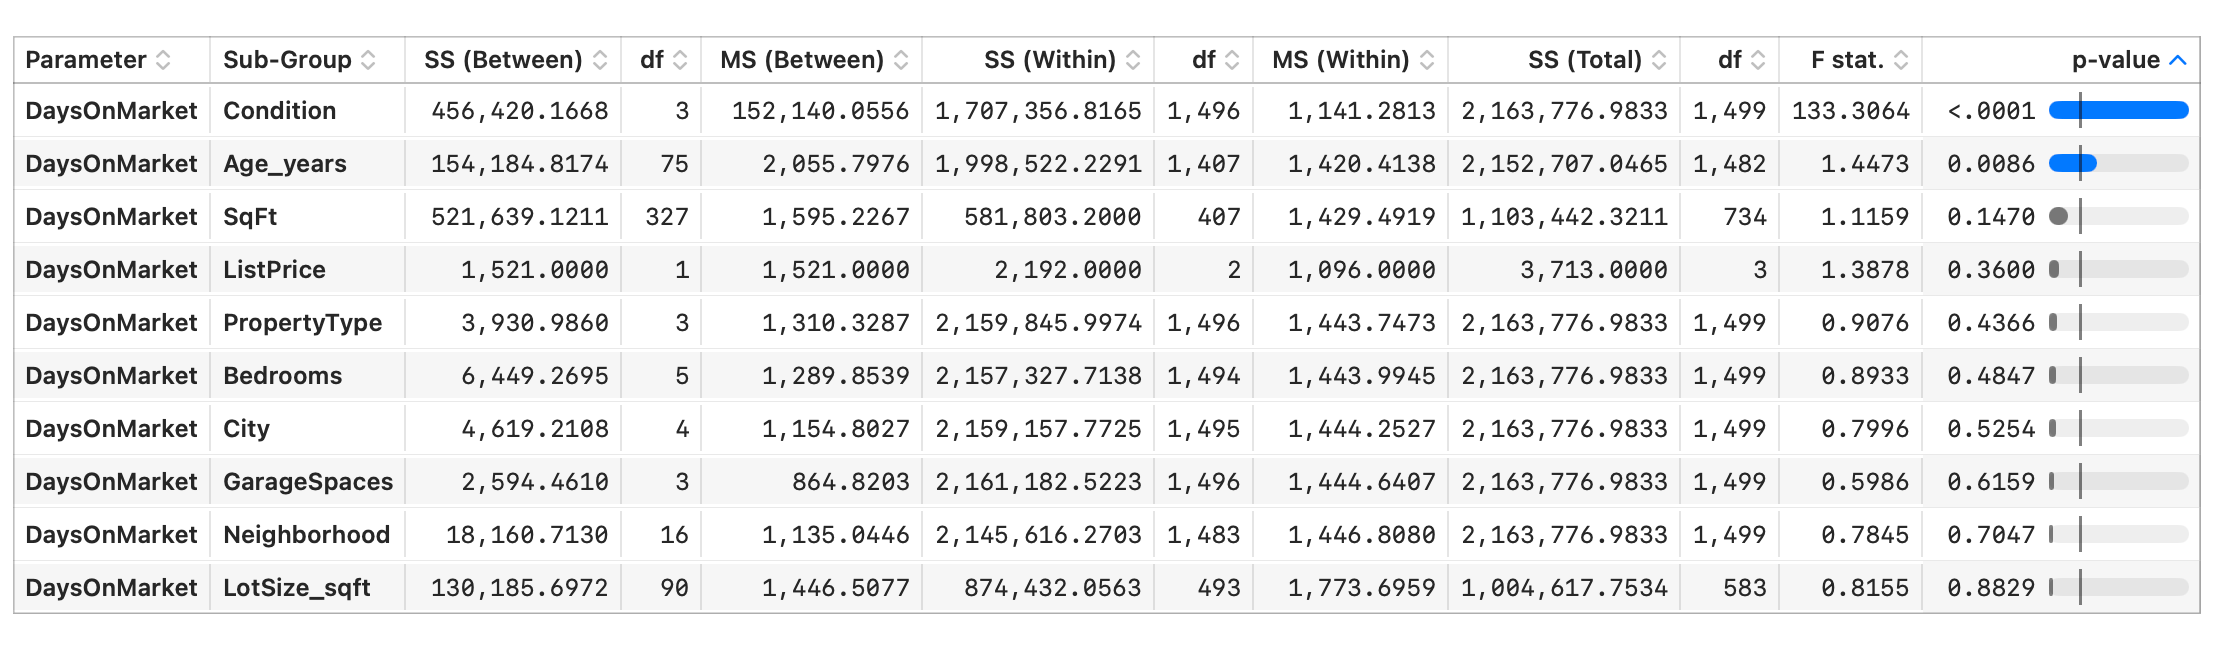
Stratum aims at the middle most analysts actually live in: more statistical power than a spreadsheet, far less friction than code, and none of the cost or bloat of the big suites. You get descriptive statistics, 30+ publication-quality charts, ANOVA with Tukey, regression with full diagnostics, correlation, chi-square, SPC control charts, and machine learning (PCA, clustering, decision trees, random forests, boosted trees) — point-and-click, offline, on datasets up to roughly five million rows, for a one-time price. If your field mandates a specific suite, use it; otherwise, for everyday analysis on Mac & Windows, a native app like Stratum is the fastest path from data to answer.
Download Stratum See all features →
Frequently asked questions
What is the best statistics software for Mac?
It depends on your work: Excel for quick arithmetic, R/Python if you code, the big suites (SPSS/SAS/JMP/Prism/Minitab) for niche or institutional needs, and a native app like Stratum for point-and-click stats, charts, and machine learning built for Mac & Windows at a one-time price.
What's a good alternative to SPSS, JMP, or Prism on Mac & Windows?
Native apps such as Stratum cover descriptive and inferential statistics, statistical charts, SPC, and machine learning with a native interface and no subscription — a good fit unless you specifically need those suites' specialized modules.
Can I do real statistics on Mac & Windows without coding?
Yes. A point-and-click app handles import, statistical charts, tests with diagnostics, and models from menus — no R or Python required.
Is free software like R or Python better than a paid stats app?
R and Python are free and unmatched in flexibility if you code. A paid point-and-click app trades that flexibility for speed and approachability — better when you want answers fast without writing code.
Does the software need an internet connection?
Not with a native app like Stratum — analysis runs entirely on your computer and your data never leaves it, which also matters for privacy.
How many rows can Mac statistics software handle?
Spreadsheets stall near a million rows. A native app like Stratum is built to stay responsive on datasets up to roughly five million rows.