 Stratum
Mean vs Median: Which Should You Report?
The mean and the median are both “the center” — but they can tell very different stories. Knowing when to trust each is one of the most useful habits in statistics.
The mean is the arithmetic average; the median is the middle value when the data is sorted. For roughly symmetric data they're nearly identical. For skewed data they part ways — and which one you report can change the headline.
Why they diverge
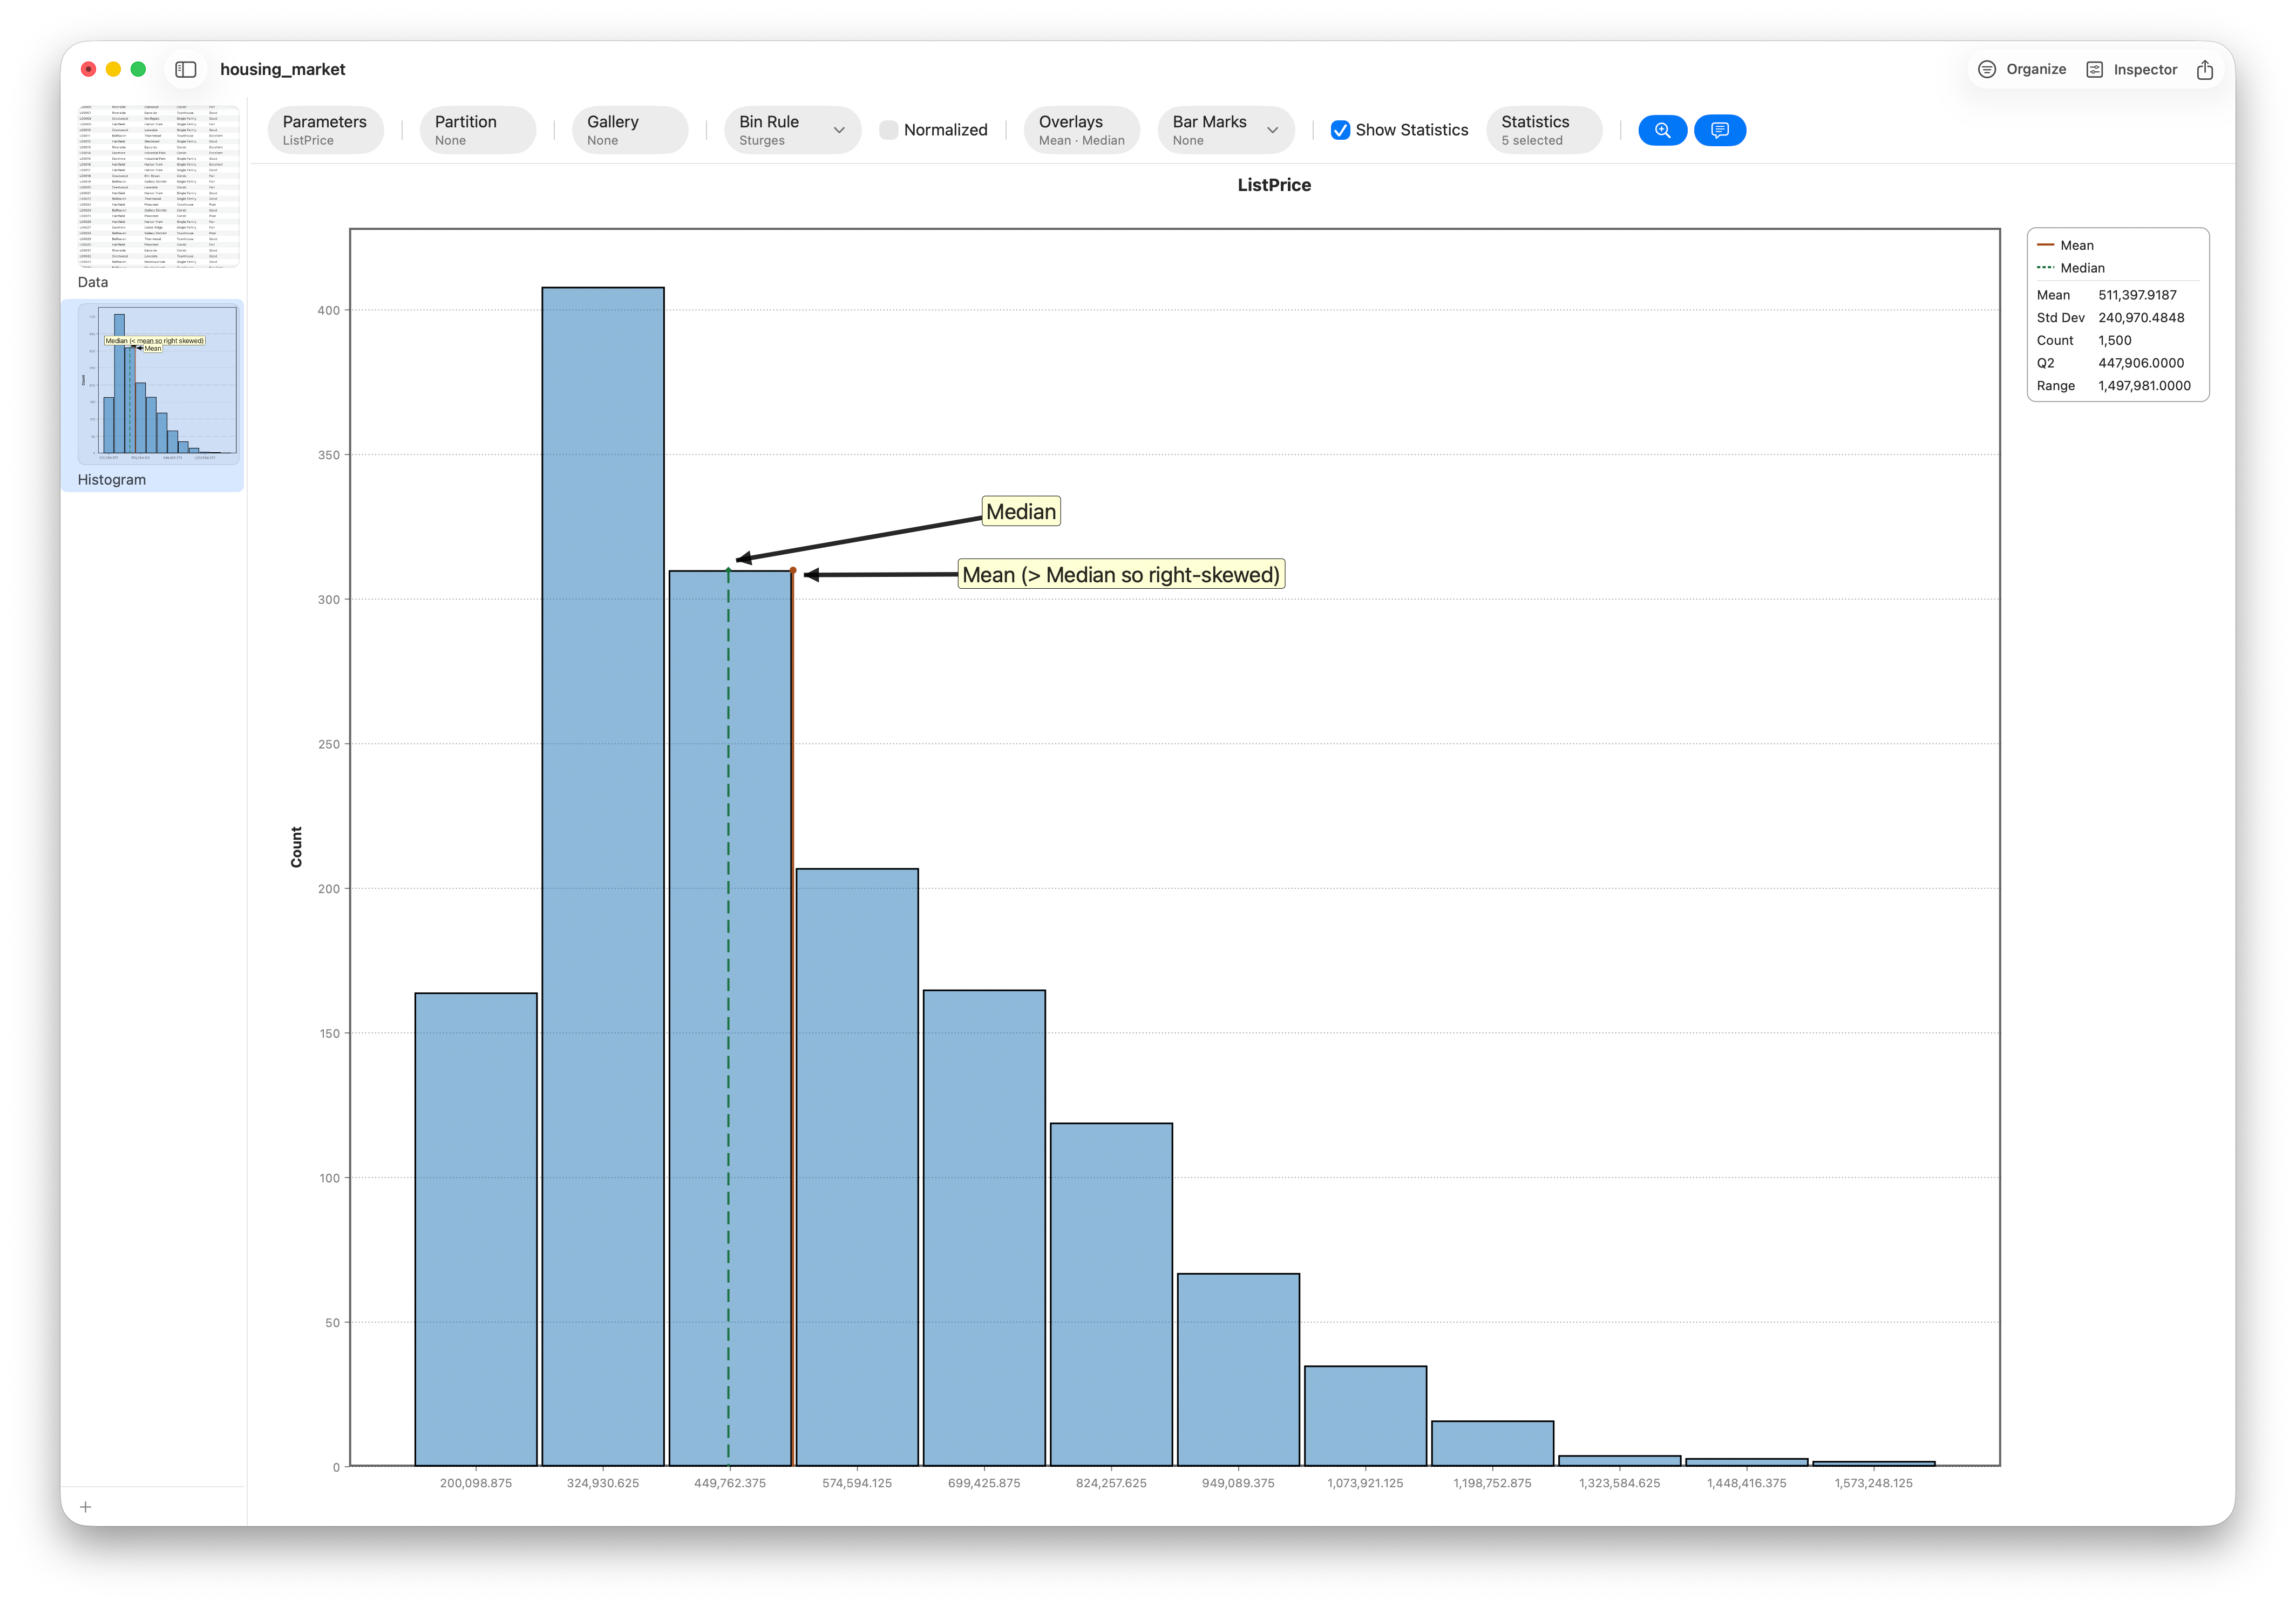
The mean is pulled toward extreme values; the median barely moves. Picture salaries at a small company where the founder earns ten times everyone else: the mean salary looks high, while the median reflects what a typical employee actually earns. The mean isn't wrong — it's just answering a different question.
A simple rule
- Symmetric data (roughly bell-shaped): report the mean — it uses all the data and feeds most statistical tests.
- Skewed data or outliers (incomes, prices, wait times): report the median — it resists the extremes and describes the typical case.
See it on your own data
Stratum's Summary report shows the mean and median side by side for every numeric column, and a histogram makes the skew that drives them obvious at a glance.
Frequently asked questions
When should I use the median instead of the mean?
Use the median when the data is skewed or has outliers — incomes, house prices, response times. It describes the typical value without being dragged by extremes.
Why are the mean and median different?
Because the mean is influenced by every value, including extreme ones, while the median only depends on the middle. The bigger the skew, the bigger the gap.
Which is better, the mean or the median?
Neither — they answer different questions. The mean is the average; the median is the typical case. For skewed data the median is usually the more honest summary; for symmetric data they agree.
Does a box plot show the mean or the median?
The line inside a box plot is the median. The mean isn't shown by default — read it from a summary report.