Statistical software for Mac · Native to Mac & Windows
Serious statistics on your Mac, bought once and yours for good — no subscription, no cloud, no notebook to set up first. Your .sav and .dta files open directly, so work you have already done comes with you, and five million rows stay smooth. Free to try on your own data before you decide.
Windows is cautious with apps from newer publishers. Stratum is code-signed — it’s safe; Windows just hasn’t built up its reputation yet.
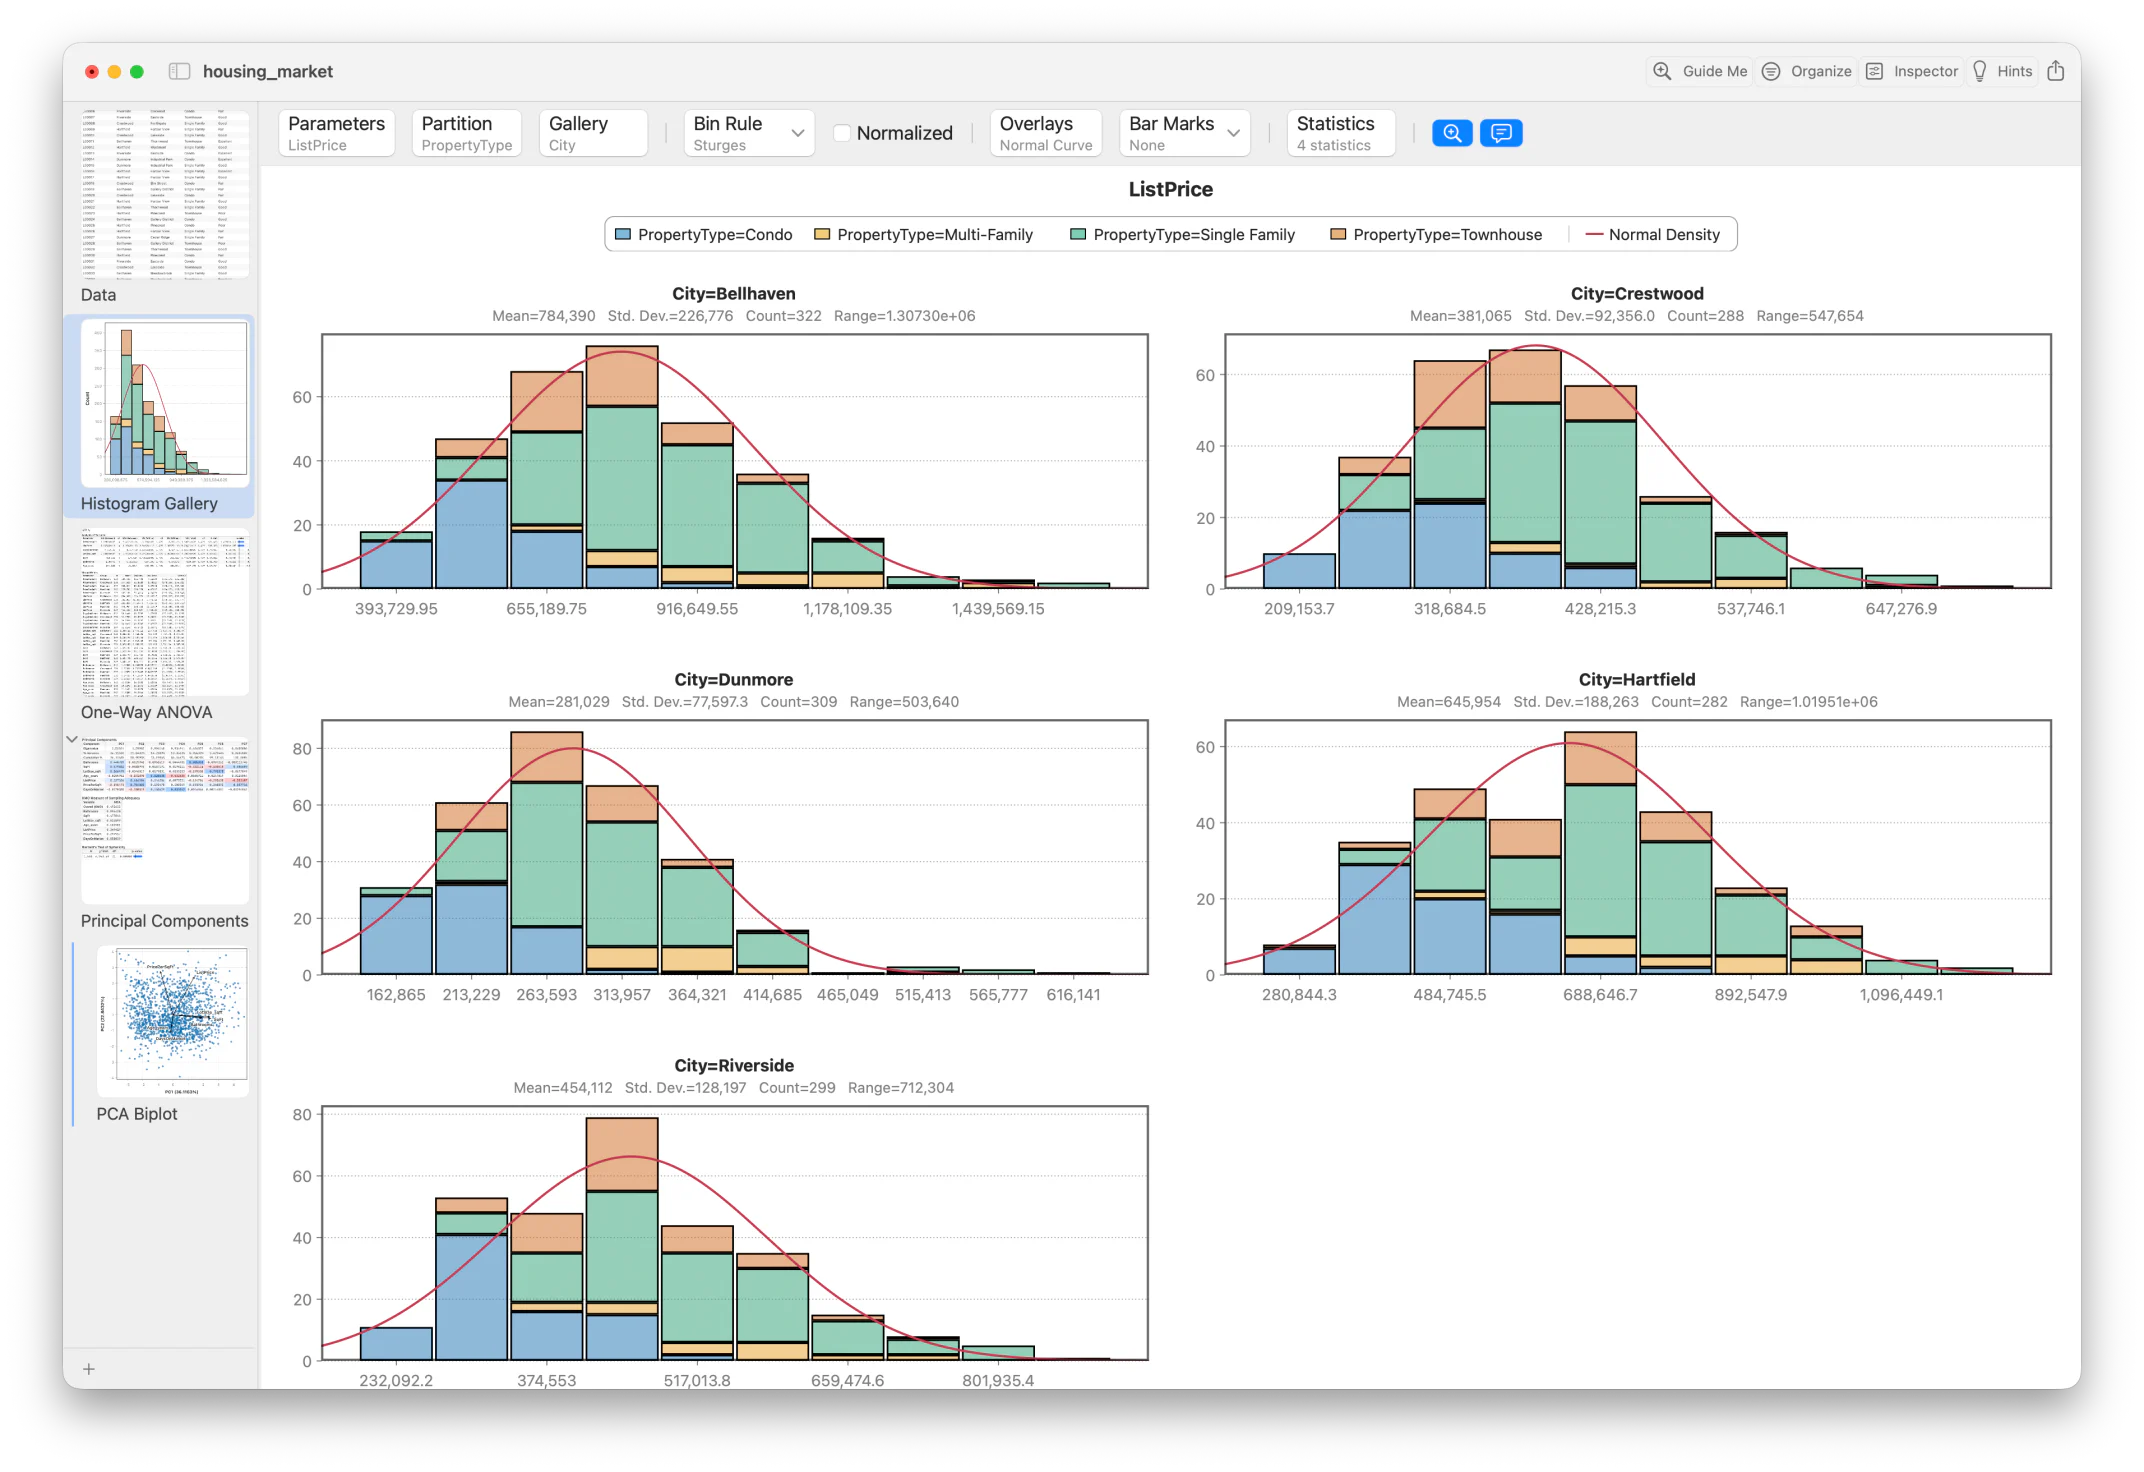
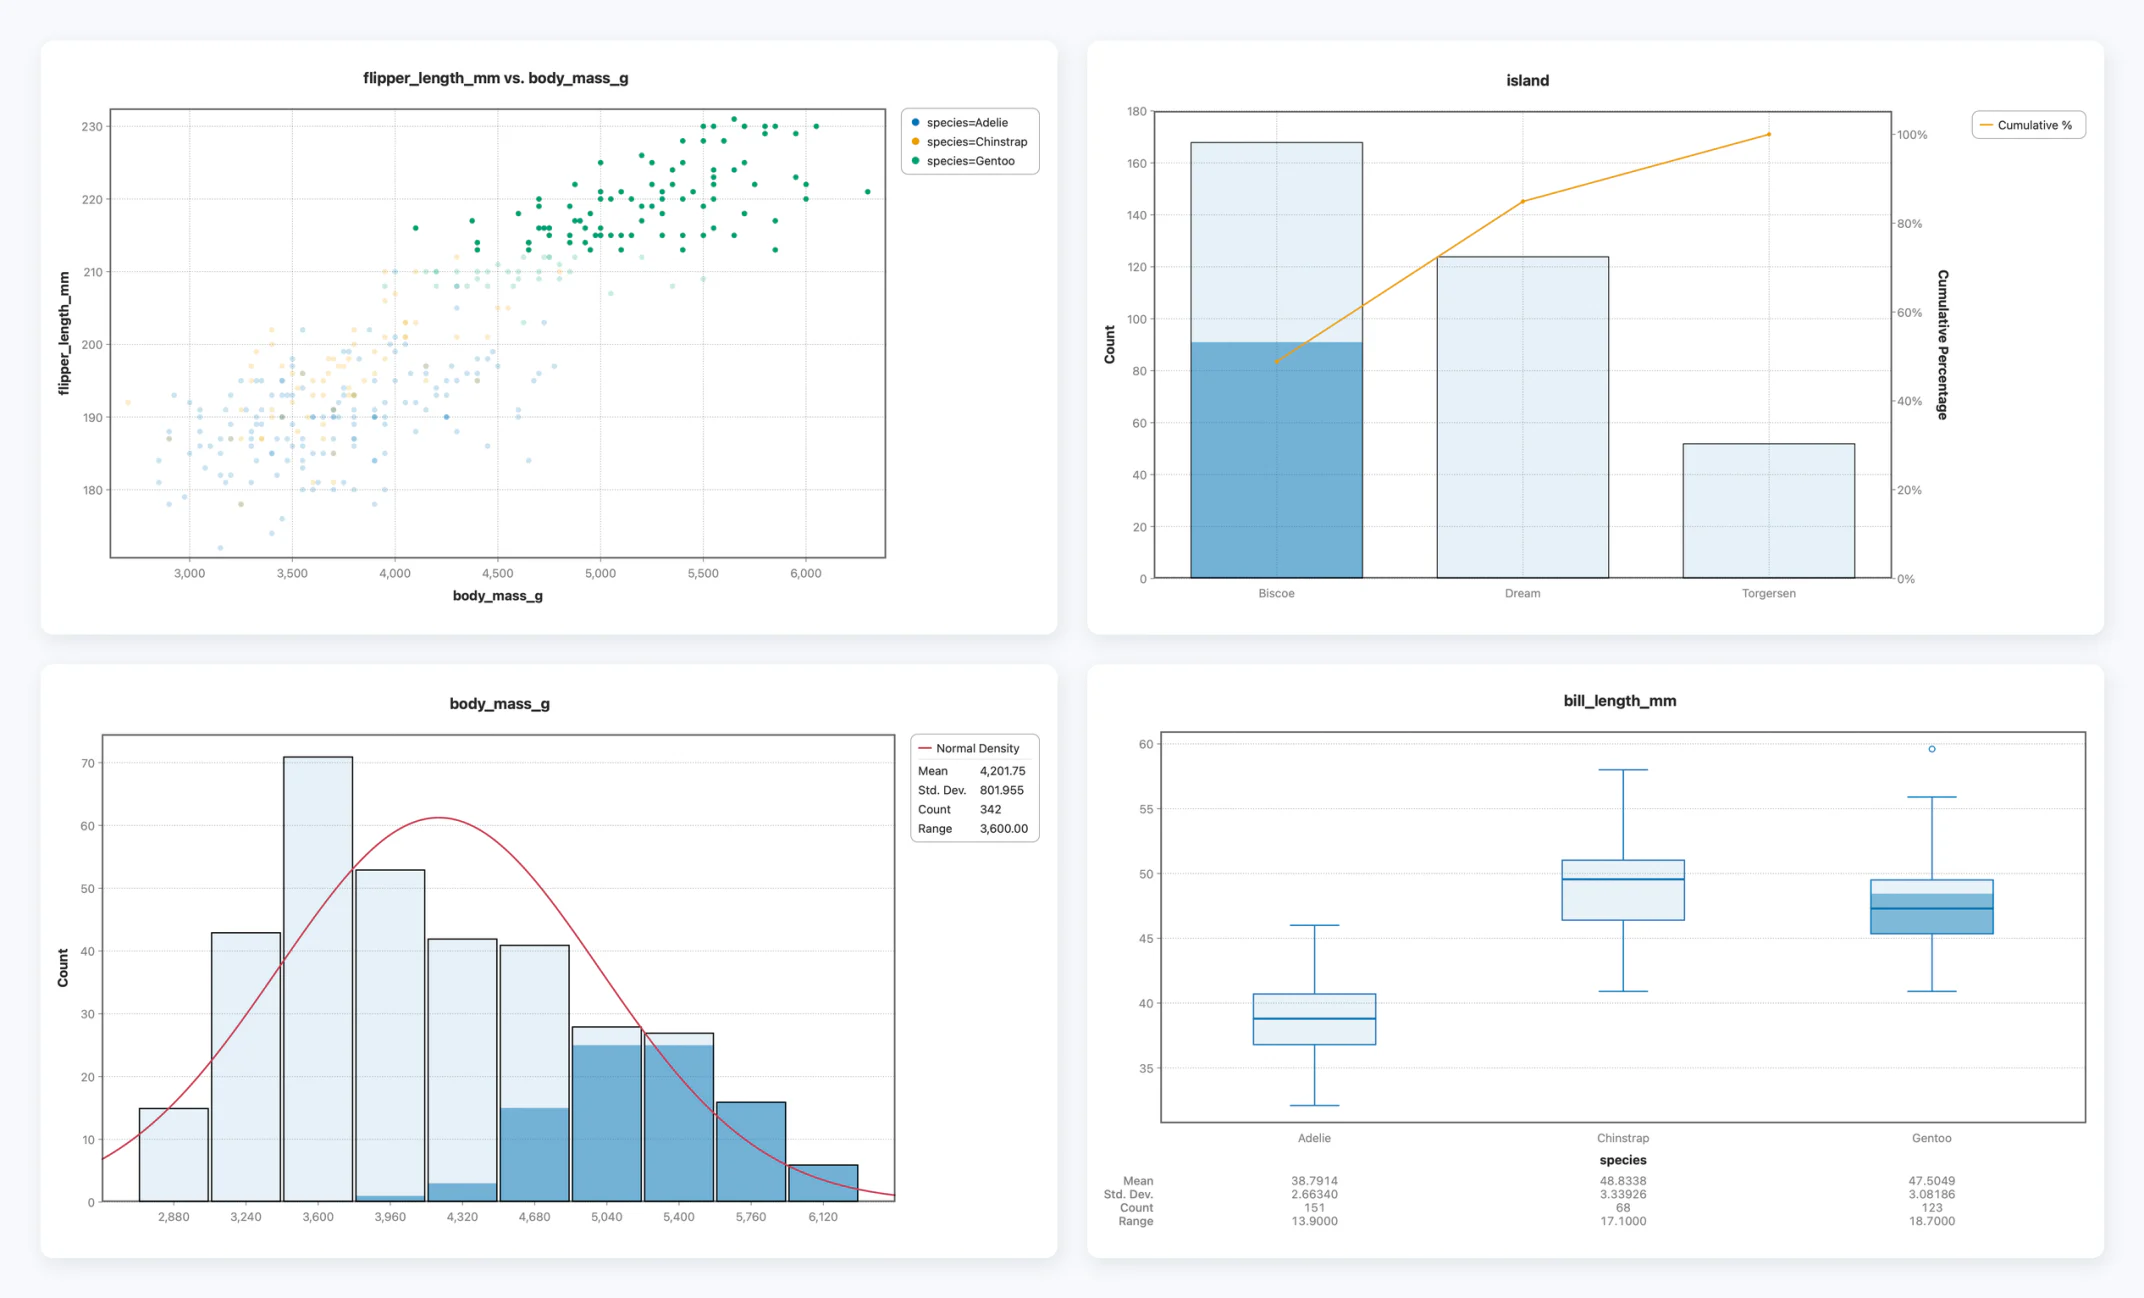
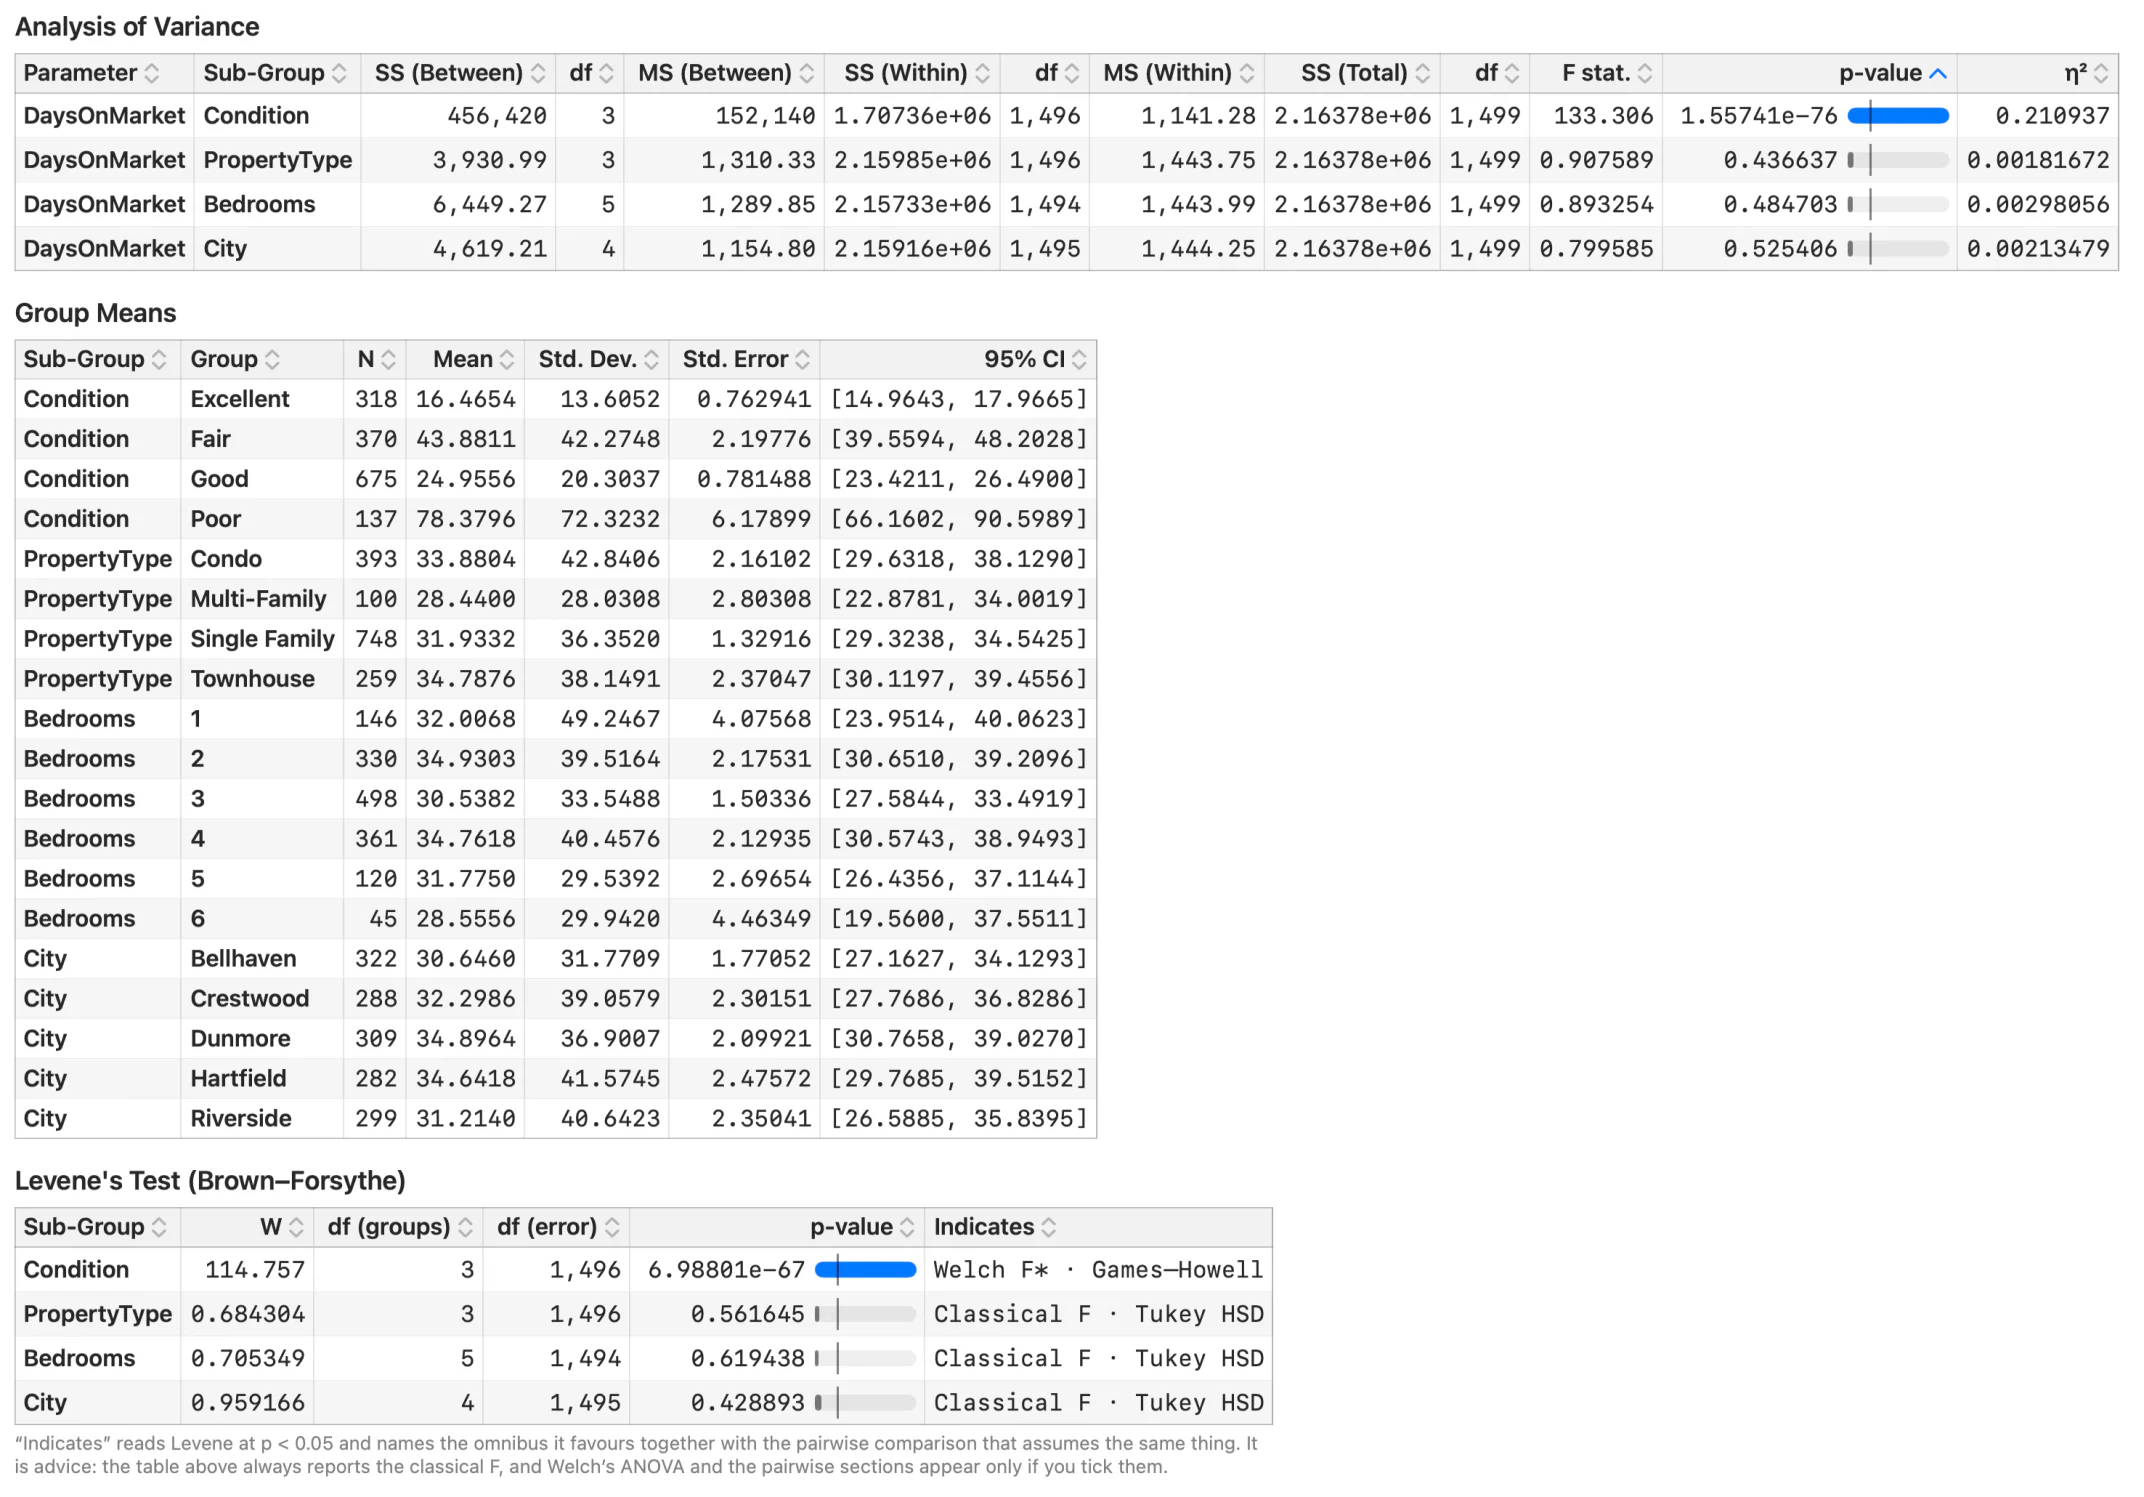
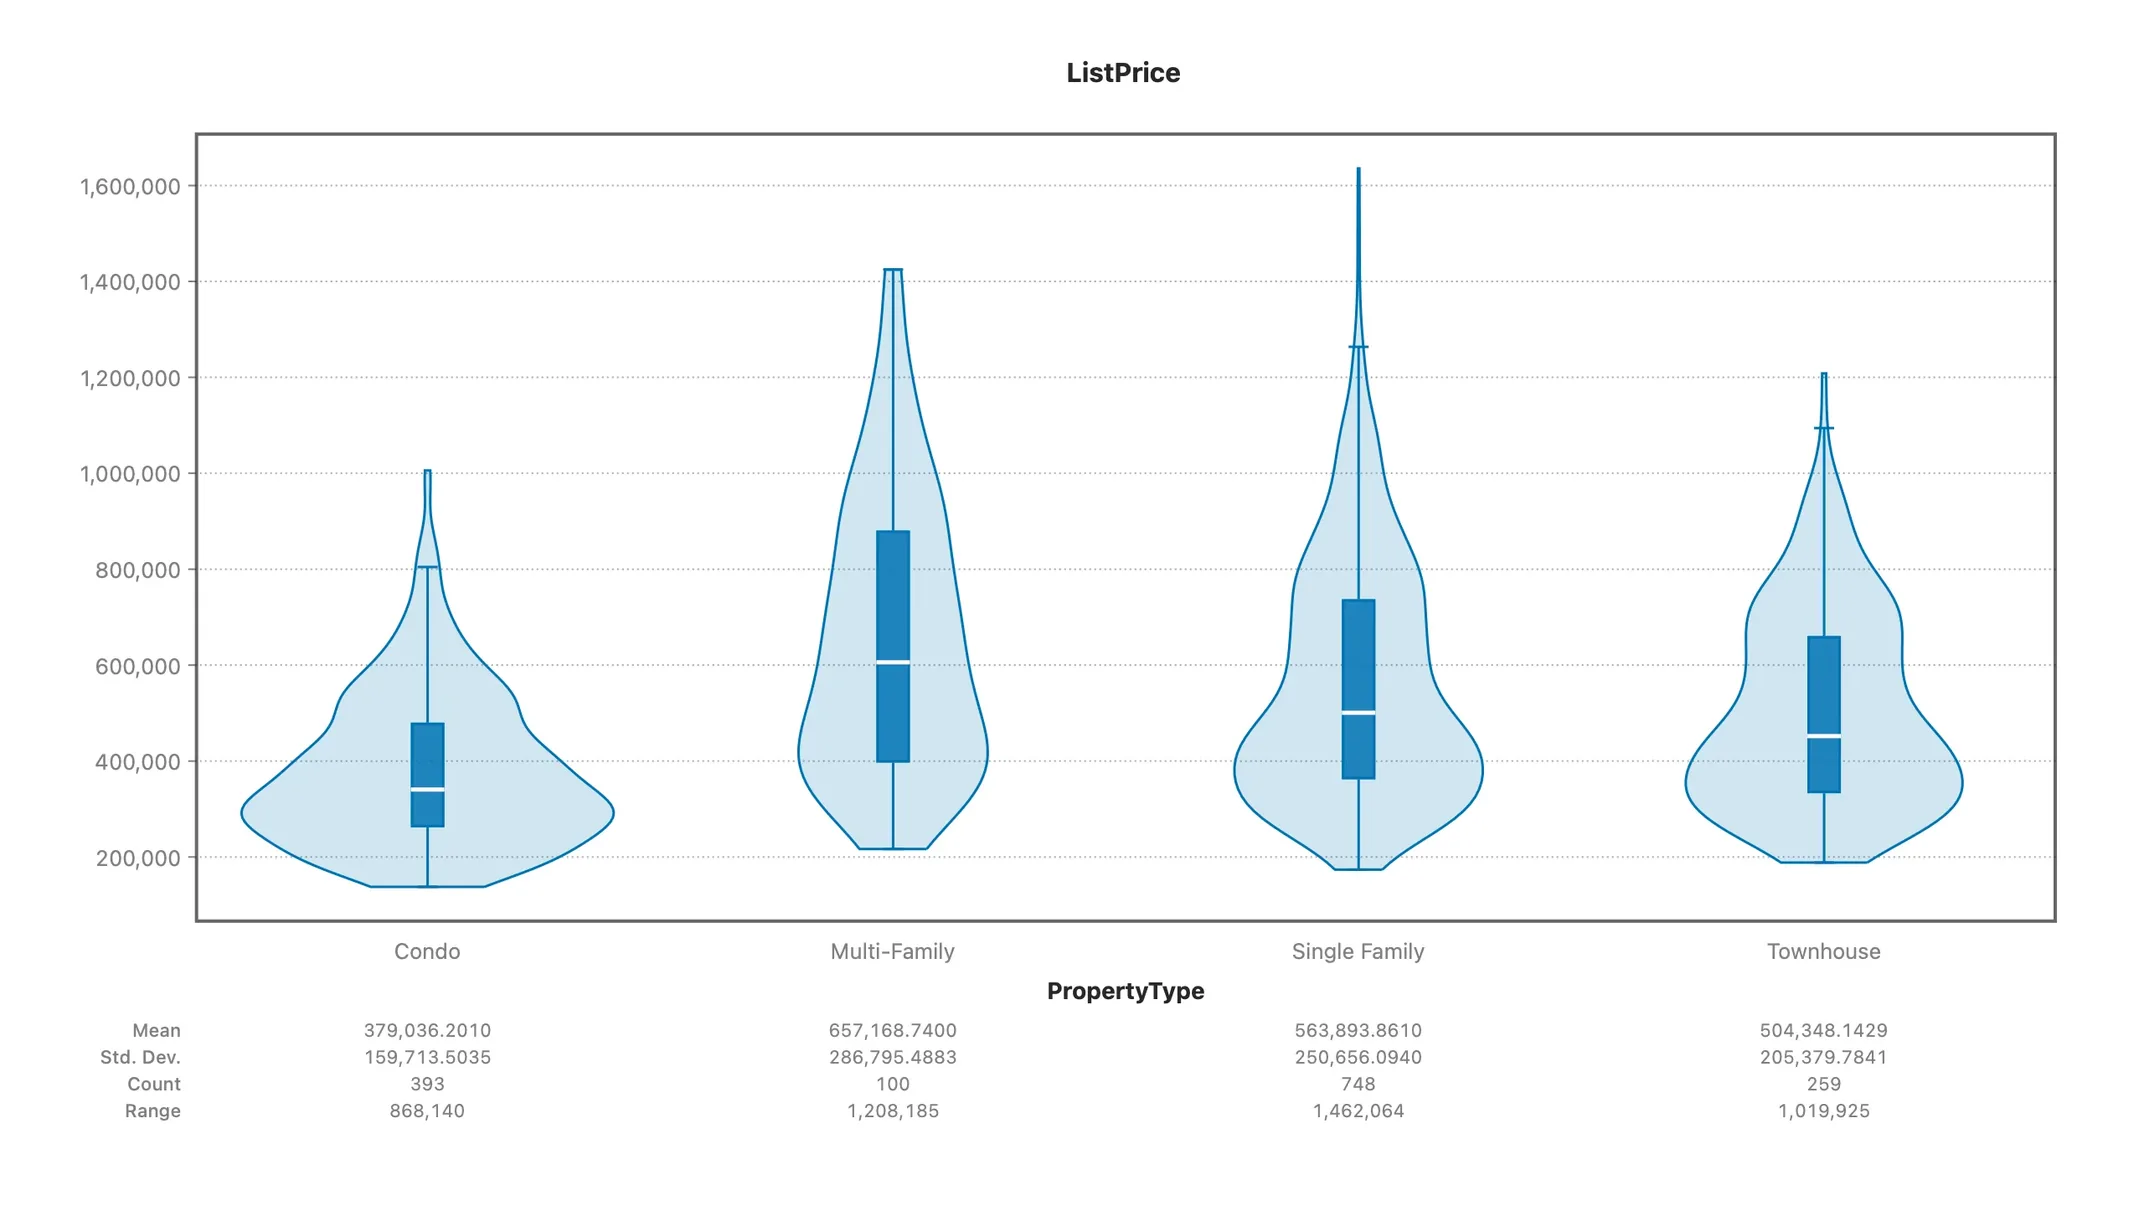
| Area | What's included |
|---|---|
| Import | CSV and delimited text, Excel, fixed-width ASCII, SPSS .sav and Stata .dta — up to ~5 million rows |
| Descriptive stats | Nearly 50 statistics per column — moments, quantiles, robust measures, confidence bounds — plus distributions, frequencies and contingency tables |
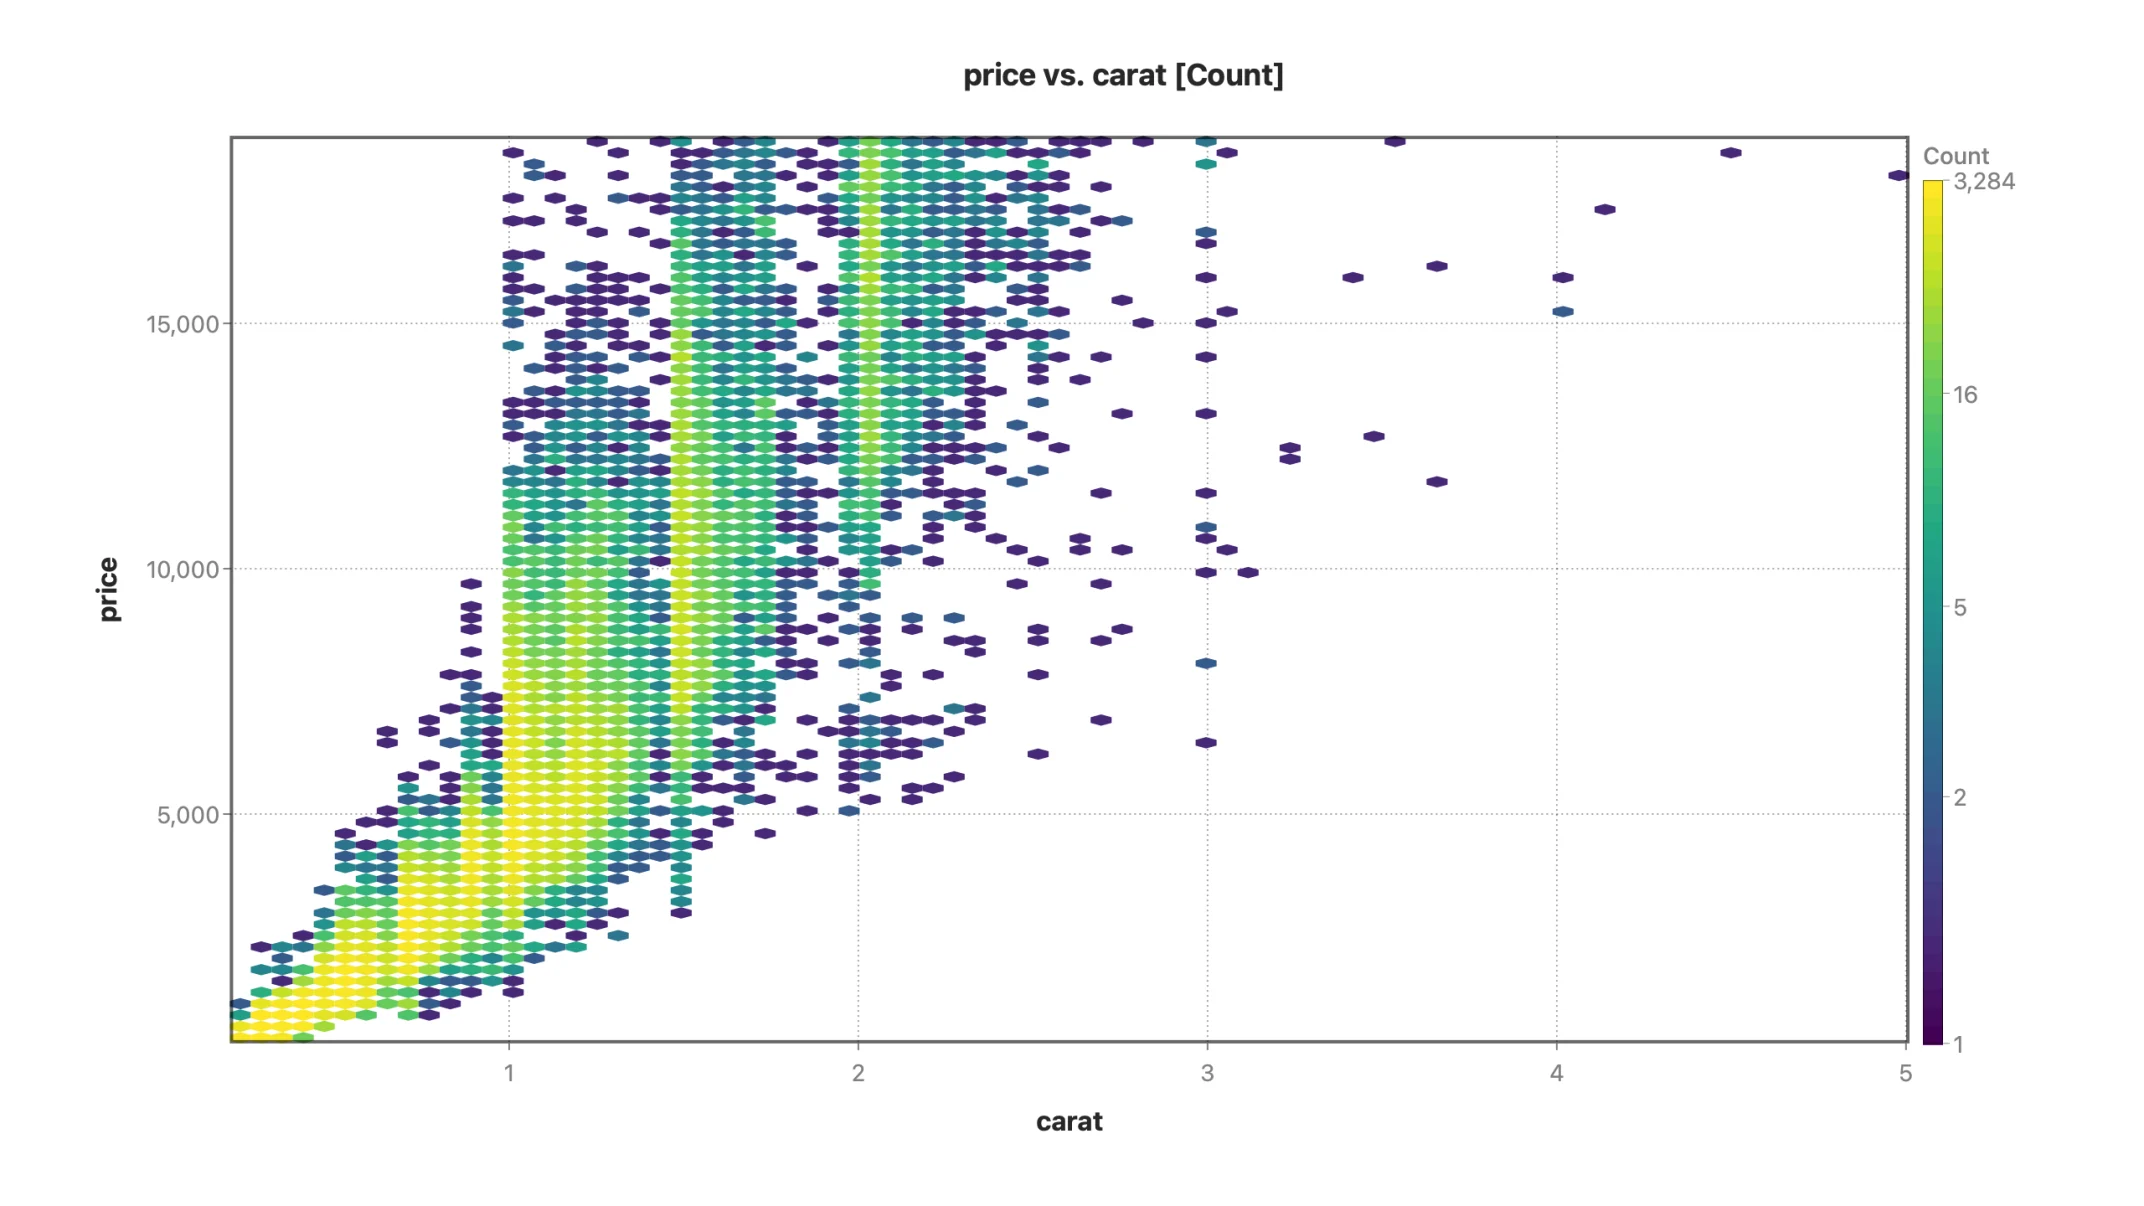
| Charts | 30+ modern statistical charts, zoom on every continuous axis, publication-quality export to PNG, PDF, TIFF and JPEG |
| Linked selection | One row selection shared by the datasheet and every chart — click or drag on one and the rest update, with aggregate marks shading to their selected share |
| Inferential tests | One- and two-sample t, paired t, one-way and factorial ANOVA with Type I/II/III sums of squares, Welch, Tukey HSD, Games-Howell, Kruskal-Wallis and Dunn, chi-square, Pearson/Spearman/Kendall correlation with Bonferroni or FDR correction |
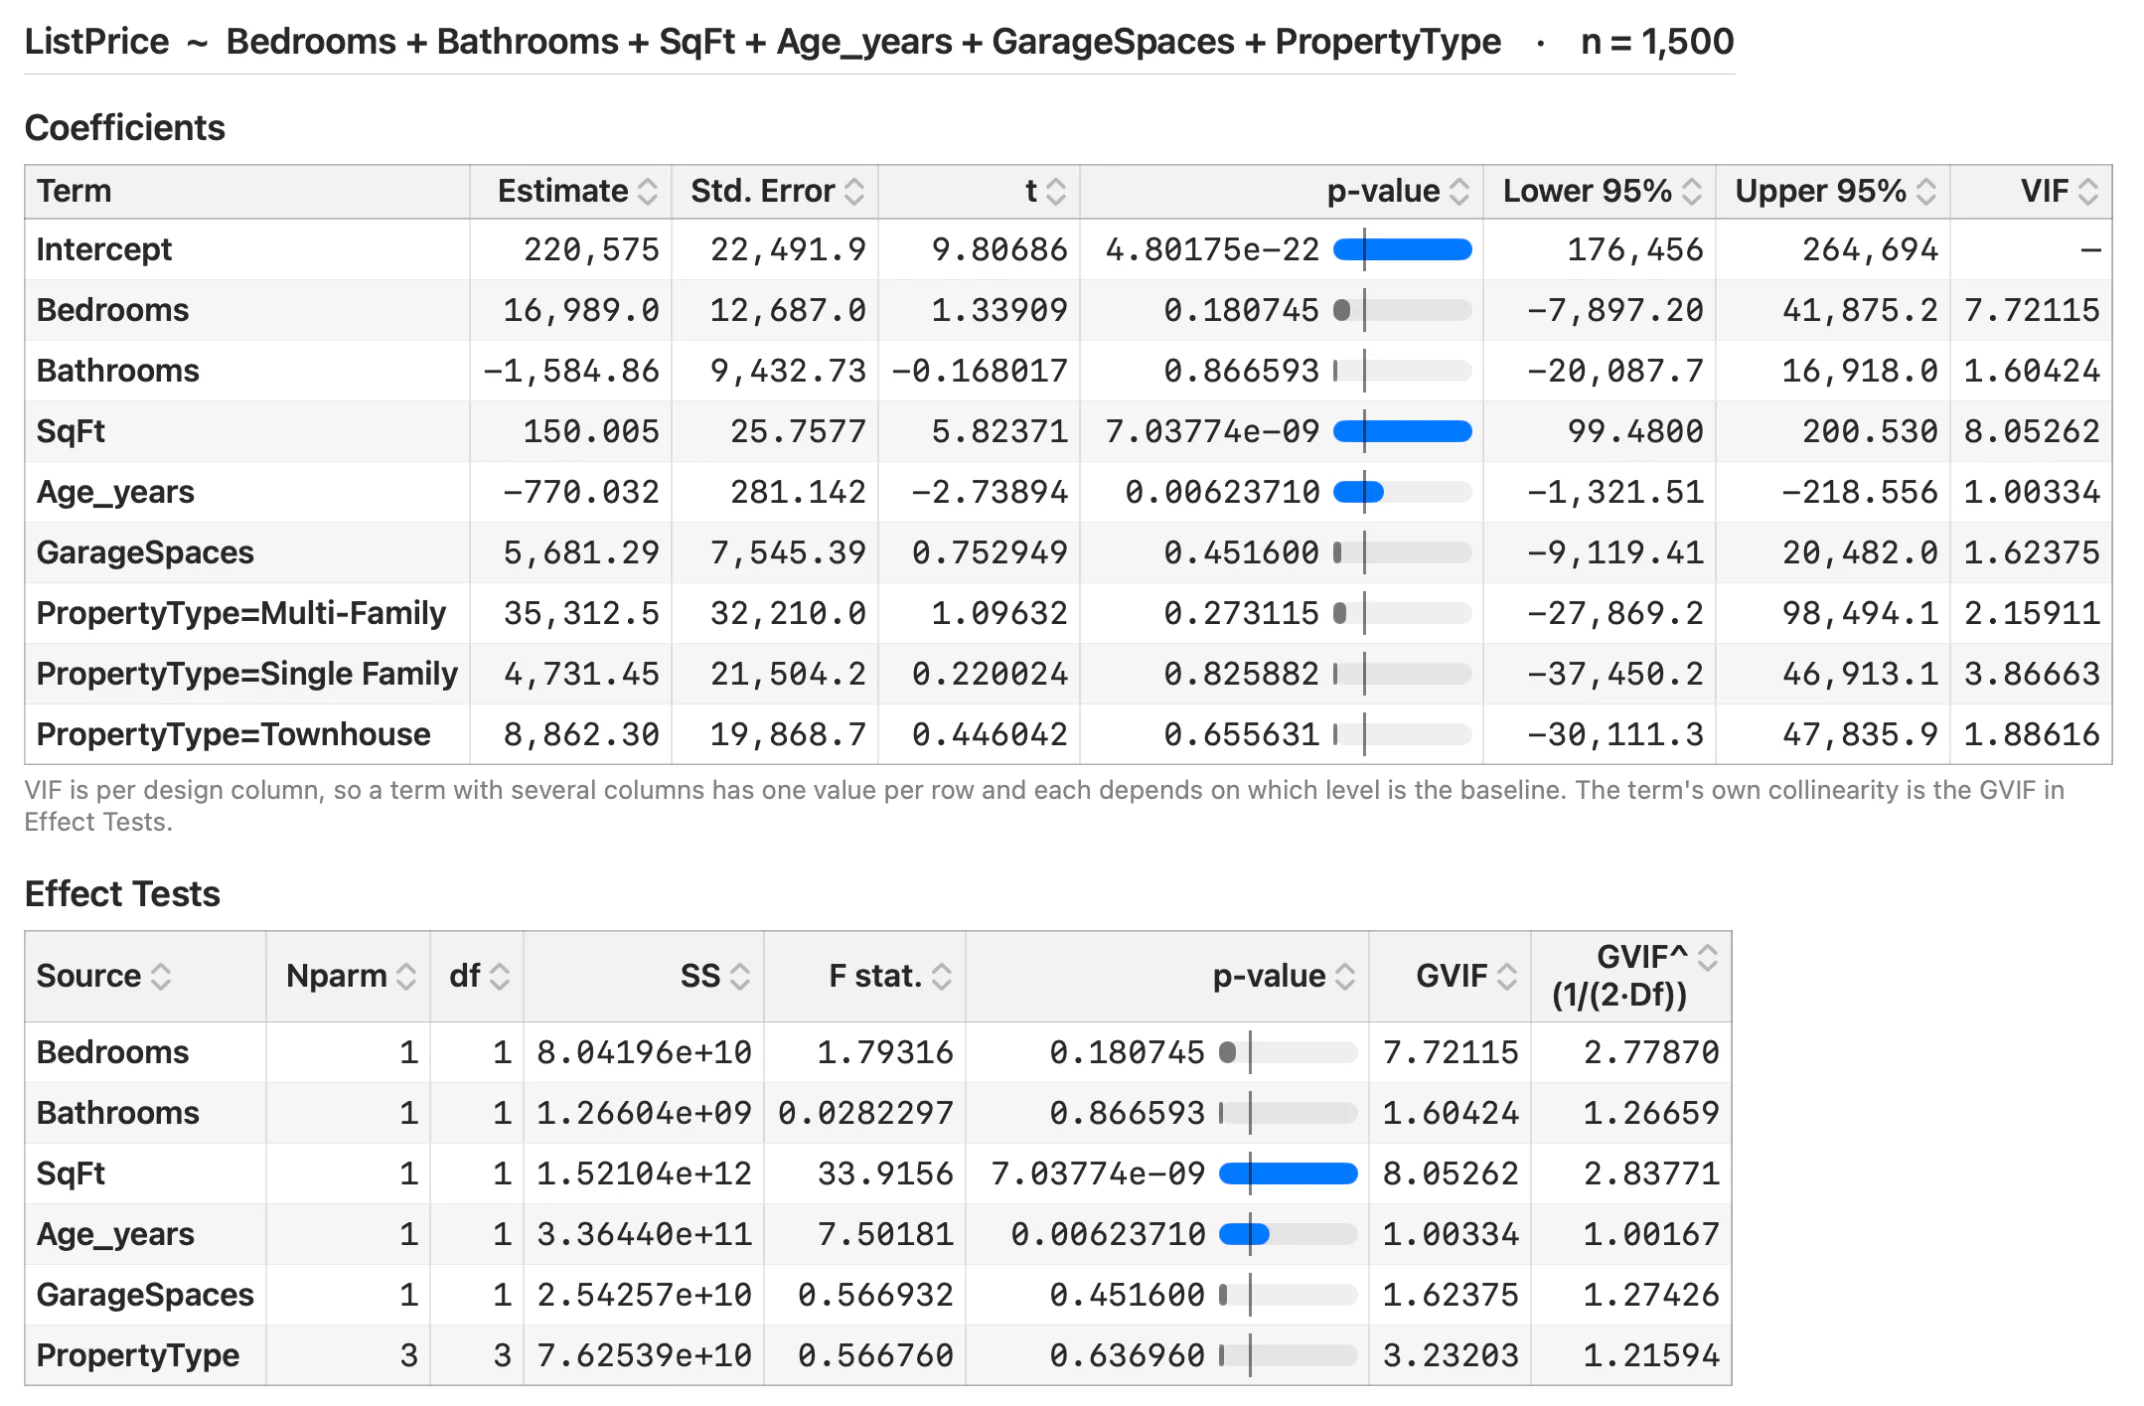
| Regression | Multiple regression with categorical, interaction and polynomial terms; VIF, Cook's D, leverage, Durbin-Watson, PRESS and predicted R²; confidence and prediction intervals; best-subsets search by Mallows' Cp, AIC, BIC or adjusted R² |
| Multivariate | PCA with KMO and Bartlett's test, MANOVA (Wilks', Pillai, Hotelling-Lawley, Roy), correspondence analysis (Professional) |
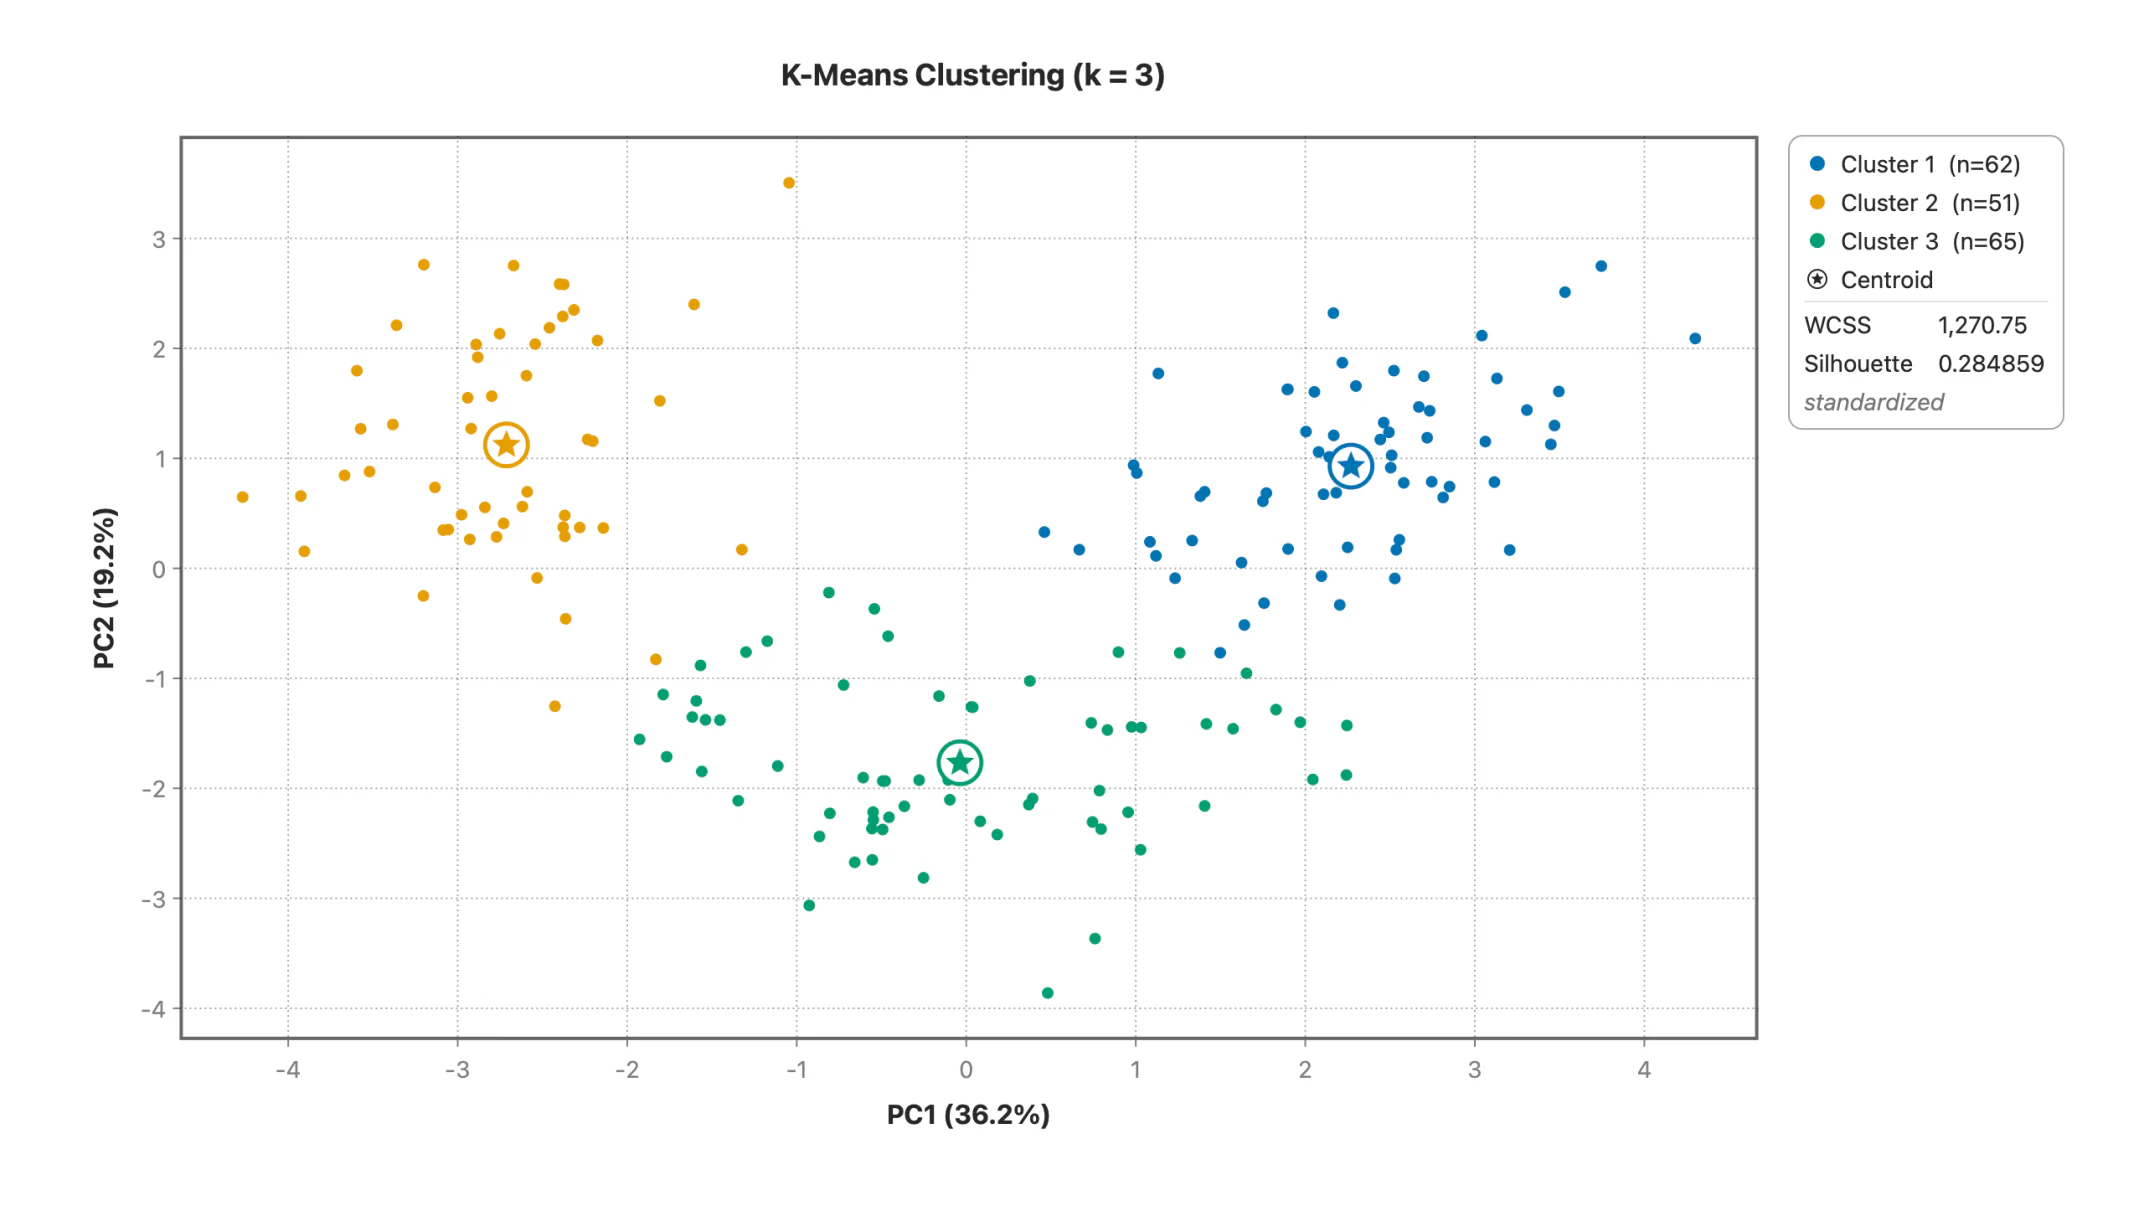
| Machine learning | Classification and regression trees with cross-validated pruning, random forests with out-of-bag error, boosted trees with early stopping, partial-dependence plots, k-means and hierarchical clustering, held-out validation and model comparison (Professional) |
| Quality (SPC) | Nine control charts with all eight Nelson rules and Phase I/II staging; capability with Cp, Cpk, Cpm, Pp, Ppk, PPM, Z-bench, confidence intervals and non-normal fits (Professional) |
| Data preparation | 114 formula functions across math, text, dates, binning and recoding, column aggregates and row windows |
| Numerical validation | Published validation record — the outside tool named for every statistic, plus all nine NIST StRD least-squares cases |
| Languages | English, German, Spanish, French, Italian, Japanese, Korean, Dutch, Portuguese (Brazil) and Simplified Chinese |
Most statistics tools are either cross-platform ports with dated interfaces, or notebooks and scripting environments that assume you want to code. Stratum is neither: it's a real Mac app (and a real Windows app) that opens instantly, imports your data, and lets you run serious analyses by pointing and clicking — with output clean enough to drop into a paper or a deck.
Excel. The Analysis ToolPak covers a handful of tests and stops. You end up with a sheet of formulas nobody can audit, charts that need an hour of formatting, and no diagnostics on the regression it just gave you. Stratum takes the same spreadsheet and returns the full report — coefficients with confidence intervals, VIF, leverage, Cook's D — without a single formula.
R or Python. The cost is setup and recall: environments, package versions, and remembering the incantation for a plot you last drew in March. Stratum runs the same analyses by pointing and clicking, so an answer takes minutes whether or not you opened it last week.
A subscription package. SPSS, Minitab and JMP all bill annually, with parts of the toolkit priced as add-ons. Stratum is bought once, with regression and its full diagnostics in Standard. See how it compares with SPSS, Minitab and JMP.
Yes — it's a native macOS app (macOS 14 or later), and a native Windows app (Windows 10/11, 64-bit).
No. Stratum is a point-and-click app; there's nothing to script and no environment to set up.
Up to roughly 5 million rows, imported from CSV or Excel.
Import CSV, TSV and Excel workbooks, with delimiters and column types detected for you. Export reports and charts to PDF, PNG, CSV, Markdown or HTML — charts at print resolution. SPSS .sav and Stata .dta files open directly, so work you have already done comes with you.
No. Your analysis runs entirely on your machine: your data is never uploaded to a server or the cloud, and there is no telemetry on your datasets. The app itself does check your license periodically and look for updates, and neither request carries any of your data. Between those checks it keeps working offline for up to a week.
A license activates on two computers, and the version you buy keeps working — there is no renewal date. The two can be any mix — a Mac and a Windows PC on the same license, with the same key.
 Stratum