Decision tree software · Mac & Windows
Walk someone through the model, not just the score. The tree is drawn rather than described, variable importance is ranked so you can say which fields carried it, and pruning is cost-complexity with k-fold cross-validation. Native on Mac and Windows, bought once. Free to try on your own data before you decide.
Most data-mining and analytics suites are sold as an annual subscription — often quoted only after a sales call. Whatever the number turns out to be, it returns every year, and access stops when you stop paying.
Five years, five bills — and no software left if you stop.
Bought once. The version you buy keeps working forever, online or off, on Mac and Windows alike.
$249 for Professional — once, and it’s yours.
| Capability | In Stratum |
|---|---|
| Classification trees | Categorical outcomes, with split criteria and class counts at the leaves |
| Regression trees | Numeric outcomes, with predicted value and node size at the leaves |
| Split criteria | Gini or entropy for classification, variance reduction for regression |
| Growth control | Maximum depth, minimum node size, minimum improvement, maximum branches per split |
| Pruning | Cost-complexity pruning chosen by k-fold cross-validation, at the minimum-error tree or the one-standard-error tree |
| Variable importance | Ranked across the fitted model, and across the ensemble |
| Random forests | Tree count, predictors per split (mtry), sample fraction and seed, with out-of-bag error, an OOB error curve and an OOB confusion matrix |
| Boosted trees | Learning rate, subsample fraction and tree depth, with training and validation curves and early stopping |
| Reading the ensemble | Partial-dependence plots per predictor, so a forest is not left as a black box |
| Classifier diagnostics | Confusion matrix, misclassification rate and test AUC on held-out rows |
| Held-out validation | Seeded training / validation / test splits, optionally stratified, with model comparison on the same partition |
| Linked selection | Click a node in the diagram to select the rows that reach it — in the datasheet and in every other chart |
| Tree diagram | Drawn, zoomable, exportable to PNG or PDF at print resolution |
| Numerical validation | Published validation record — the outside tool named for every statistic, including the gaps |
| Pricing | One-time (Professional $249) — no subscription |
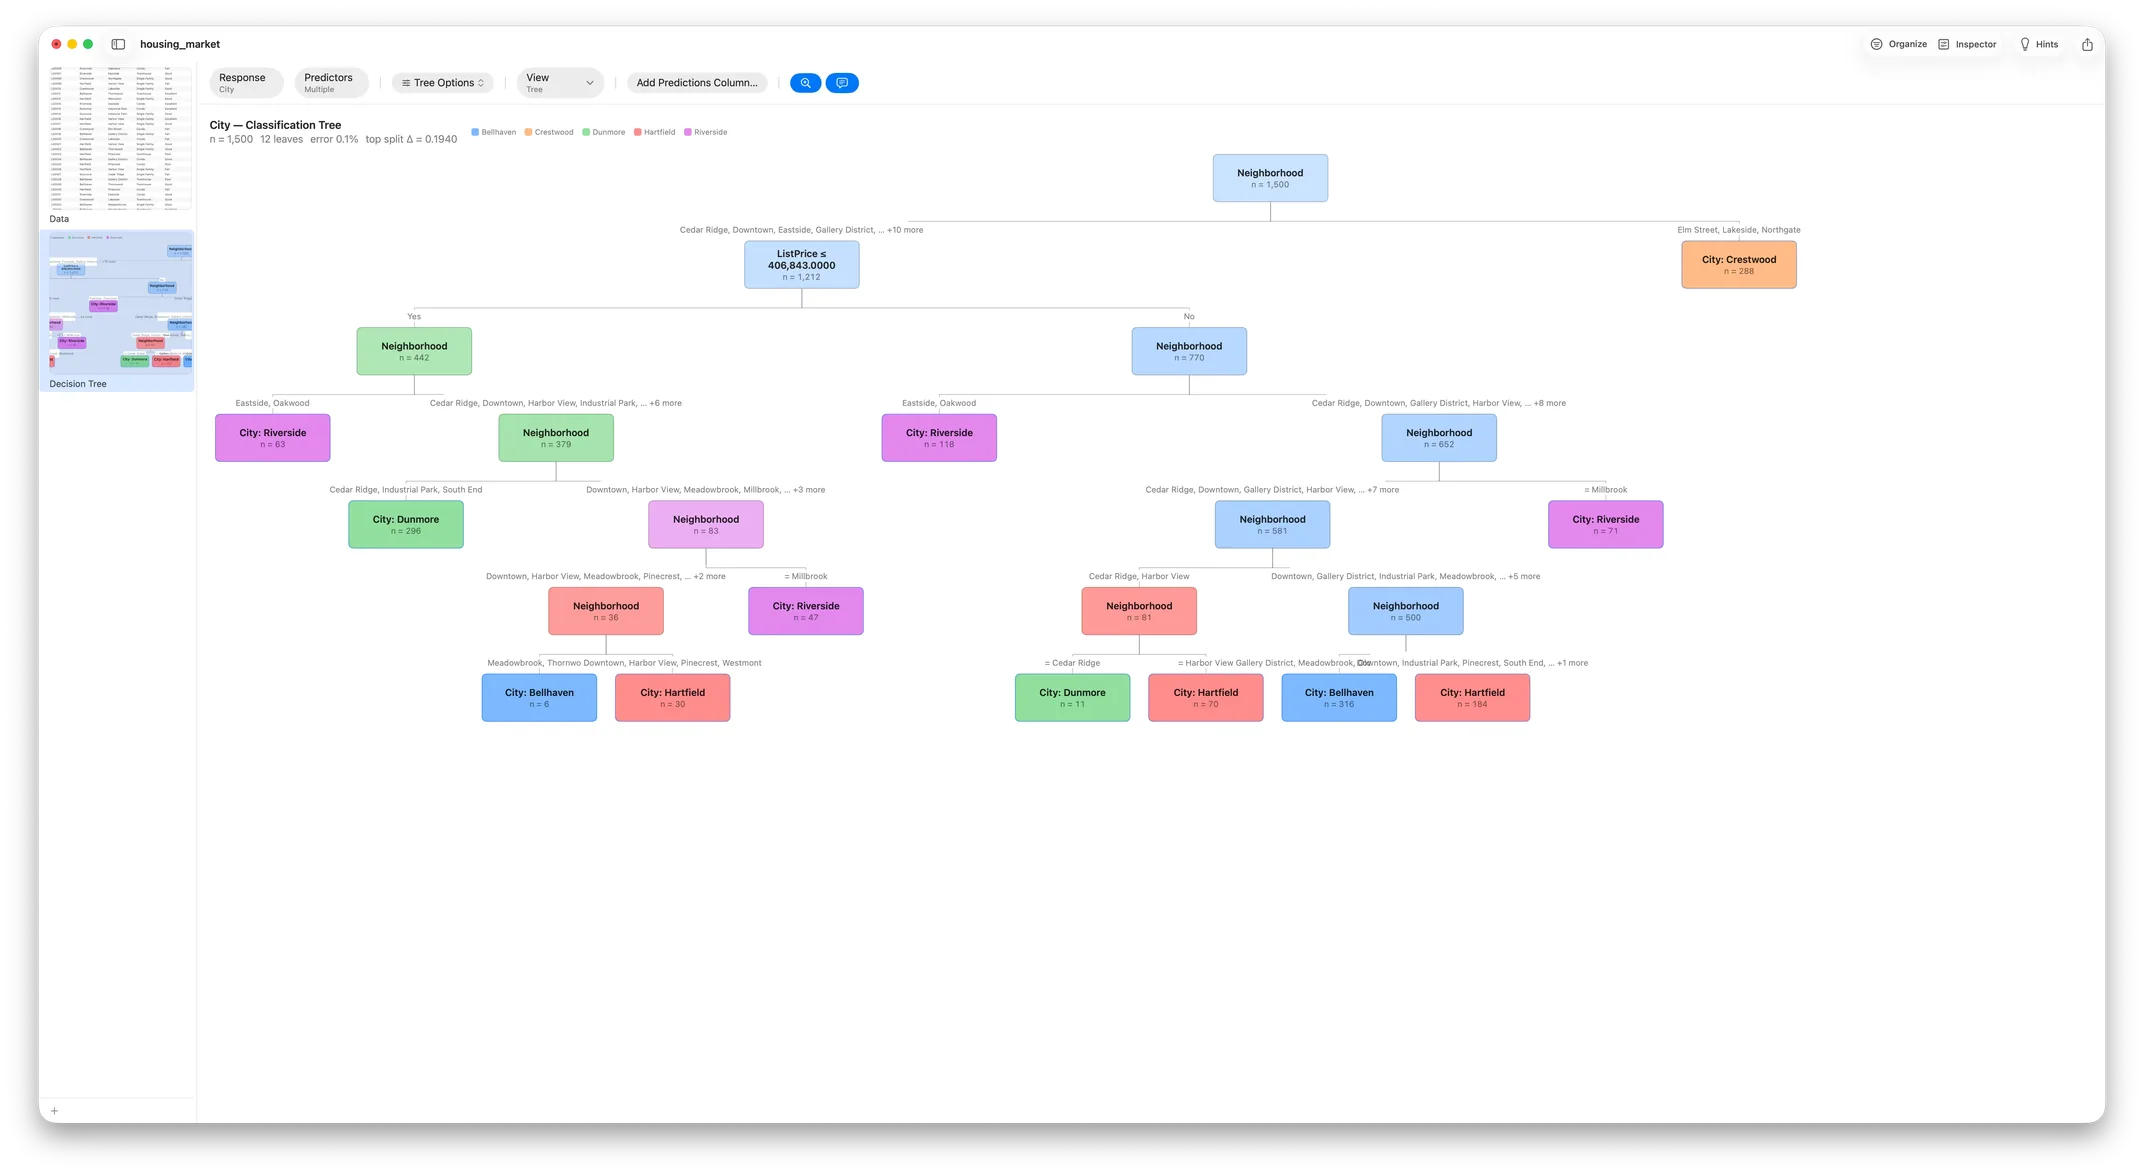
Classification Tree — a tree for a categorical outcome, with the split criterion named at every node rather than hidden in the fit.
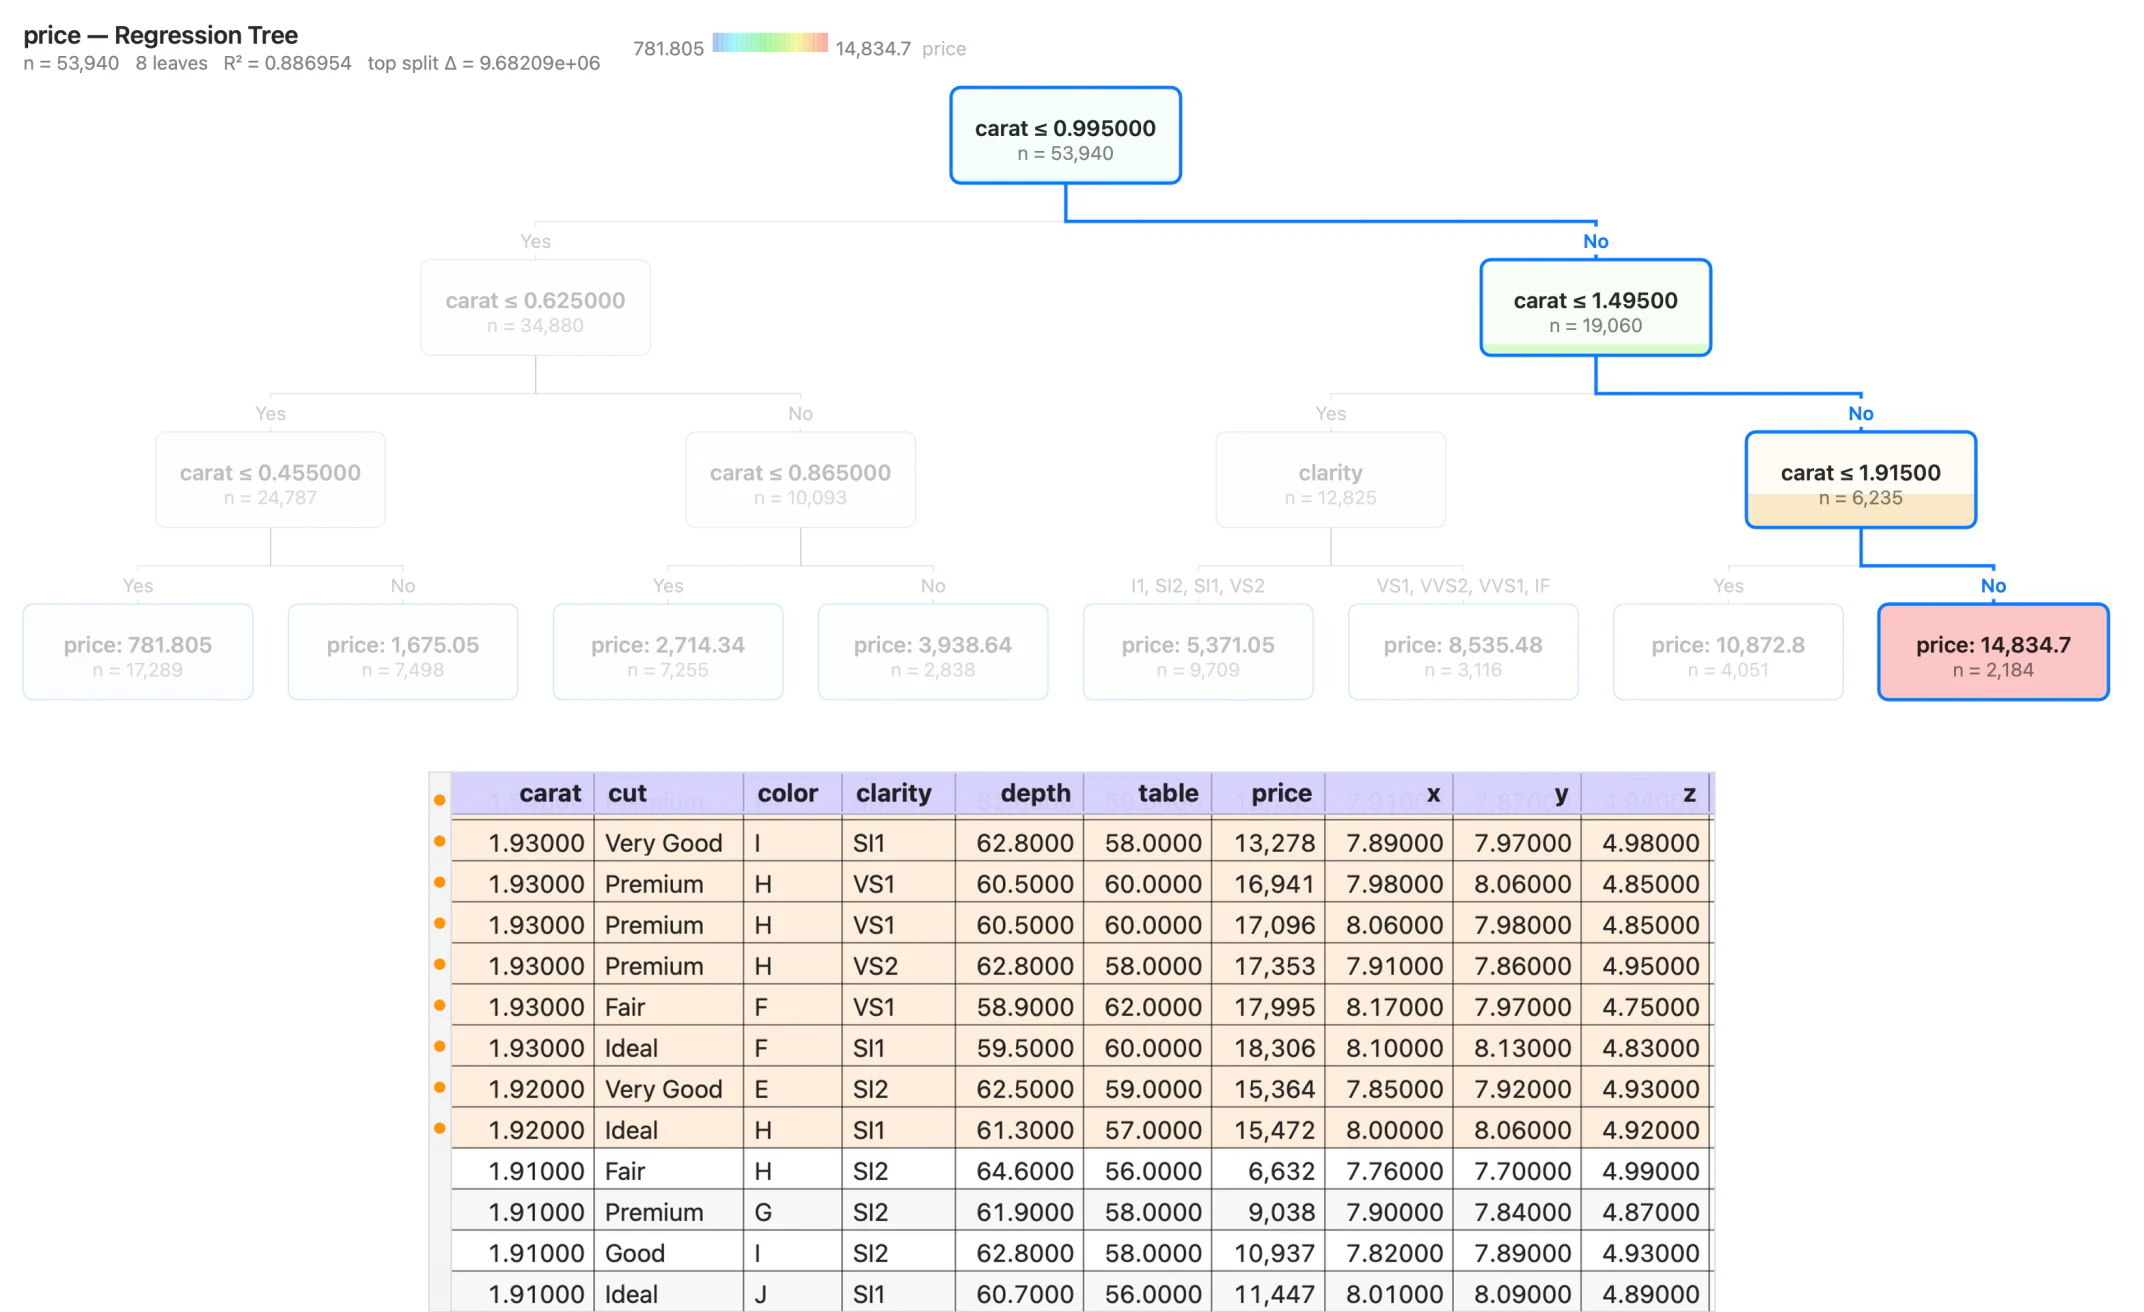
Regression Tree — the same method for a numeric response, with the predicted value and group size at each leaf.
Depth & node size — maximum depth, minimum node size, minimum improvement and branches per split, so the tree is as simple as you can defend.
Cross-validated pruning — cost-complexity pruning with k-fold cross-validation, stopping either at the minimum-error tree or at the one-standard-error tree, which is the smaller tree statistically indistinguishable from it.
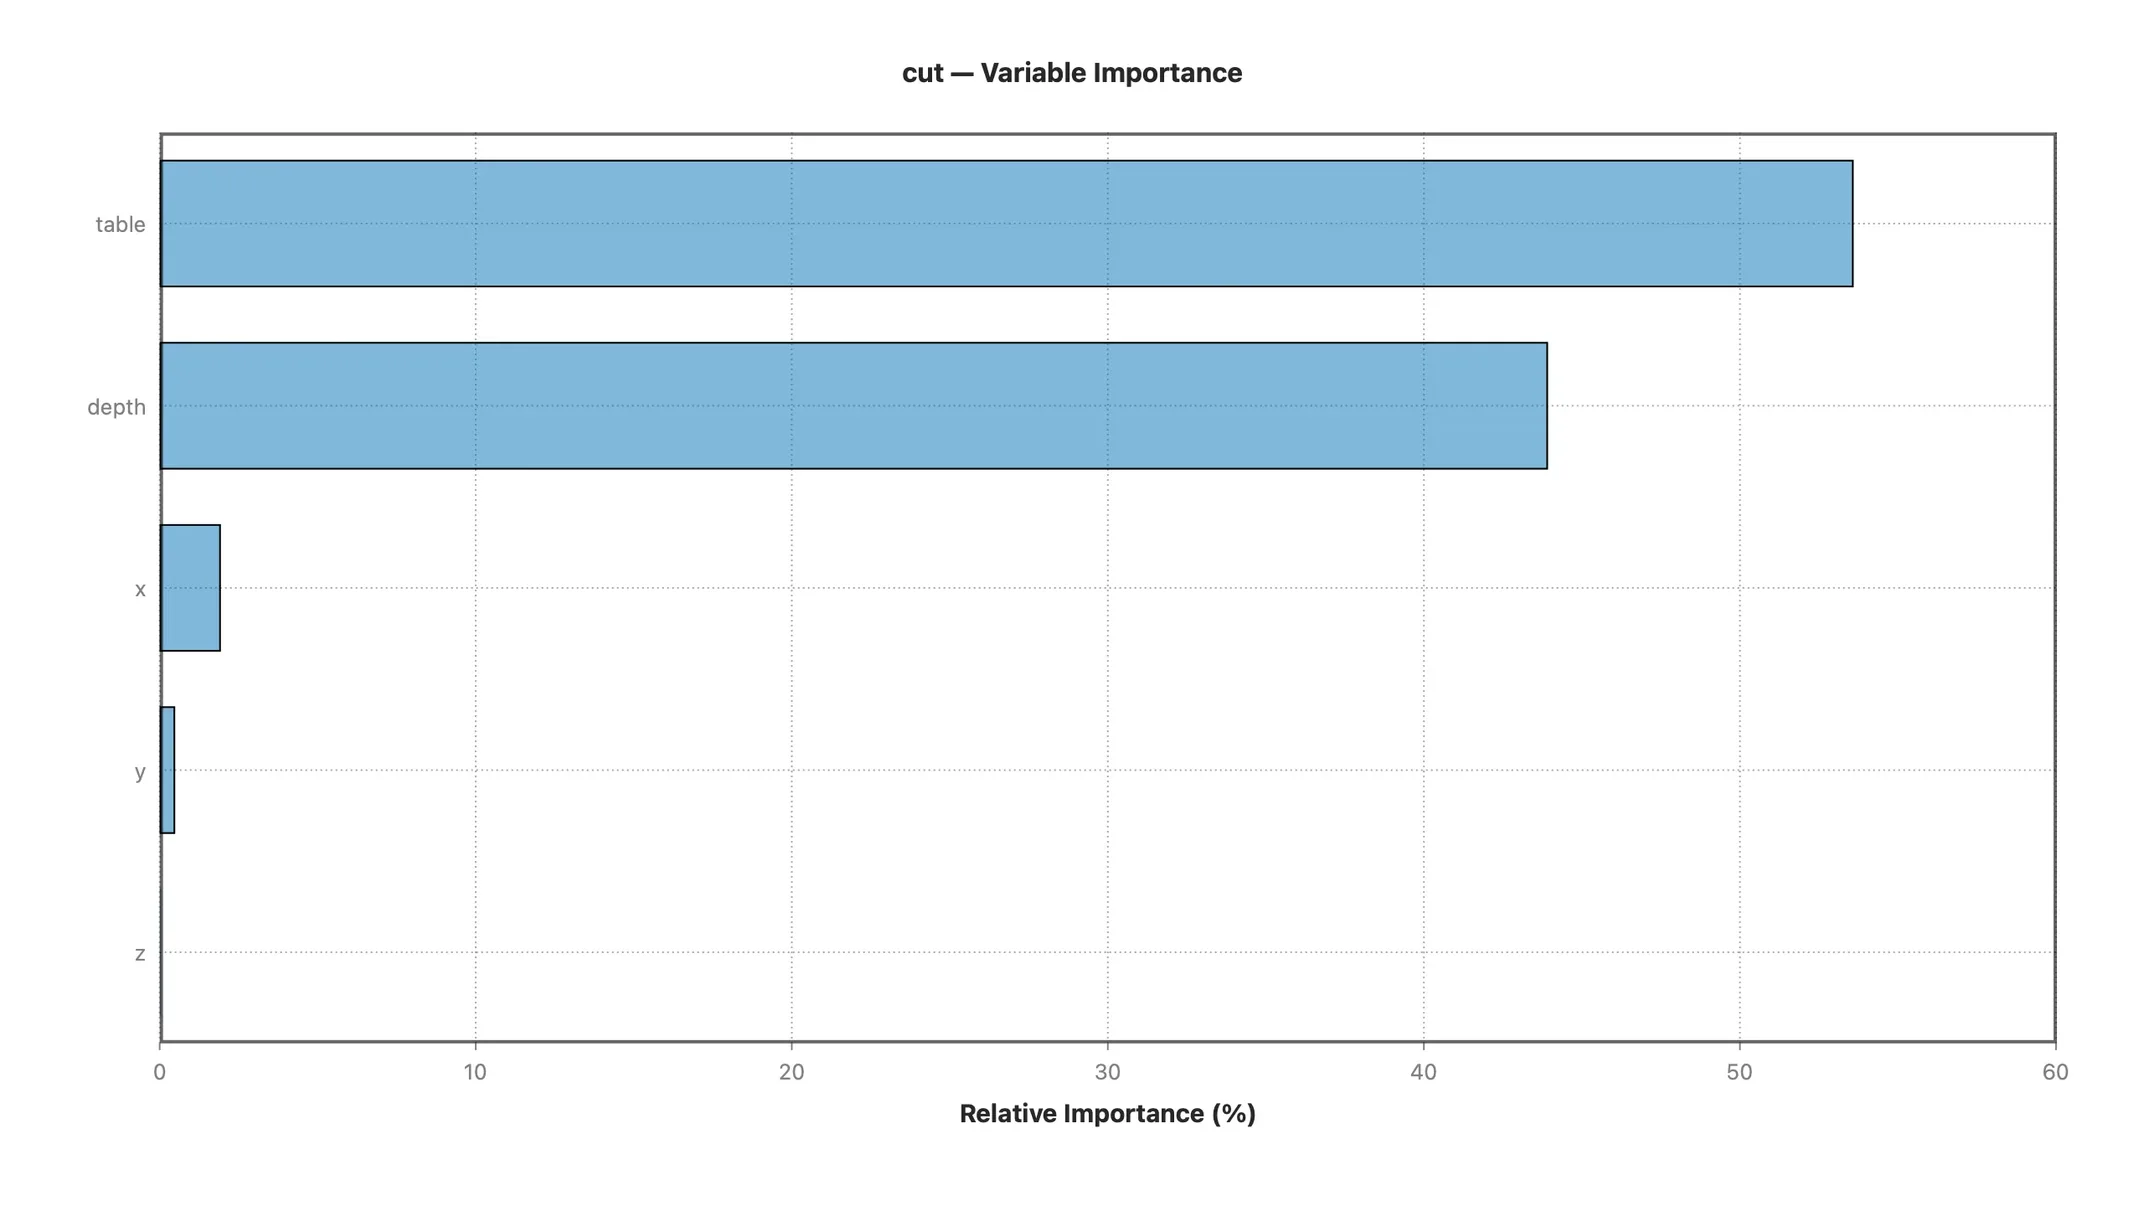
Variable importance — ranked, so you get a model you can explain to someone who did not fit it.
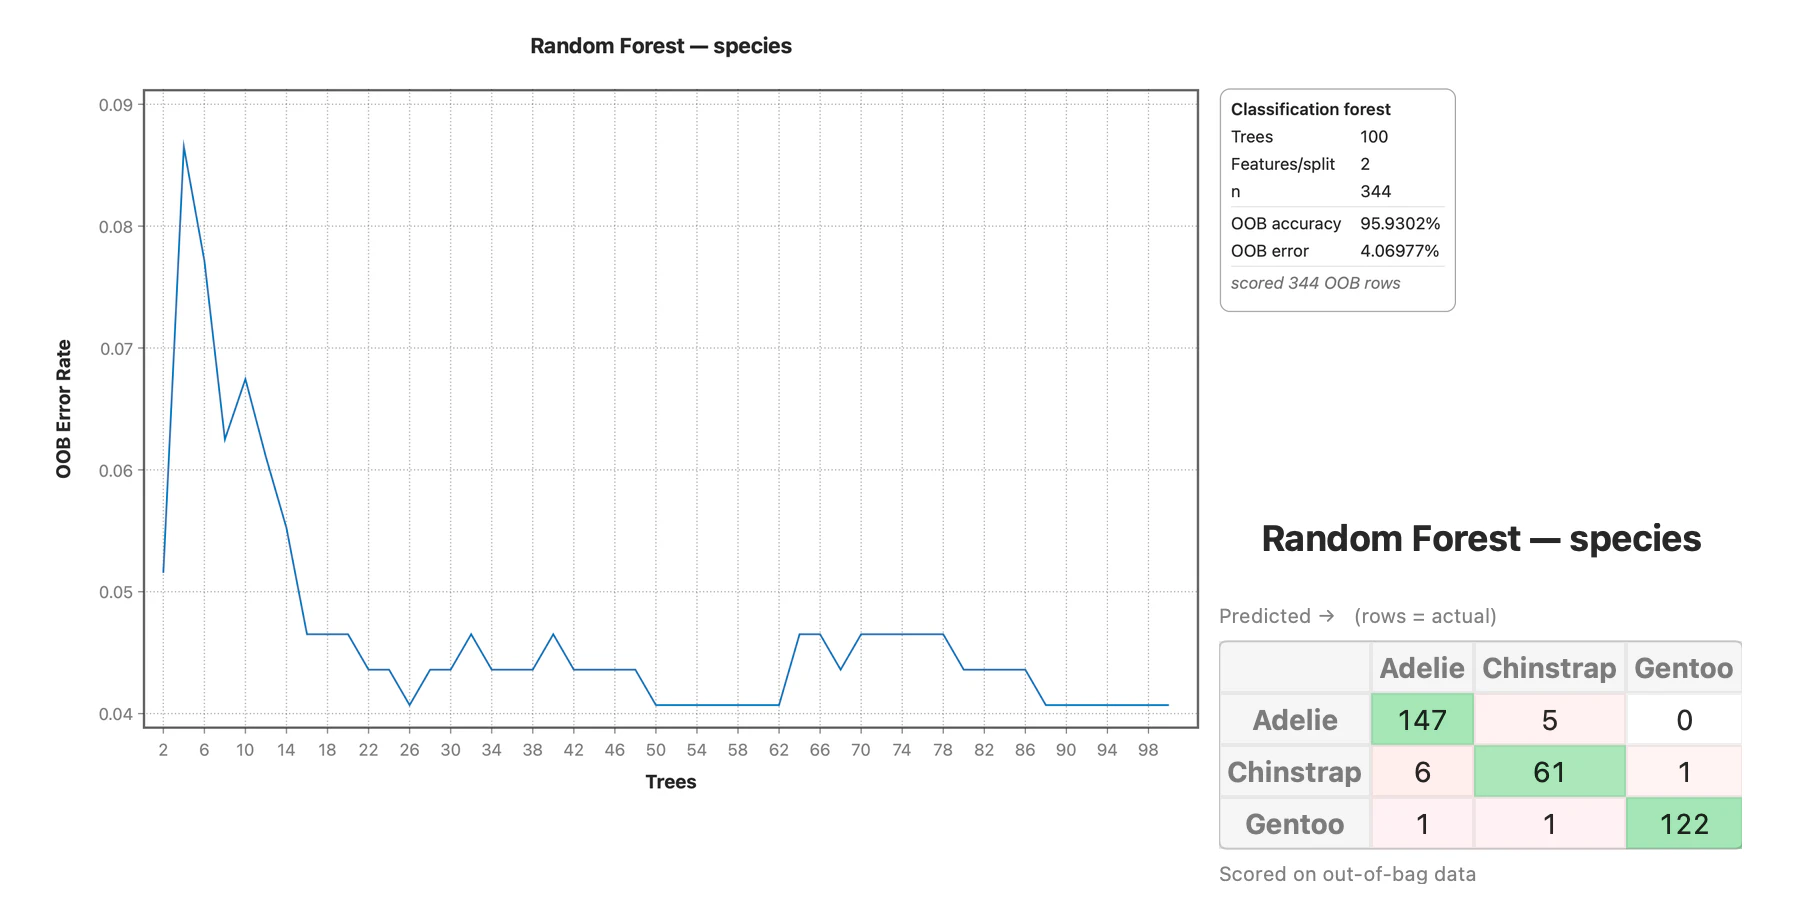
Random Forest — an ensemble of trees when a single tree is too unstable to trust, with out-of-bag error, an OOB error curve and an OOB confusion matrix, so accuracy is measured without giving up any rows.
Boosted Trees — gradient boosting with learning rate, subsample fraction and depth in your hands, and early stopping read off the validation curve rather than guessed.
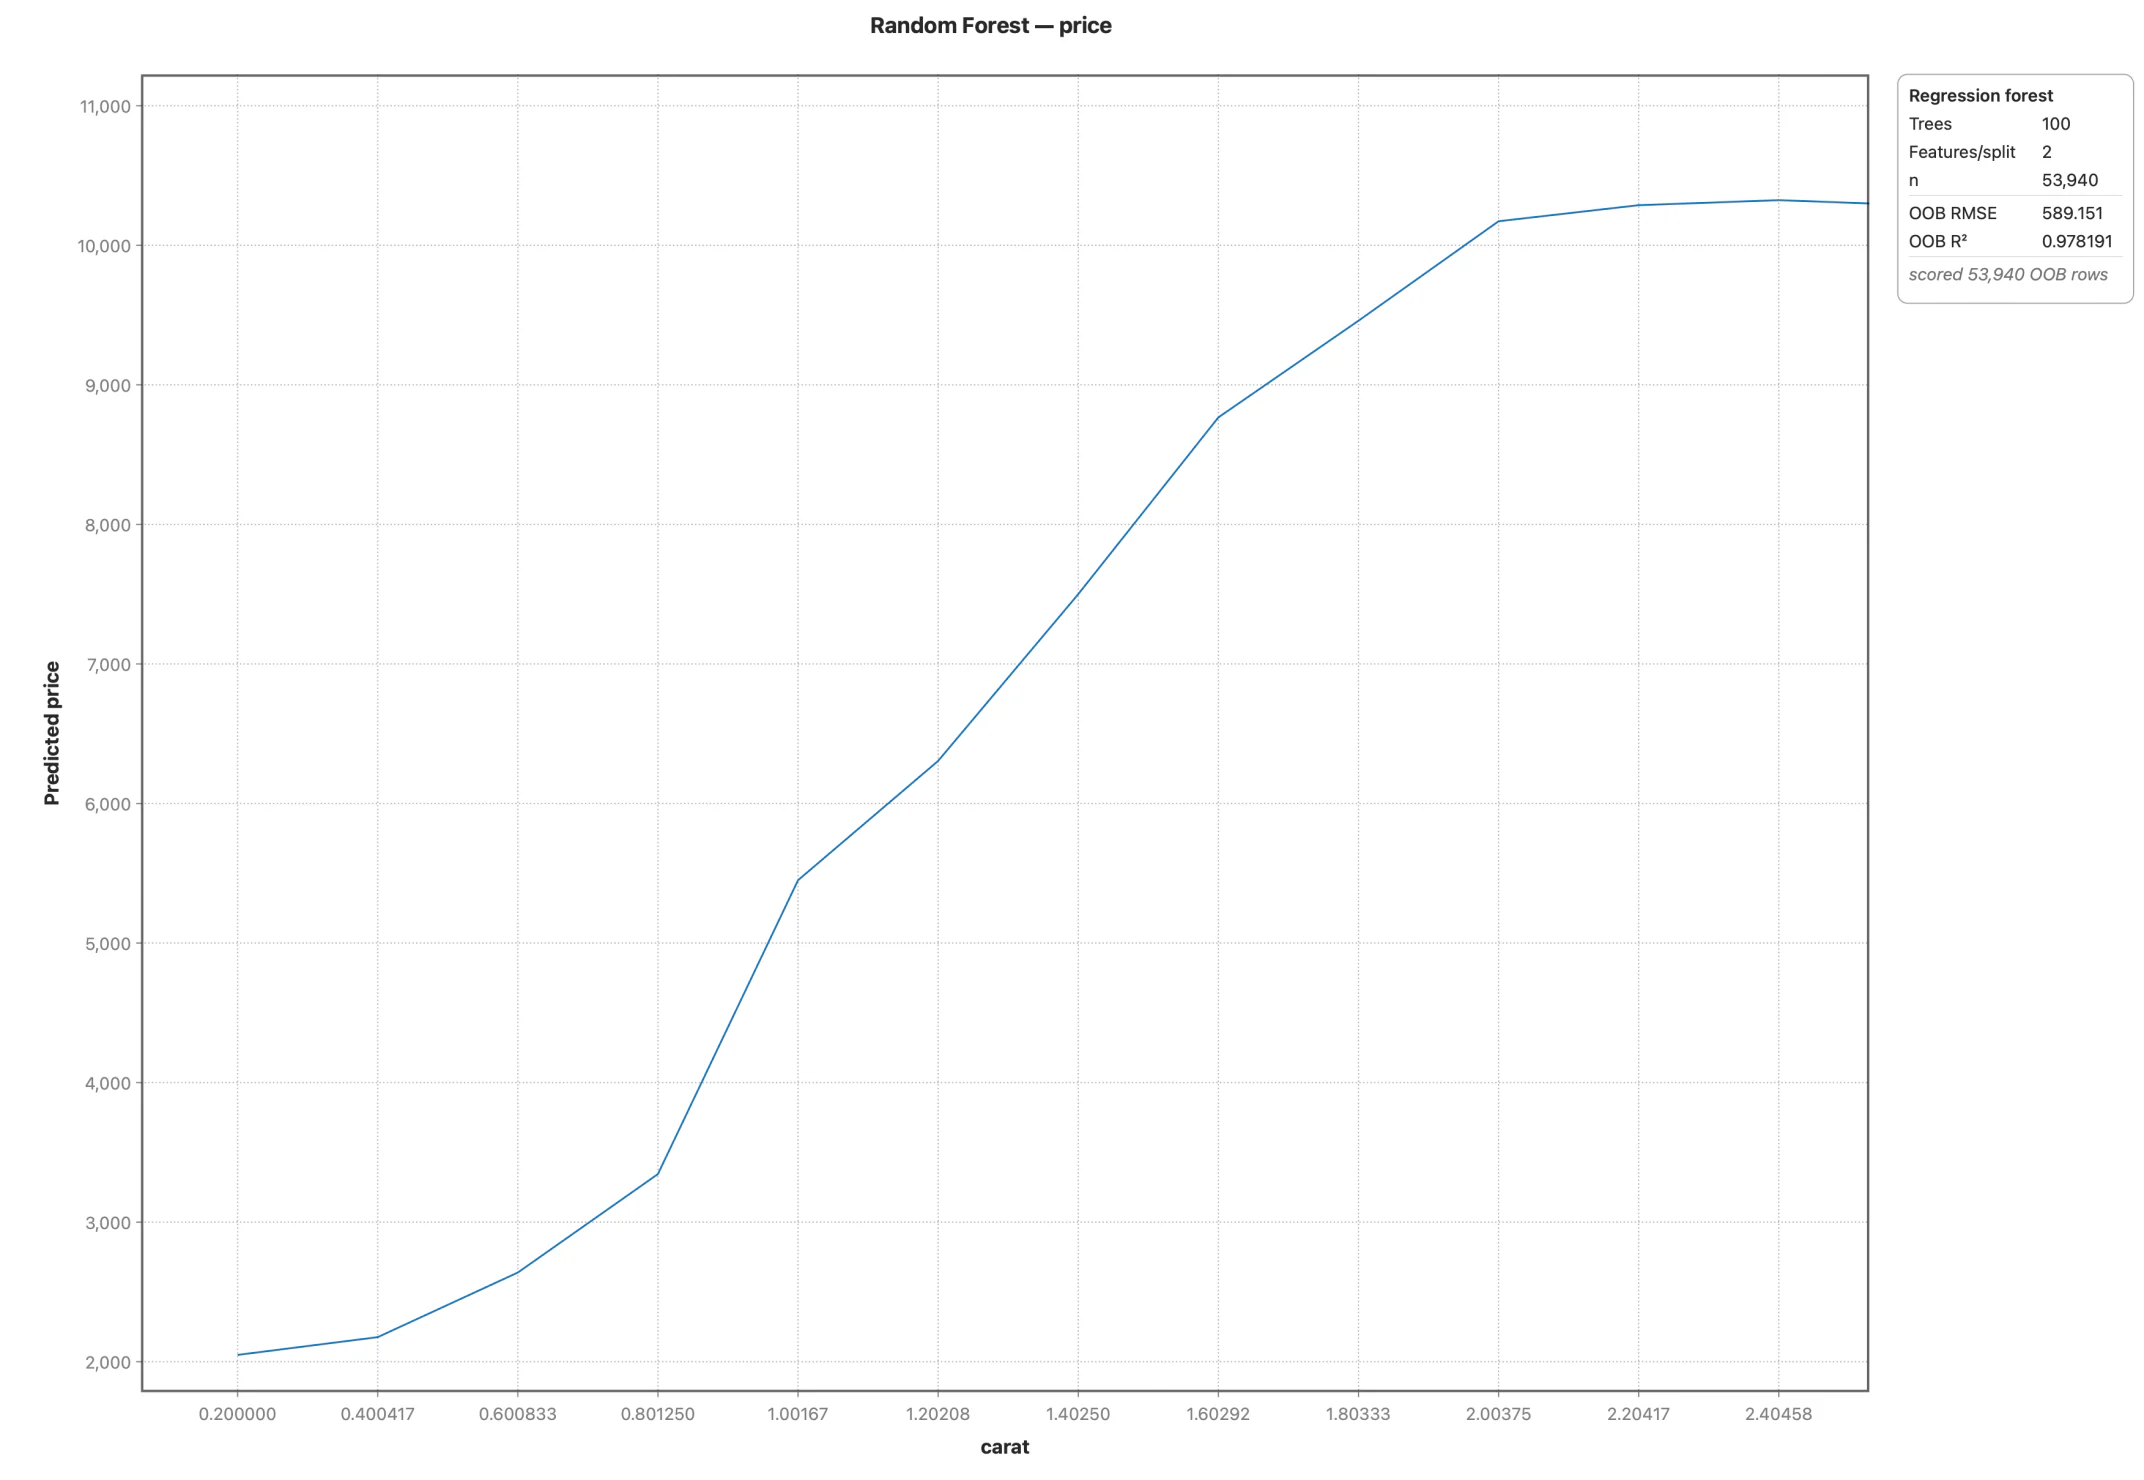
Partial Dependence — the fitted effect of one predictor with the others averaged out, plotted, which is how a forest stops being a black box.
Model Comparison — a tree, a forest and a boosted model scored on the same held-out rows, with confusion matrices and test AUC side by side.
Tree diagram — drawn, zoomable and exportable at print resolution, not a nested text dump you have to read sideways.
Regression, ANOVA, PCA — the rest of the toolkit in the same app, so a tree is not a silo.
Point-and-click throughout — and equally native on a Mac, where most data-mining tools are Windows-first.
Decision trees are in Stratum’s Professional edition together with PCA, MANOVA, correspondence analysis, clustering and SPC — on top of everything in Standard, including descriptive statistics, ANOVA, correlation and contingency, and linear and multiple regression with full diagnostics. Import your .csv, .xlsx or .sav and try it on your own data first.
Yes — classification trees for categorical outcomes and regression trees for numeric ones, with the split criterion, maximum depth and minimum node size under your control.
Yes — variable importance is ranked for the fitted model. Decision trees explained walks through reading one.
Yes — random forests and boosted trees are included in the same edition, so you can compare a single explainable tree against an ensemble on the same data.
Yes — the tree is drawn rather than printed as text, and exports to PNG or PDF at print resolution.
Yes — Stratum is a native app for both macOS 14+ and Windows 10/11, so trees work the same on either.
No — Stratum is a one-time purchase. Trees are in Professional ($249), and you can upgrade from Standard later.
 Stratum