Regression analysis software · Mac & Windows
Fit the model and leave with everything you need to defend it. Coefficients with standard errors, t, p and confidence intervals, plus VIF, leverage, Cook’s D, Durbin-Watson and the residual and Q-Q plots — reported with the result, not requested separately. Native on Mac and Windows, bought once. Free to try on your own data before you decide.


Most of the established packages are sold as an annual subscription — often quoted only after a sales call. Whatever the number turns out to be, it returns every year, and access stops when you stop paying.
Five years, five bills — and no software left if you stop.
Bought once. The version you buy keeps working forever, online or off, on Mac and Windows alike.
$119 for Standard — once, and it’s yours.
| Capability | In Stratum |
|---|---|
| Simple & multiple linear regression | Coefficients with SEs, t, p and confidence intervals |
| Model terms | Numeric predictors, categorical predictors against a reference level, interactions, and polynomial terms in a raw, centered or orthogonal basis |
| Model fit | R², adjusted R², overall F, AIC, BIC, PRESS and predicted R² |
| Model selection | Best-subsets search, ranked by Mallows’ Cp, AIC, BIC or adjusted R² |
| Multicollinearity | VIF per predictor |
| Influence | Leverage, studentized residuals, Cook’s D, influence plot |
| Prediction | Confidence intervals for the mean response, prediction intervals for a new observation |
| Assumption checks | Residuals against fitted, Q-Q plots, four normality tests, Durbin-Watson for serial correlation |
| Held-out validation | Seeded training / validation / test splits, optionally stratified, scored on rows the model never saw |
| Curve fitting | Quadratic, cubic, power, exponential and logarithmic fits, plus LOWESS, kernel smoothers and moving averages |
| Linked selection | Select the high-leverage points on the influence plot and the same rows highlight in the datasheet, the scatter and every other chart |
| Covariates | ANCOVA |
| Non-linear relationships | Regression trees, random forests, boosted trees (Professional) |
| Numerical validation | Published validation record — the outside tool named for every statistic, including the gaps |
| Pricing | One-time (Standard $119) — no subscription |
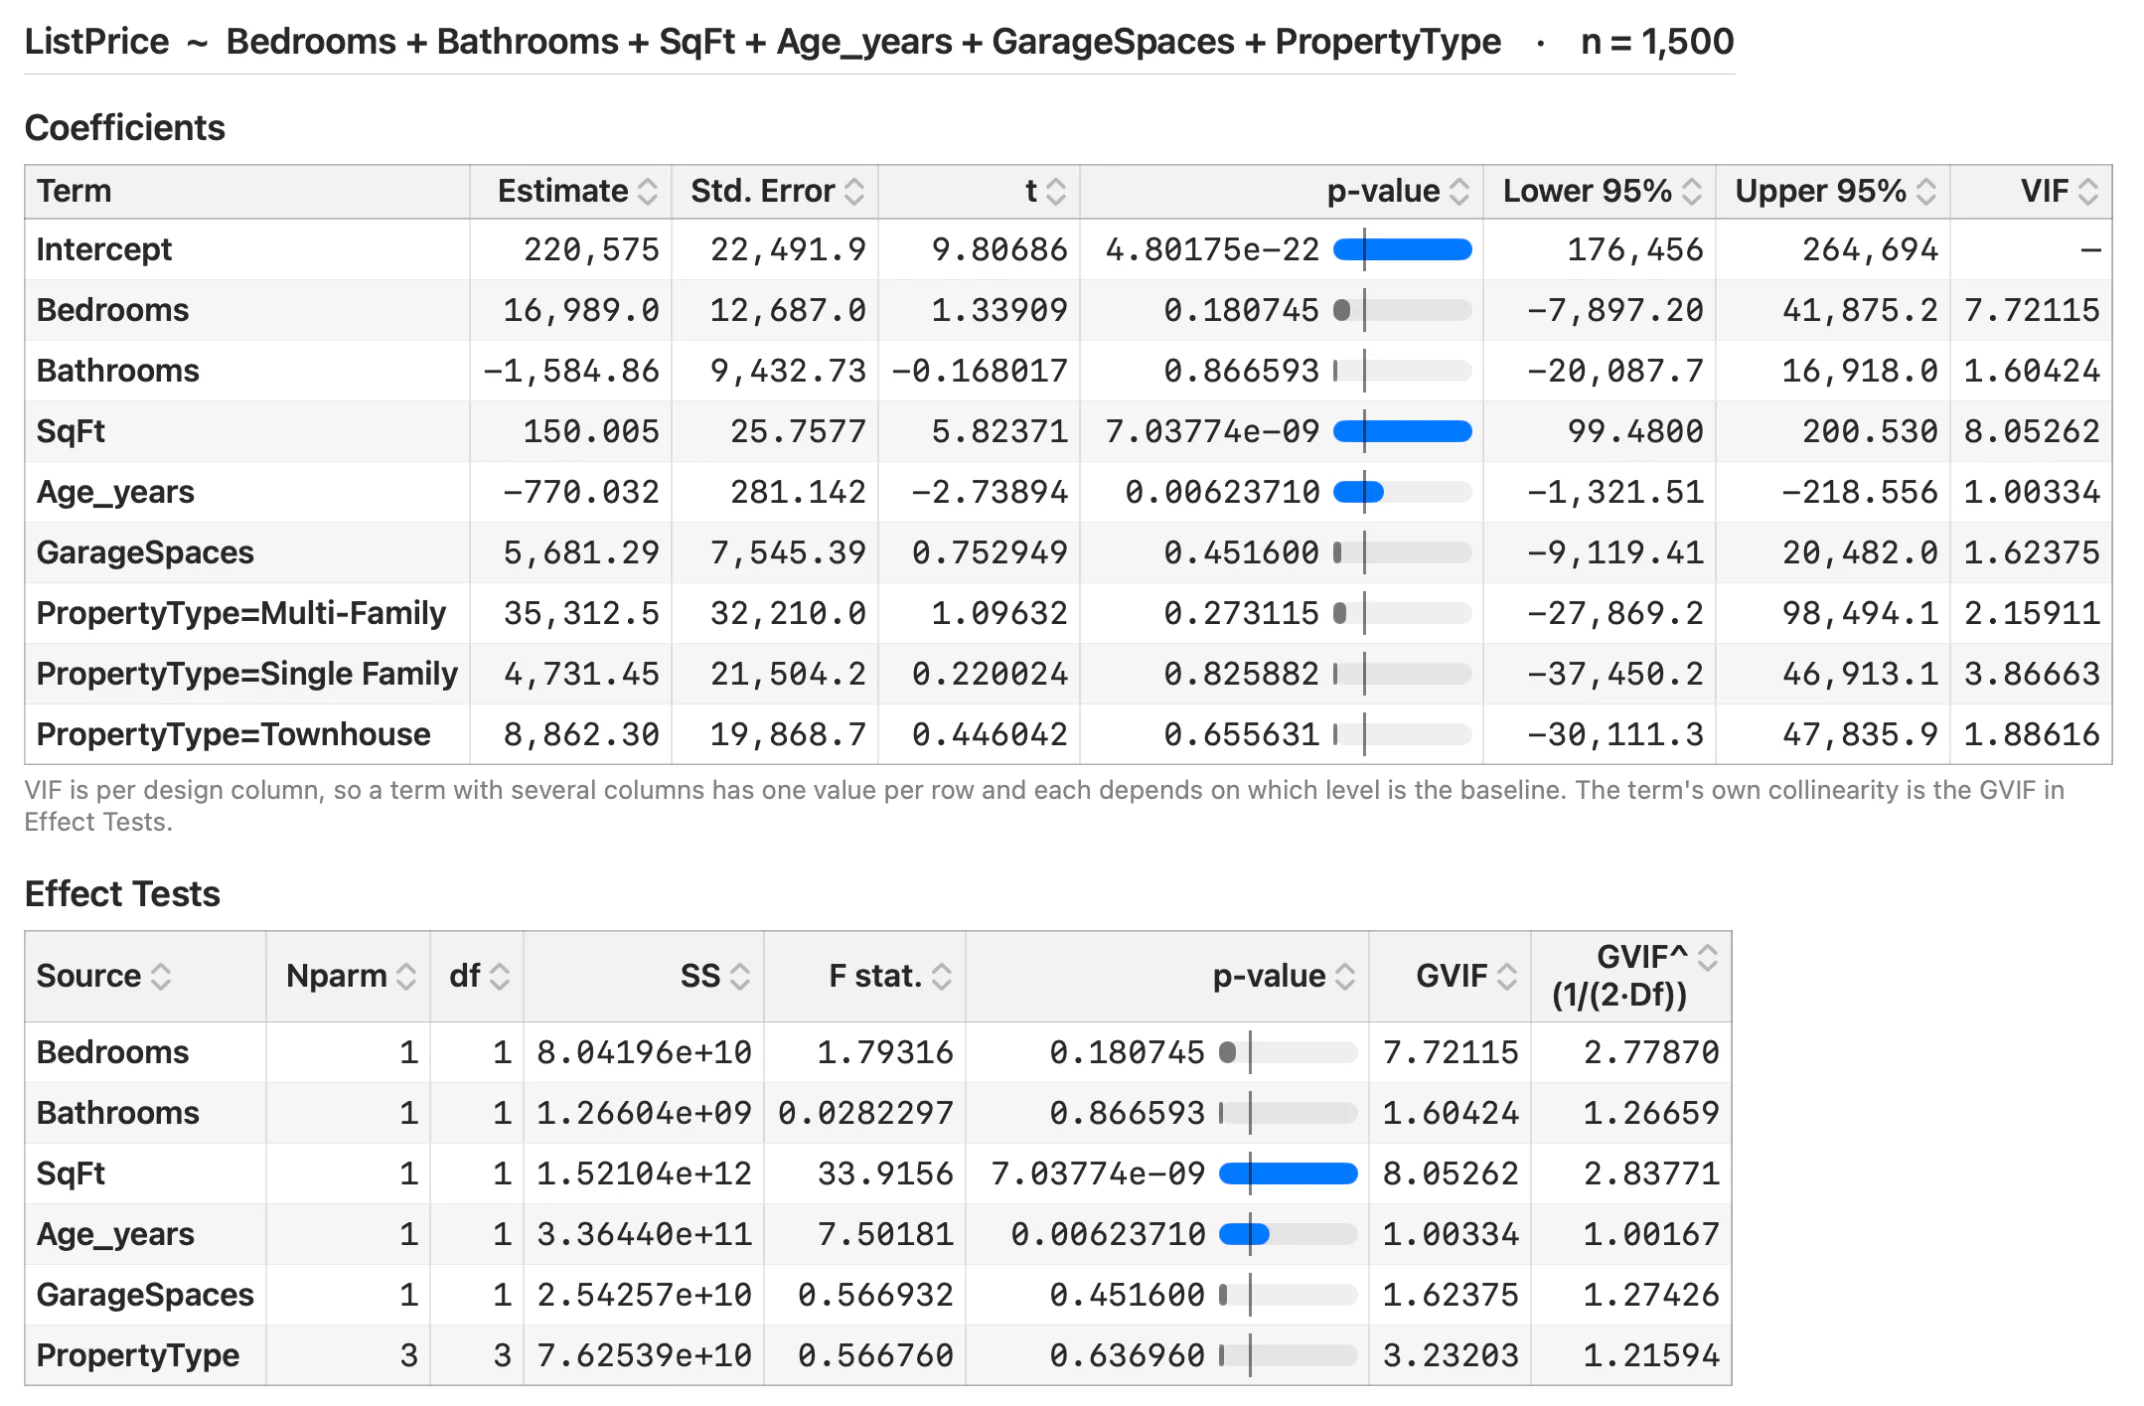
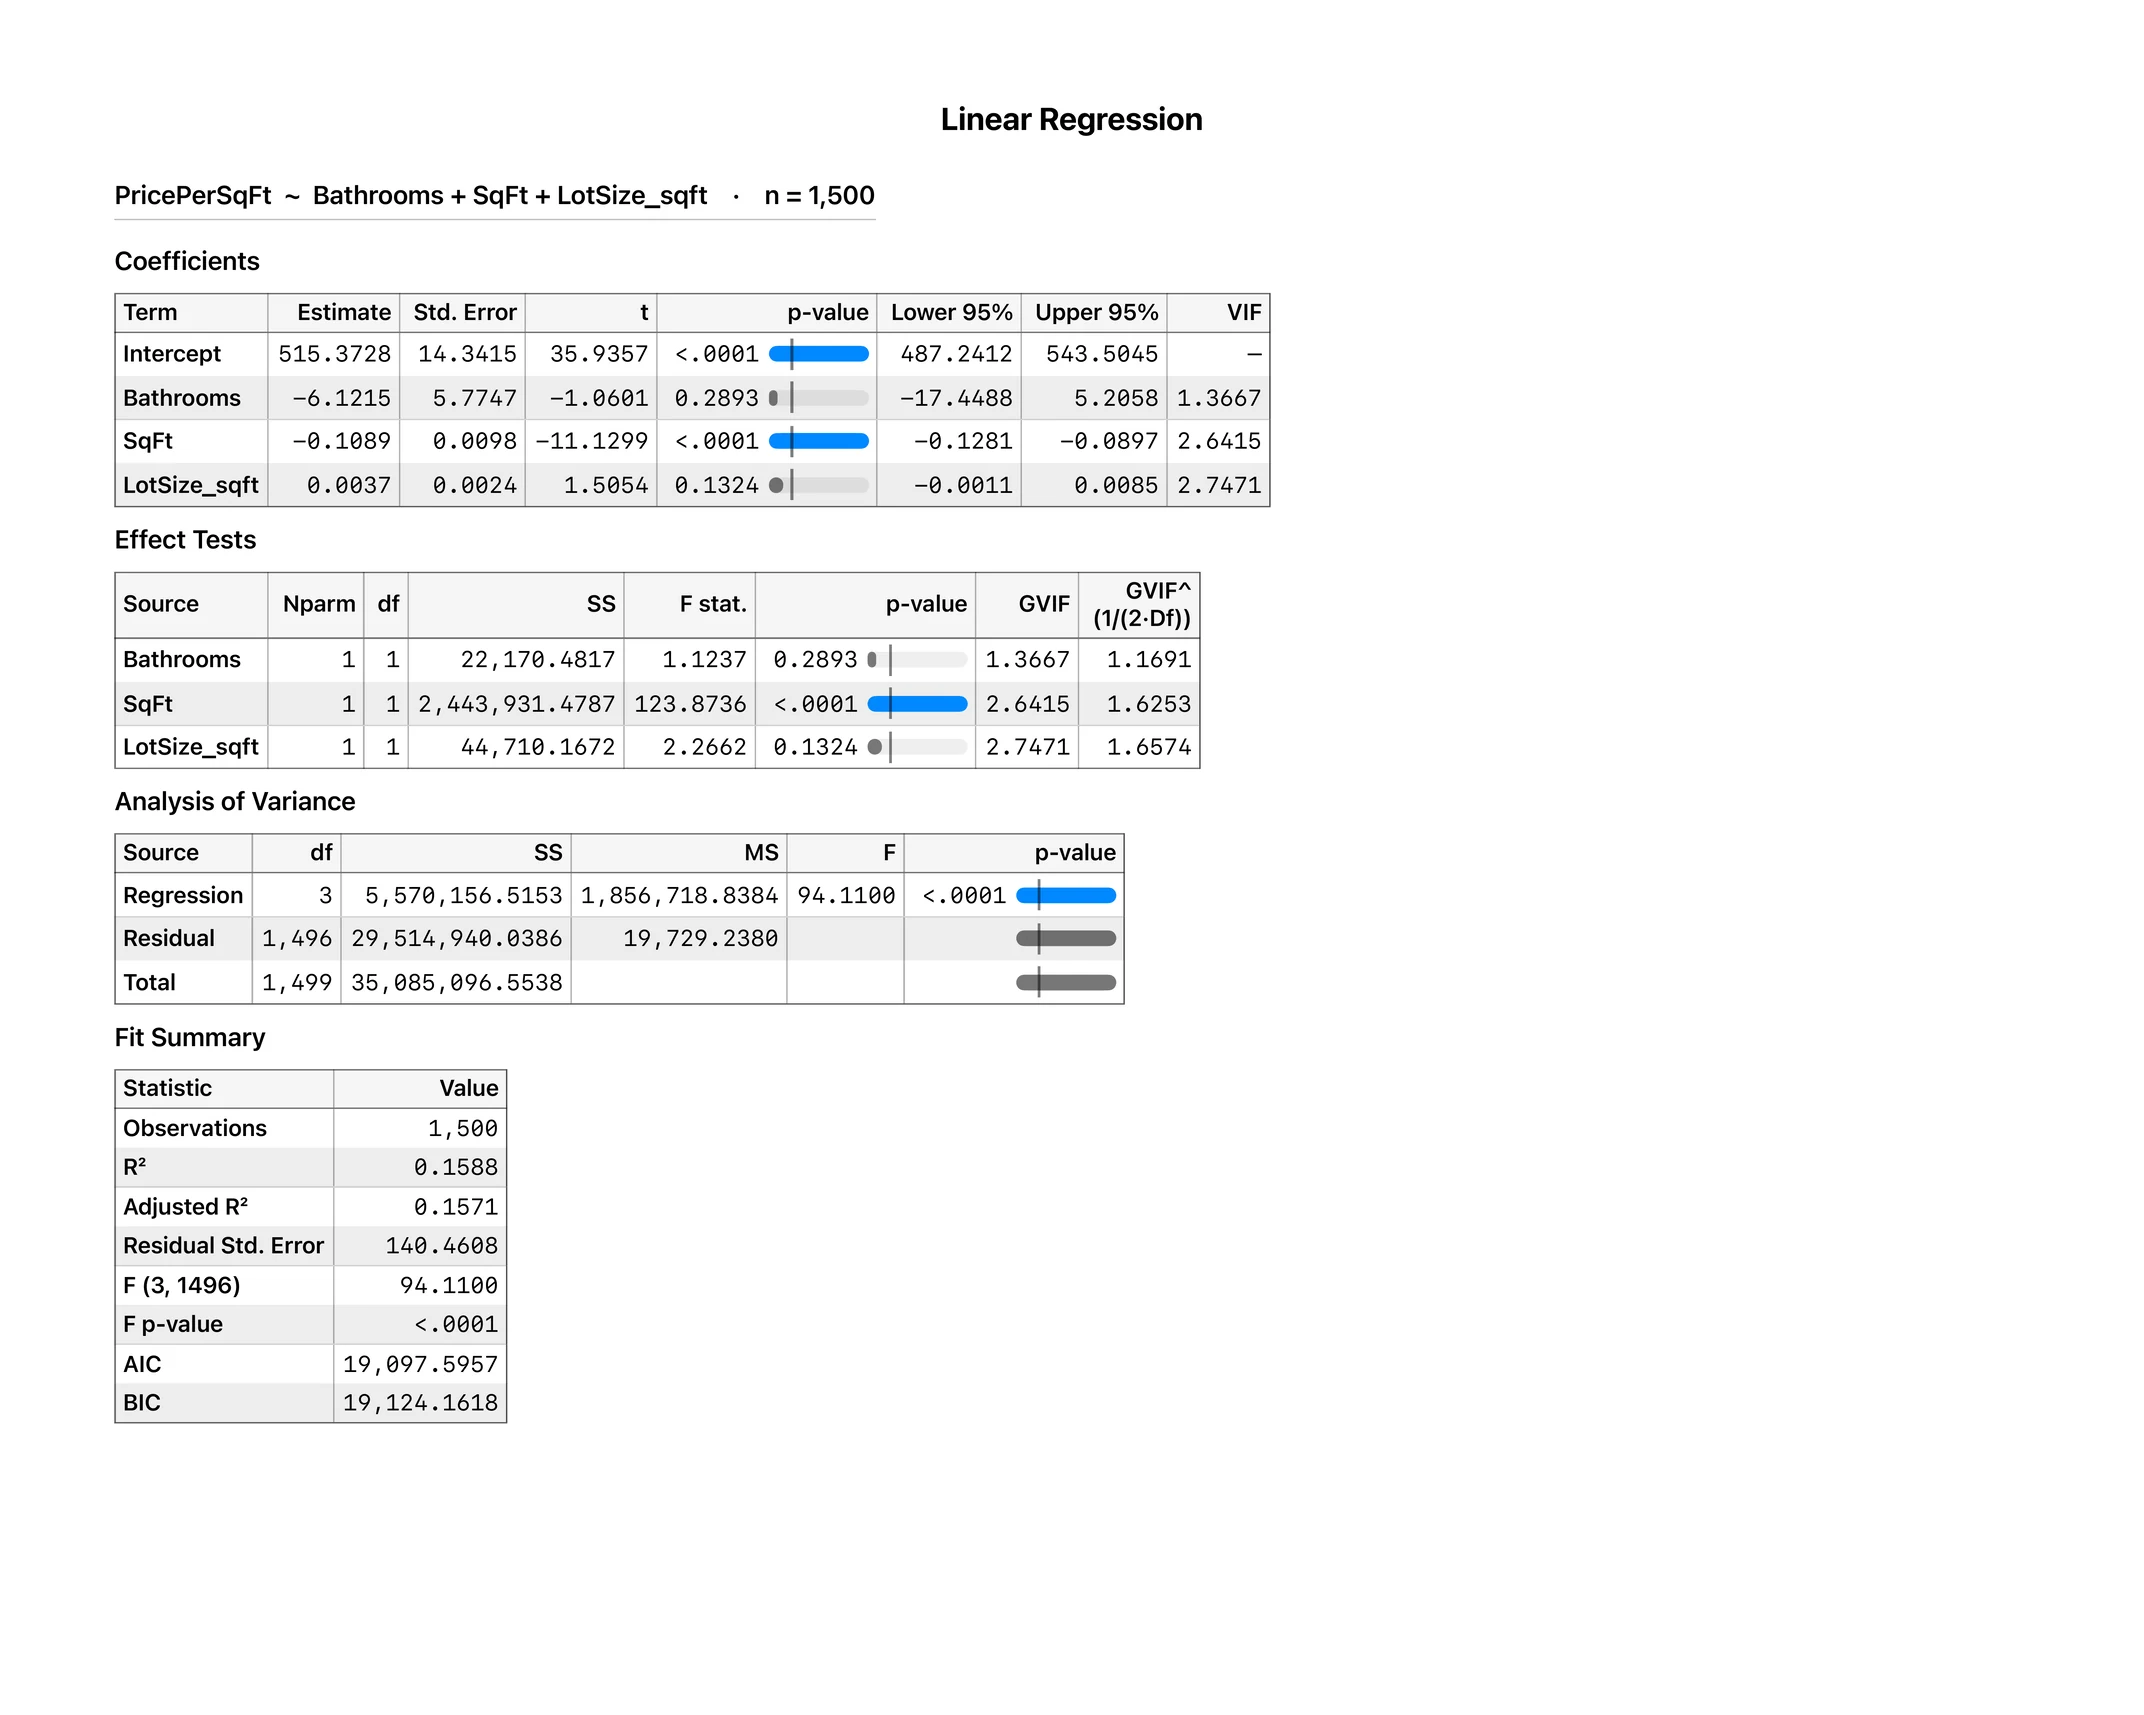
Linear Regression — simple or multiple, with coefficients, standard errors, t, p and confidence intervals.
R², AIC, BIC — with adjusted R² and the overall F, so model comparison is a reading rather than a calculation.
VIF — variance inflation per term, reported by default rather than on request.
Leverage & Cook’s D — an influence plot of leverage against studentized residual, markers sized by Cook’s distance.
Residual & Q-Q plots — residuals against fitted, where heteroscedasticity shows itself rather than hiding inside a statistic.
ANCOVA — a covariate alongside group effects, so a baseline measurement stops masking the comparison.
Scatter with OLS / LOESS — the fit drawn over the data, with correlation on the legend.
Linked Selection — click the point sitting out on the influence plot and it is selected in the datasheet and in every other chart at once, which is how you find out what that observation actually was.
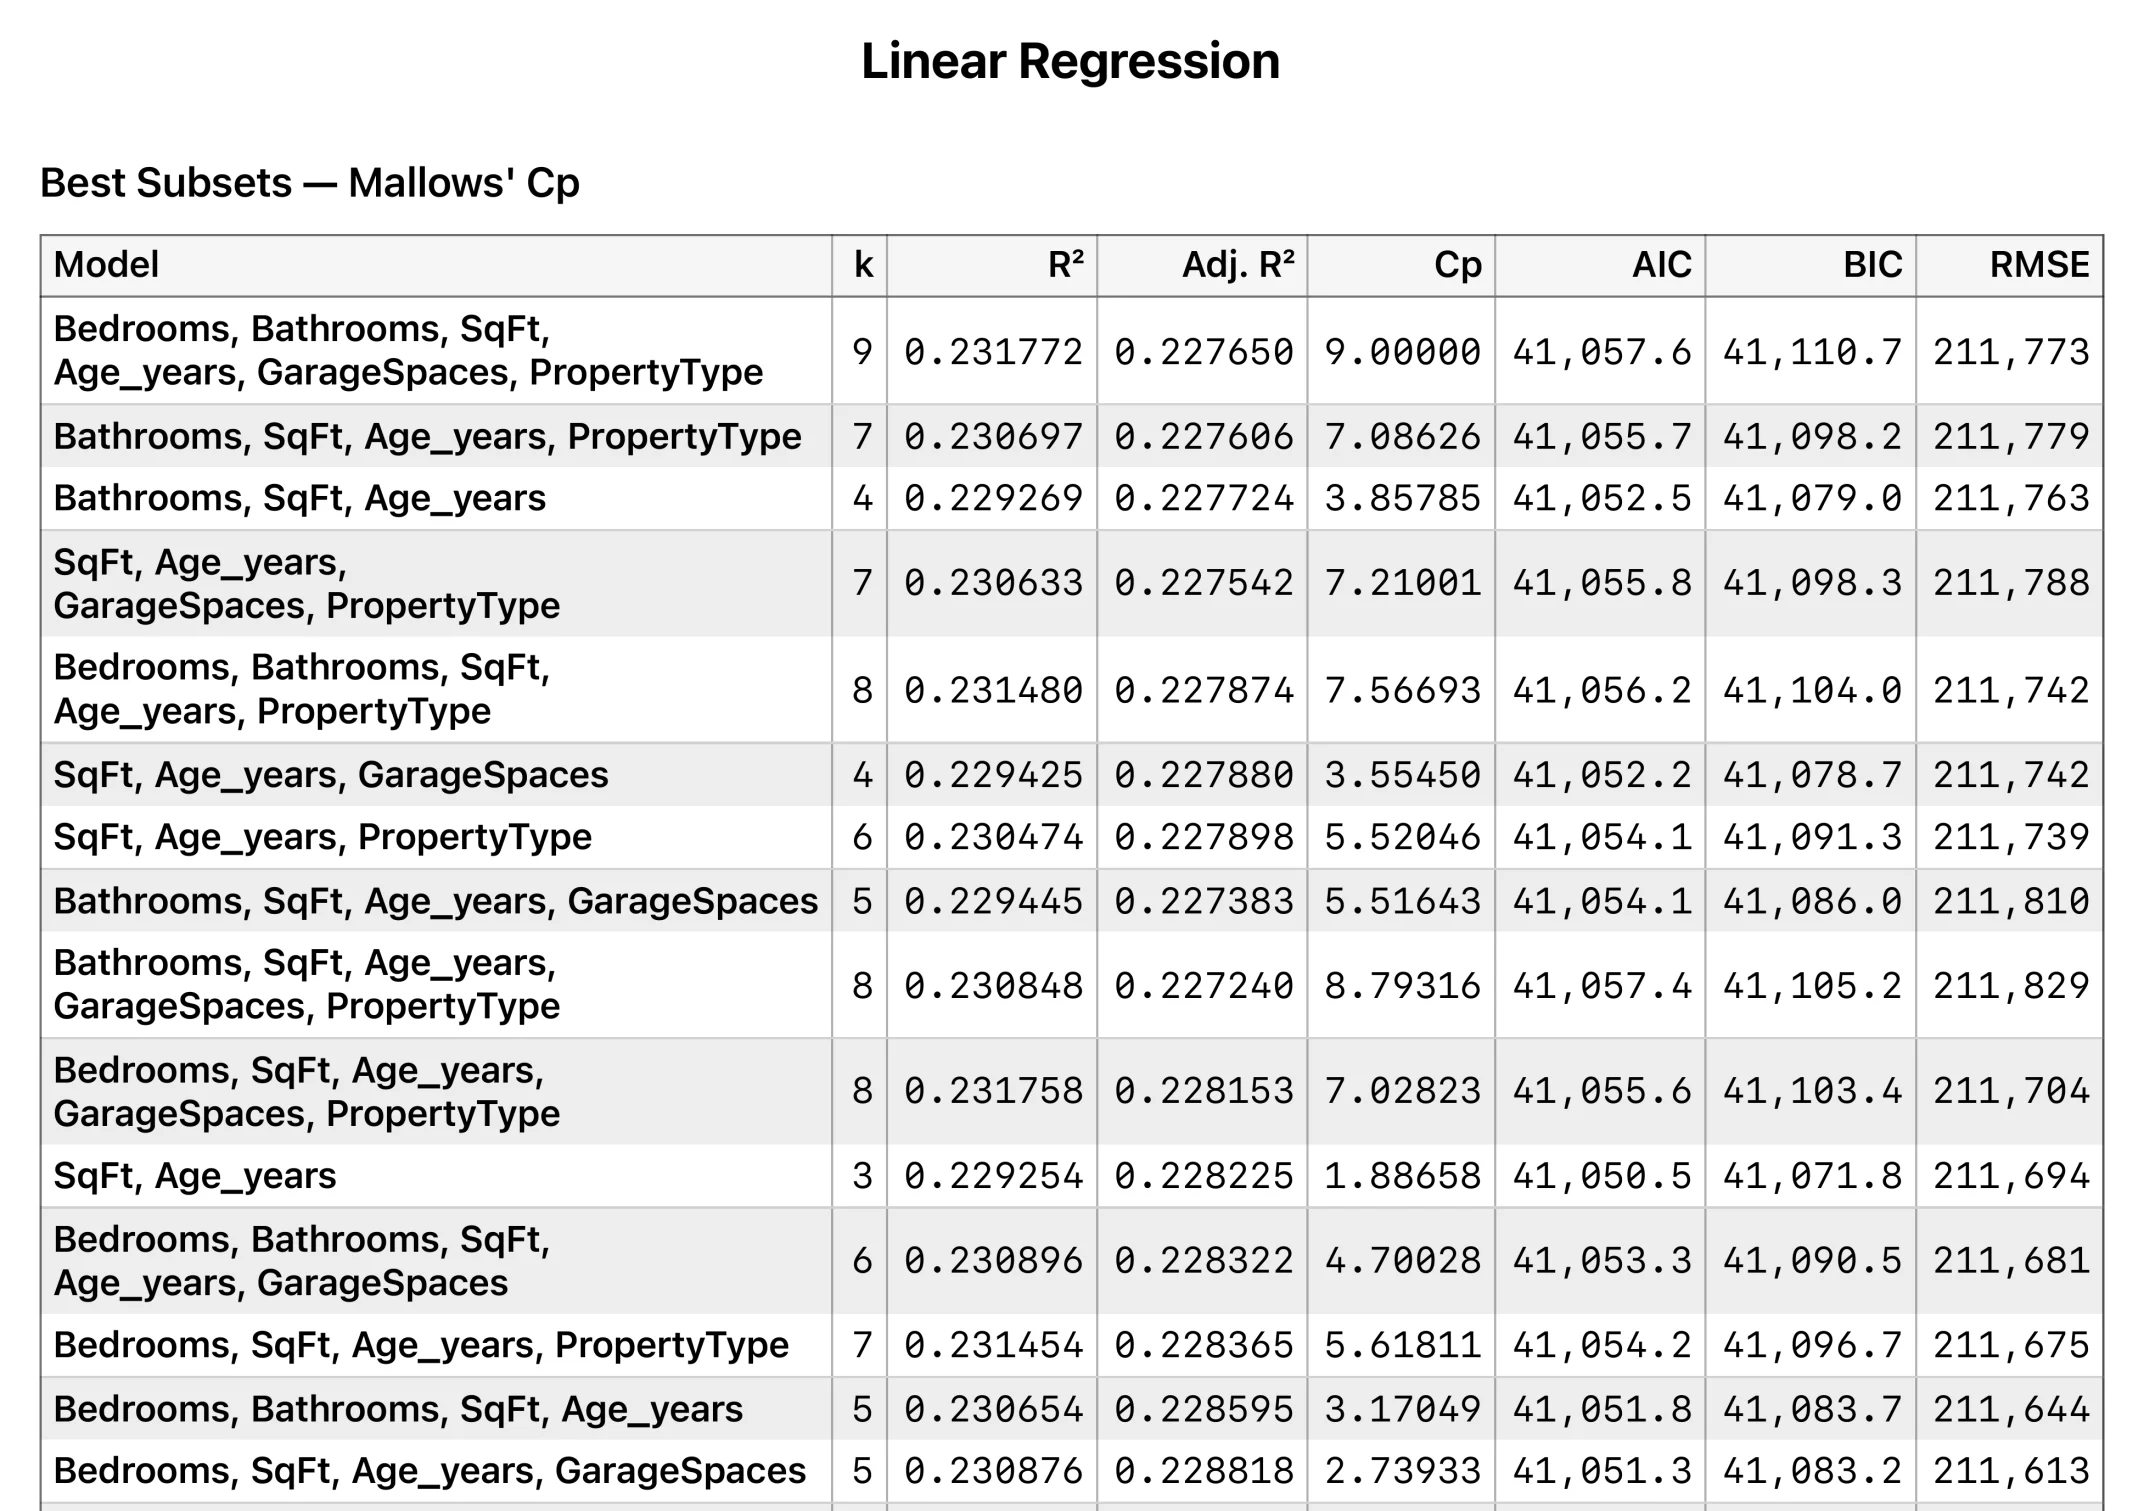
Best Subsets — the candidate models fitted and ranked by Mallows’ Cp, AIC, BIC or adjusted R², so the choice rests on a stated criterion rather than on dropping terms one at a time.
Prediction Intervals — a confidence interval for the mean response and a prediction interval for a single new observation, which is the wider of the two and usually the one being asked for.
Validation — hold out validation and test rows from a seeded split, score the model on rows it was never fitted to, and compare models on the same partition.
Model Terms — a categorical predictor against a reference level, an interaction, or a polynomial term in a raw, centered or orthogonal basis.
Regression trees, forests — regression trees and ensembles when the relationship is not linear. Professional.
Point-and-click throughout — and equally native on a Mac, where most statistics packages are Windows-first.
Regression is in Stratum’s Standard edition together with the everyday toolkit — descriptive statistics by group, ANOVA with Tukey HSD and Welch / Games-Howell, two-sample and paired t-tests with non-parametric equivalents, correlation and scatter matrices, and contingency tests. Professional adds PCA, MANOVA, correspondence analysis, clustering, decision trees and SPC. Import your .csv, .xlsx or .sav and try it on your own data first.
Yes — simple and multiple linear regression, with coefficients, standard errors, t, p and confidence intervals for every term.
Yes — VIF per predictor, and leverage, studentized residuals and Cook’s D with an influence plot, in the same report rather than a separate module.
Yes — best-subsets regression fits the candidate models and ranks them by Mallows’ Cp, AIC, BIC or adjusted R². PRESS and predicted R² are reported alongside, which is what catches a model fitting the sample better than it will predict.
Yes. A categorical predictor is coded against a reference level you choose, interactions are terms like any other, and polynomial terms can be fitted in a raw, centered or orthogonal basis — the orthogonal basis being the one that keeps the lower-order terms interpretable.
Yes — residuals against fitted, Q-Q plots and normality tests. Linear regression in Stratum walks through reading them.
Yes — Stratum is a native app for both macOS 14+ and Windows 10/11, so regression works the same on either.
No — Stratum is a one-time purchase. You can upgrade from Standard to Professional later.
 Stratum