 Stratum
Two-Sample Comparison: t-Tests, Mann–Whitney & Effect Size
Did the treatment actually do something? Almost every real question in statistics eventually comes down to comparing two groups — and Stratum's Two-Sample Comparison gives you the right test, the right caveats, and an honest measure of how big the difference is.
In our clinical trial, patients in the Treatment group got the drug and patients in the Control group got a placebo. Their average change from baseline differs. But averages always differ a little, just from chance. The job of a comparison test is to decide whether the gap you see is bigger than random noise would plausibly produce — and that question has a precise statistical answer.
The two-sample t-test, set up in seconds
Point Stratum's Two-Sample Comparison at a numeric variable and a grouping column with two levels, and it does the rest. Here we compare ChangeFromBaseline across the two values of Group. That's the whole setup: one measurement, two groups.

Behind every test is a pair of competing claims. The null hypothesis says the two groups have the same true mean — any observed difference is just luck. The alternative hypothesis says they really differ. The test computes a p-value: the probability of seeing a difference at least this large if the null were true. A small p-value (conventionally below 0.05) means such a result would be surprising under "no difference," so you reject the null.

Pooled or Welch? Equal variance or not
The classic (pooled) t-test assumes both groups have the same spread. Real groups rarely do. Welch's t-test drops that assumption, adjusting the degrees of freedom for unequal variances — and in Stratum it's the default. A single Equal Variances toggle switches to the pooled test when you do want to assume equal spread, so you never have to hand-derive the correction.

Paired vs independent designs
Sometimes the two columns aren't separate groups at all — they're the same subjects measured twice. Comparing each patient's BaselineScore to their own Week12Score is a paired design. Pairing is powerful: by looking at each person's change, it cancels out the differences between people and focuses on the within-person effect, which usually makes the test far more sensitive.

The rule is simple: if the same unit appears in both columns, pair it; if the two groups are different units, keep them independent. Choosing wrong throws away real information — or invents it.
When normality fails: nonparametric tests
The t-test assumes the data is roughly normal. When it isn't — skewed measurements, small samples, stubborn outliers — flip on Stratum's Wilcoxon W toggle for a nonparametric comparison. It's the rank-based test you may know as the Mann–Whitney rank-sum (for independent groups; the equivalent signed-rank form for paired data): it compares ranks instead of raw values, so a single extreme point can't dominate the result.

How do you decide? Don't guess — Stratum runs a normality check (the same Anderson–Darling, chi-square, and Kolmogorov–Smirnov tests from the Summary report) right alongside the comparison. If the data looks normal, trust the t-test; if it doesn't, lean on the rank-based version.
Effect size: how big, not just whether
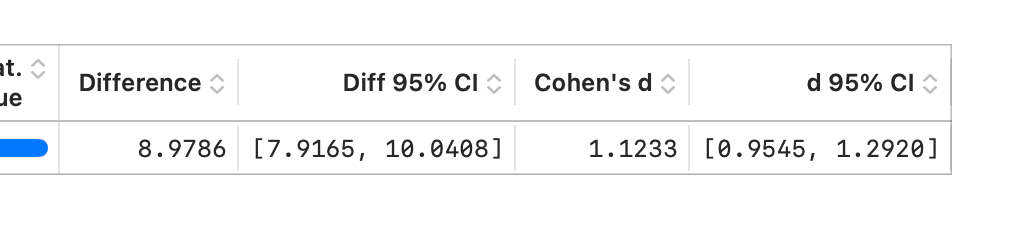
A p-value tells you whether a difference is real. It says nothing about whether it matters. With a large enough sample, a trivial difference can be "statistically significant." That's why Stratum also reports a confidence interval for the difference and an effect size (Cohen's d) — the gap measured in standard deviations.
Follow along
- Dataset
- clinical_trial.csv
- You'll use
- Two-Sample Comparison — independent (change by group), paired (baseline vs week 12), Welch, Mann–Whitney, normality checks and effect size
- Up next
- Lesson 15 — One- & Two-Way ANOVA
Two groups is the simplest comparison there is. But experiments rarely stop at two — what if you have three recipes, or four sites? Running a t-test on every pair quietly inflates your error rate. In the next lesson we'll meet the test built for many groups at once: ANOVA.