 Stratum
Simpson's Paradox in the Wild: When "Better" Means Cheaper
A confounding variable, caught in 54,000 real diamonds.
Most textbook examples of Simpson's paradox are toy tables — a made-up hospital, a made-up batting average. Here's one in real data you can download, and it's a clean illustration of the single most dangerous trap in applied statistics: confounding.
diamonds — 53,940 real diamonds (carat, cut, color, clarity, dimensions, price), the public ggplot2 dataset.
Download the CSV and open it in Stratum to reproduce every number below. Up next: When to Log-Transform Skewed Data.
The impossible chart
Take 53,940 real diamonds and average their price by cut quality:
| Cut (worst → best) | Avg price |
|---|---|
| Fair | $4,359 |
| Good | $3,929 |
| Very Good | $3,982 |
| Premium | $4,584 |
| Ideal | $3,458 |
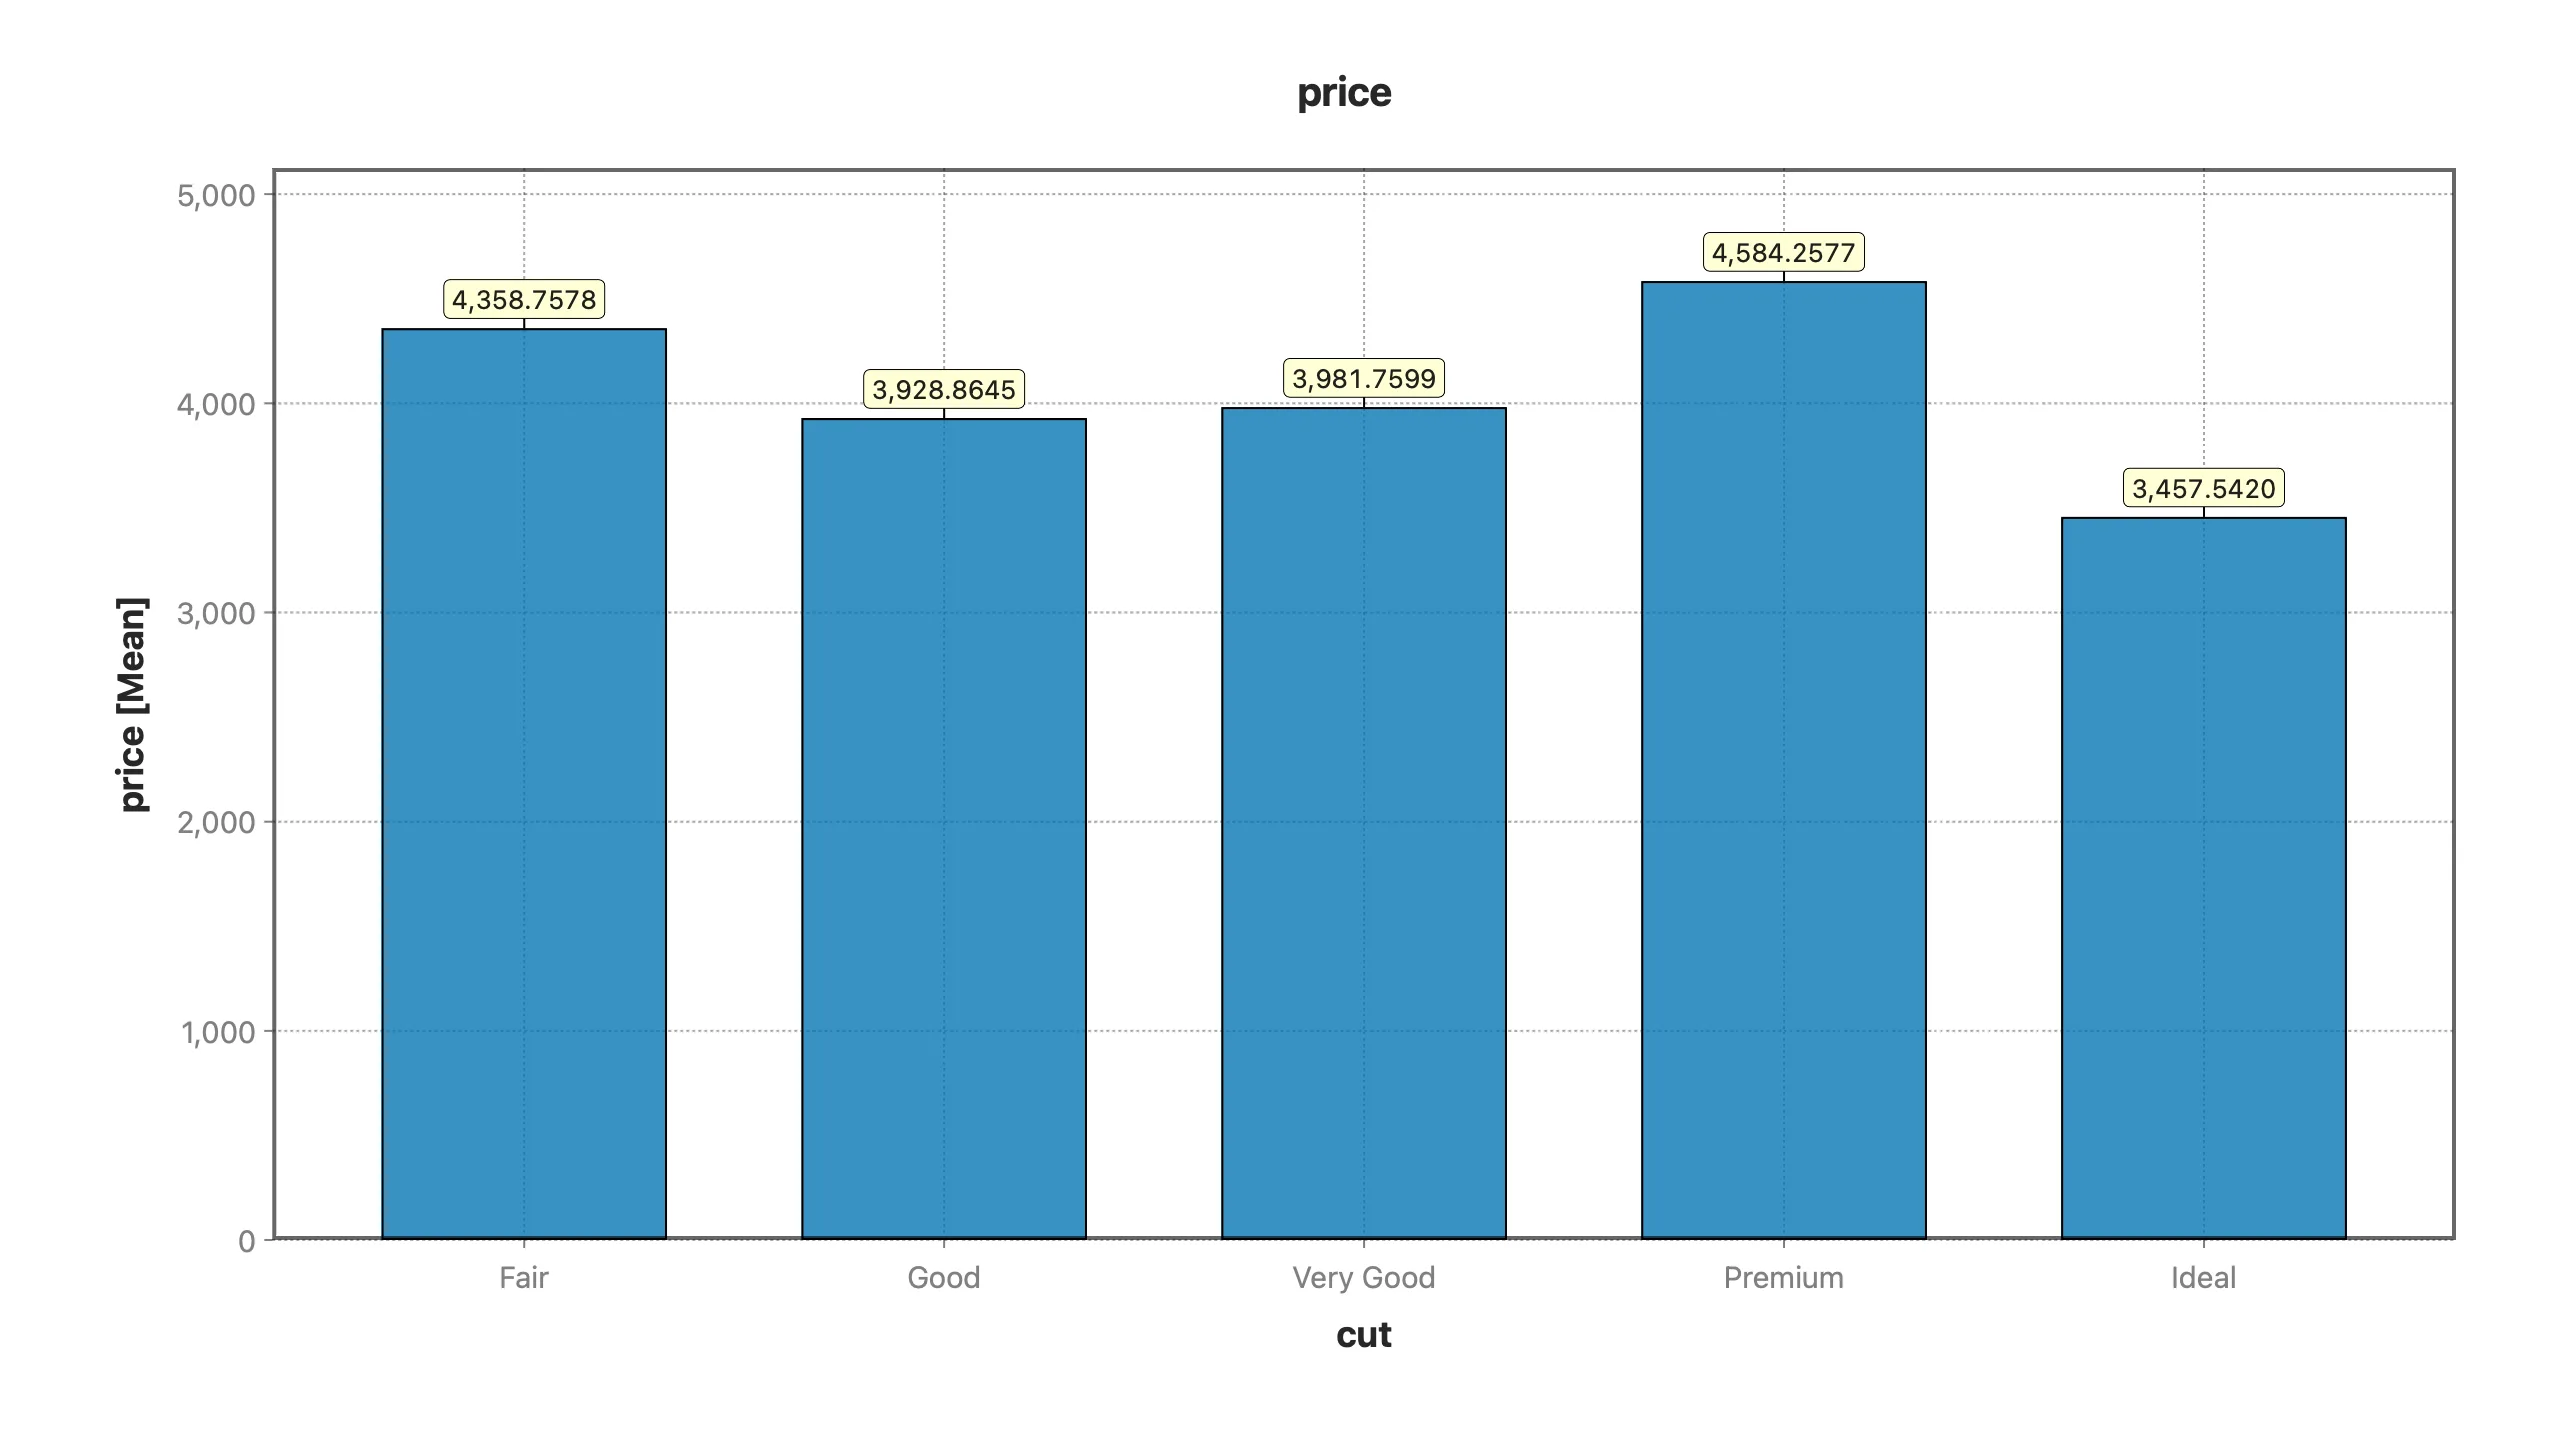
The best cut money can grade is the cheapest. And it isn't a one-off — the best color grade (D) averages $3,170 while the worst (J) averages $5,324, and near-flawless clarity (IF) averages $2,865 while a much lower grade (SI2) averages $5,063. Every quality scale points the wrong way.
Why one chart can lie
Simpson's paradox is what happens when a relationship inside every subgroup reverses once you pool the subgroups together — because a third variable is distributed unevenly across them. That third variable is the confounder.
Here, the confounder is carat (size). Watch what happens when you put average size next to the quality grades:
| "Best" grade avg carat | "Worst" grade avg carat | |
|---|---|---|
| Cut | Ideal: 0.70 | Fair: 1.05 |
| Color | D: 0.66 | J: 1.16 |
| Clarity | IF: 0.51 | SI2: 1.08 |
The top-graded stones are systematically small. Nobody takes a flawless, colorless three-carat rock and grinds it down to an Ideal half-carat — the rough is too valuable. So "Ideal" is quietly a proxy for "small," and small is cheap. The quality grade never lowered the price; size did, and size happened to correlate with quality.
How to catch it every time
The cure is always the same: stop letting the confounder move. Compare like with like. Bin the diamonds by carat, then look at price by cut within each size band:
- 1.0–1.5 ct: Fair $4,368 → Ideal $6,866
- 2.0 ct +: Fair $11,875 → Ideal $15,524
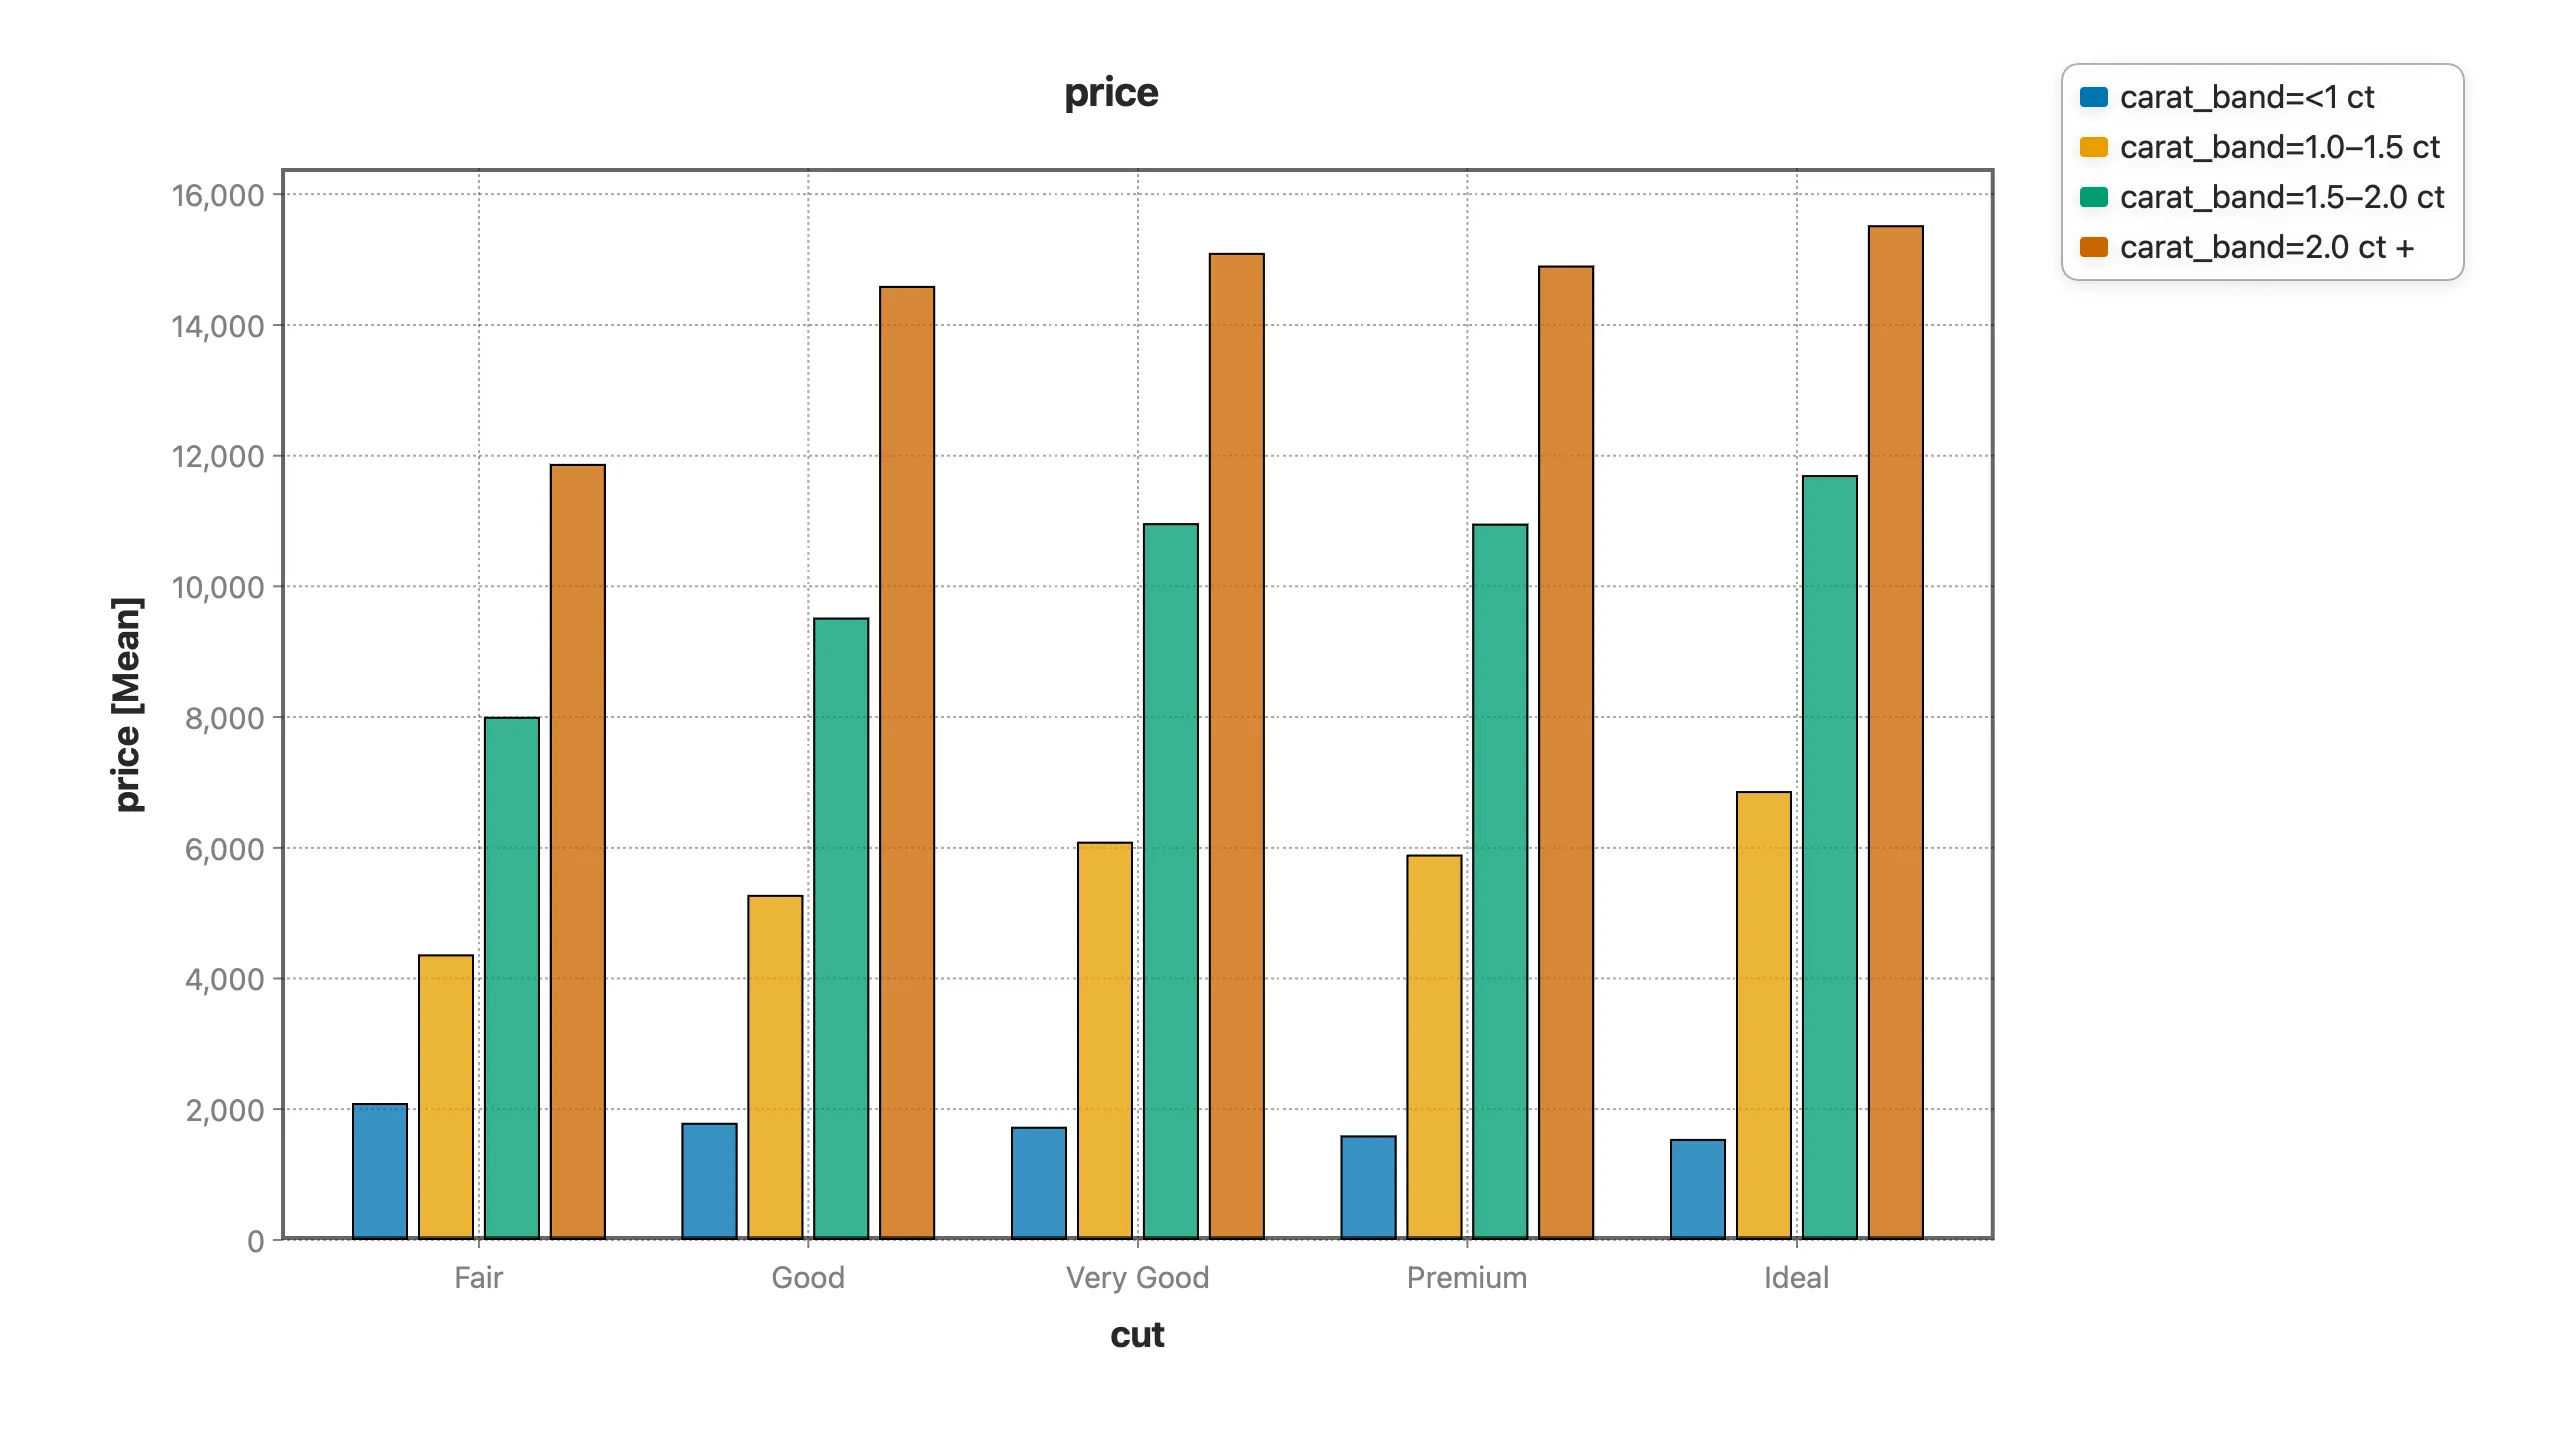
Inside a size band, the order flips back to sane: at equal size, a better cut costs more. The paradox didn't just fade — it reversed, which is the fingerprint of a genuine confounder rather than random noise.
The habit worth building
Before you believe any difference between groups, ask one question: what else differs between these groups? Ideal-cut diamonds differ from Fair-cut ones in cut — but also in size, and size is what your eyes were really seeing. A p-value won't save you here; an ANOVA on price by cut returns a tiny p-value and a completely misleading conclusion, because significance tests answer "do the groups differ?" not "why?"
Conditioning — through binning, stratification, or a regression that includes the confounder — is what turns a suggestive chart into a defensible claim. In the full analysis, a single multivariable regression does it in one step: cut alone explains under 2% of price, but once size is in the model, every quality grade lines up exactly the way a gemologist would predict.
Try it yourself
The diamonds dataset is free, and finding a confounder like this in Stratum is a few clicks — group, chart, condition, done, no code. It's the same move that protects you when the stakes are real: a drug that "works" until you notice which patients got it, a store format that "outsells" until you notice where those stores are.
Read the full Diamond Paradox analysis, watch the walkthrough, or try Stratum free.
Related: When to Log-Transform Skewed Data · Multiple Regression That Isn't Fooled by Confounders