 Stratum
How to Run a One-Way ANOVA on Mac & Windows
A t-test compares two groups; ANOVA compares three or more at once, without inflating your error rate. Here's how to run a one-way ANOVA on Mac or Windows and read every number it gives back.
When you have one measurement and a grouping variable with three or more levels — yield by supplier, score by teaching method, response by dose — you can't just run a stack of t-tests. Every extra comparison inflates the chance of a false positive. The analysis of variance (ANOVA) tests, in a single shot, whether any of the group means differ. On Mac or Windows, Stratum runs it without code.
Run the test
- Open your dataset and choose Analyze · ANOVA.
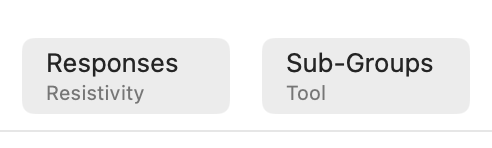
- Set the response (the numeric measurement) and the factor (the grouping variable).
- Read the ANOVA table — the F-statistic and its p-value.
How to read the result
ANOVA works by comparing two kinds of variation: the spread between the group means and the spread within each group. If the groups truly differ, the between-group variation is large relative to the within-group noise. The ratio of the two is the F-statistic — the larger it is, the more the groups stand apart. The p-value turns F into a decision:
- p < 0.05 — at least one group mean differs from the others (by the usual convention).
- p ≥ 0.05 — not enough evidence that the groups differ; that's not proof they're equal, often just a small sample.

Find which groups differ: Tukey HSD
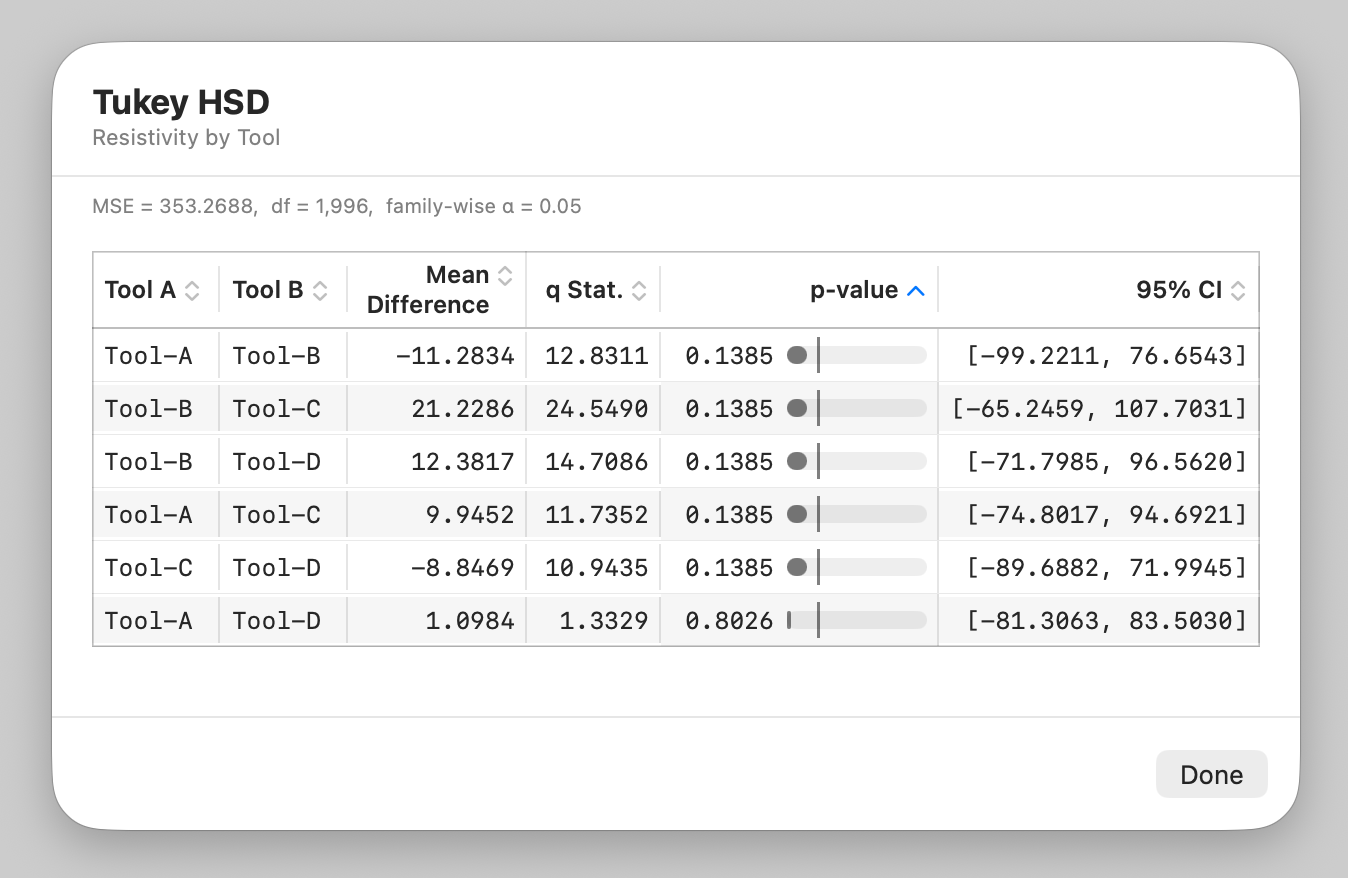
Right-click the ANOVA result row and choose Tukey HSD. Tukey's "honestly significant difference" compares every pair of groups while holding the overall error rate at your chosen level, so you can read off exactly which groups differ from which — the practical payoff of the whole analysis.
Check the assumptions
An ANOVA's p-value is only trustworthy if its assumptions roughly hold — normality within groups, similar spread across groups, and independent observations. Stratum can run Levene's test for equal variances right from the ANOVA result's menu, and you can eyeball normality with a Q-Q plot or spread with a box plot by group. We cover all three in ANOVA Assumptions Explained.
From result to report
Stratum's ANOVA output is a clean report table you can copy or export to CSV, Markdown, HTML, or PDF — alongside a means plot for the figure in your write-up. And because analyses save inside the native .stratum document, reopening the file brings the test back exactly as you left it.
For the complete walk-through — sums of squares, two-way models, and post-hoc options — see Lesson 15 of the Stratum tutorial.
Frequently asked questions
When should I use ANOVA instead of a t-test?
Use a t-test for exactly two groups. Use ANOVA for three or more — running multiple t-tests instead inflates the false-positive rate with every extra comparison.
What does a significant ANOVA actually tell me?
Only that the groups are not all equal — at least one mean differs. To find which specific pairs differ, follow it with a post-hoc test such as Tukey HSD.
Can I run ANOVA on Mac & Windows without R, Python, or SPSS?
Yes. Stratum is a native app for Mac & Windows: pick a response and a factor, and it reports the F-statistic, p-value, Tukey HSD, and Levene's test — no scripting or notebooks.