 Stratum
ANOVA Assumptions Explained: Normality, Equal Variance, Independence
ANOVA rests on three assumptions. Knowing what they are — and how much each one actually matters — is the difference between a p-value you can trust and one you can't.
The analysis of variance is remarkably useful, but its p-value is only as good as the assumptions behind it. There are three, and they're easy to remember: normality, equal variance, and independence. Here's what each means, how to check it on your own data, how much it actually matters when it's bent — and a quick pre-flight checklist to run before you trust a result.
1. Normality (within groups)
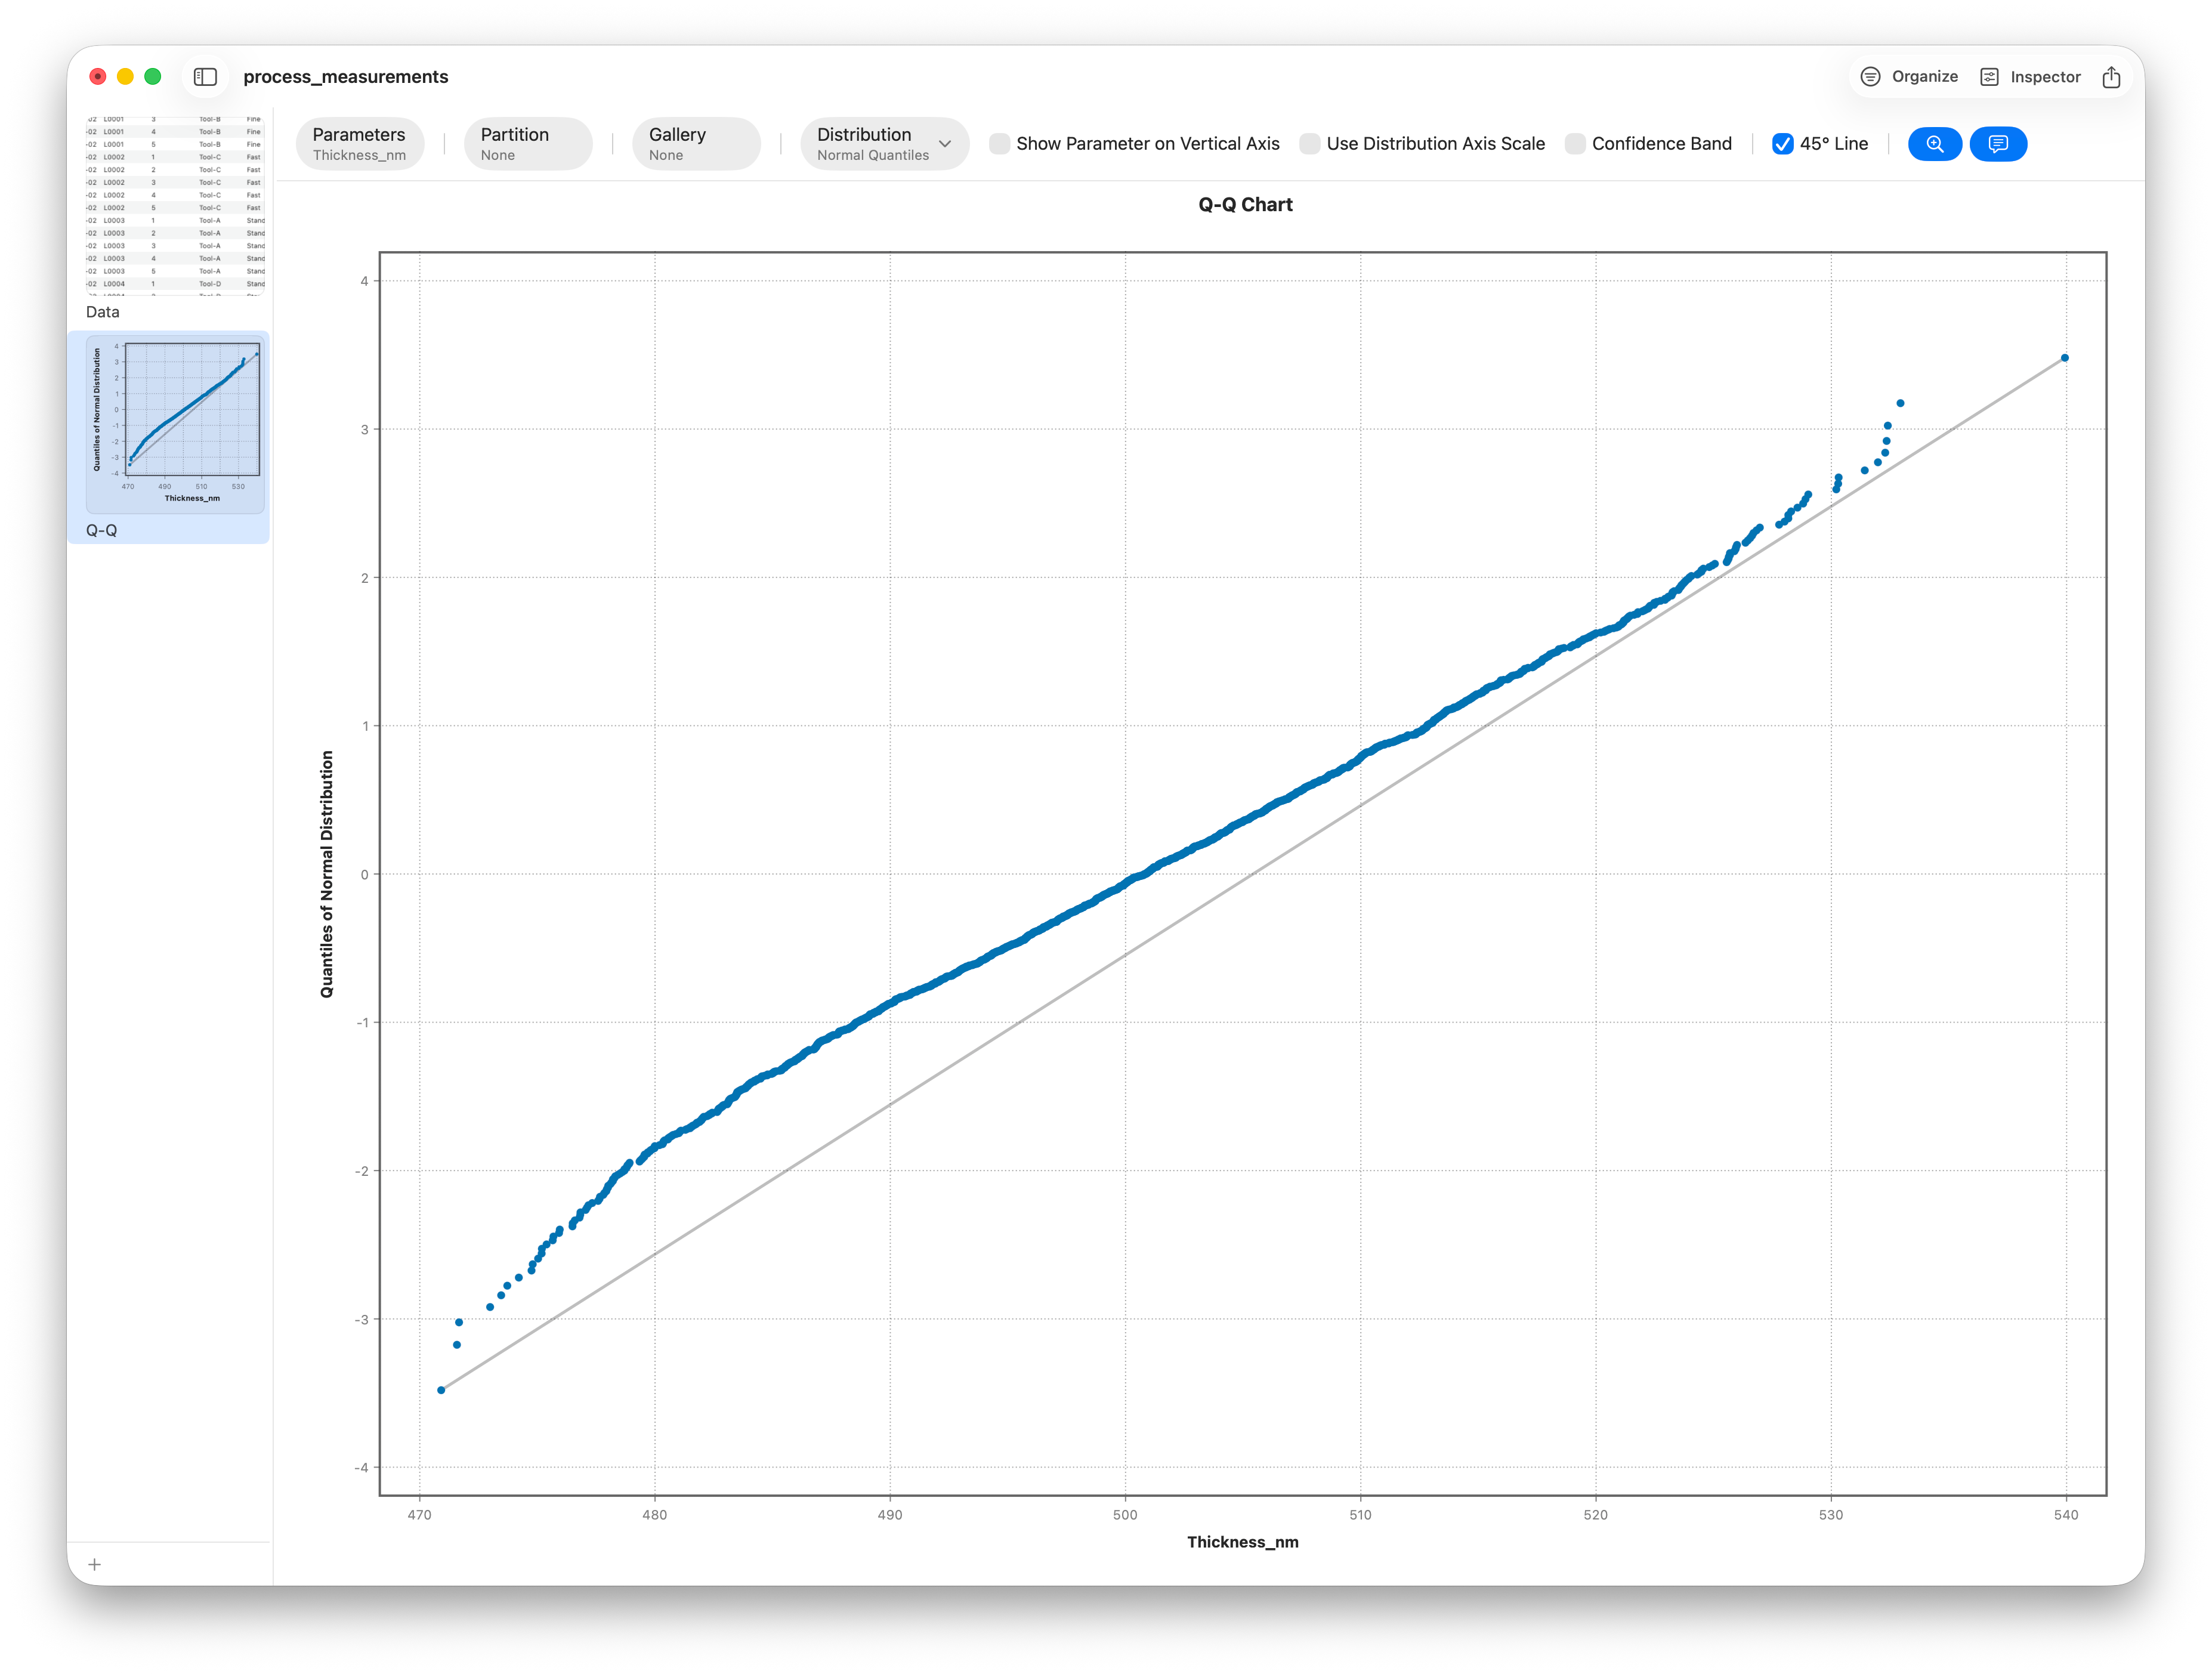
ANOVA assumes the values within each group are roughly normally distributed (technically, that the model's residuals are). You do not need a textbook bell curve. Thanks to the central limit theorem, the test is fairly robust to mild non-normality, especially when groups are reasonably large and balanced. The real risks are heavy skew and long, heavy tails.
How to check: a Q-Q plot is the quickest read — points hugging the diagonal mean approximately normal, while a curved or S-shaped pattern signals skew or heavy tails. Stratum's Summary report also includes an Anderson–Darling normality test if you want a formal number, though with large samples even trivial departures turn up "significant," so trust the plot over the p-value.
2. Equal variances (homogeneity)
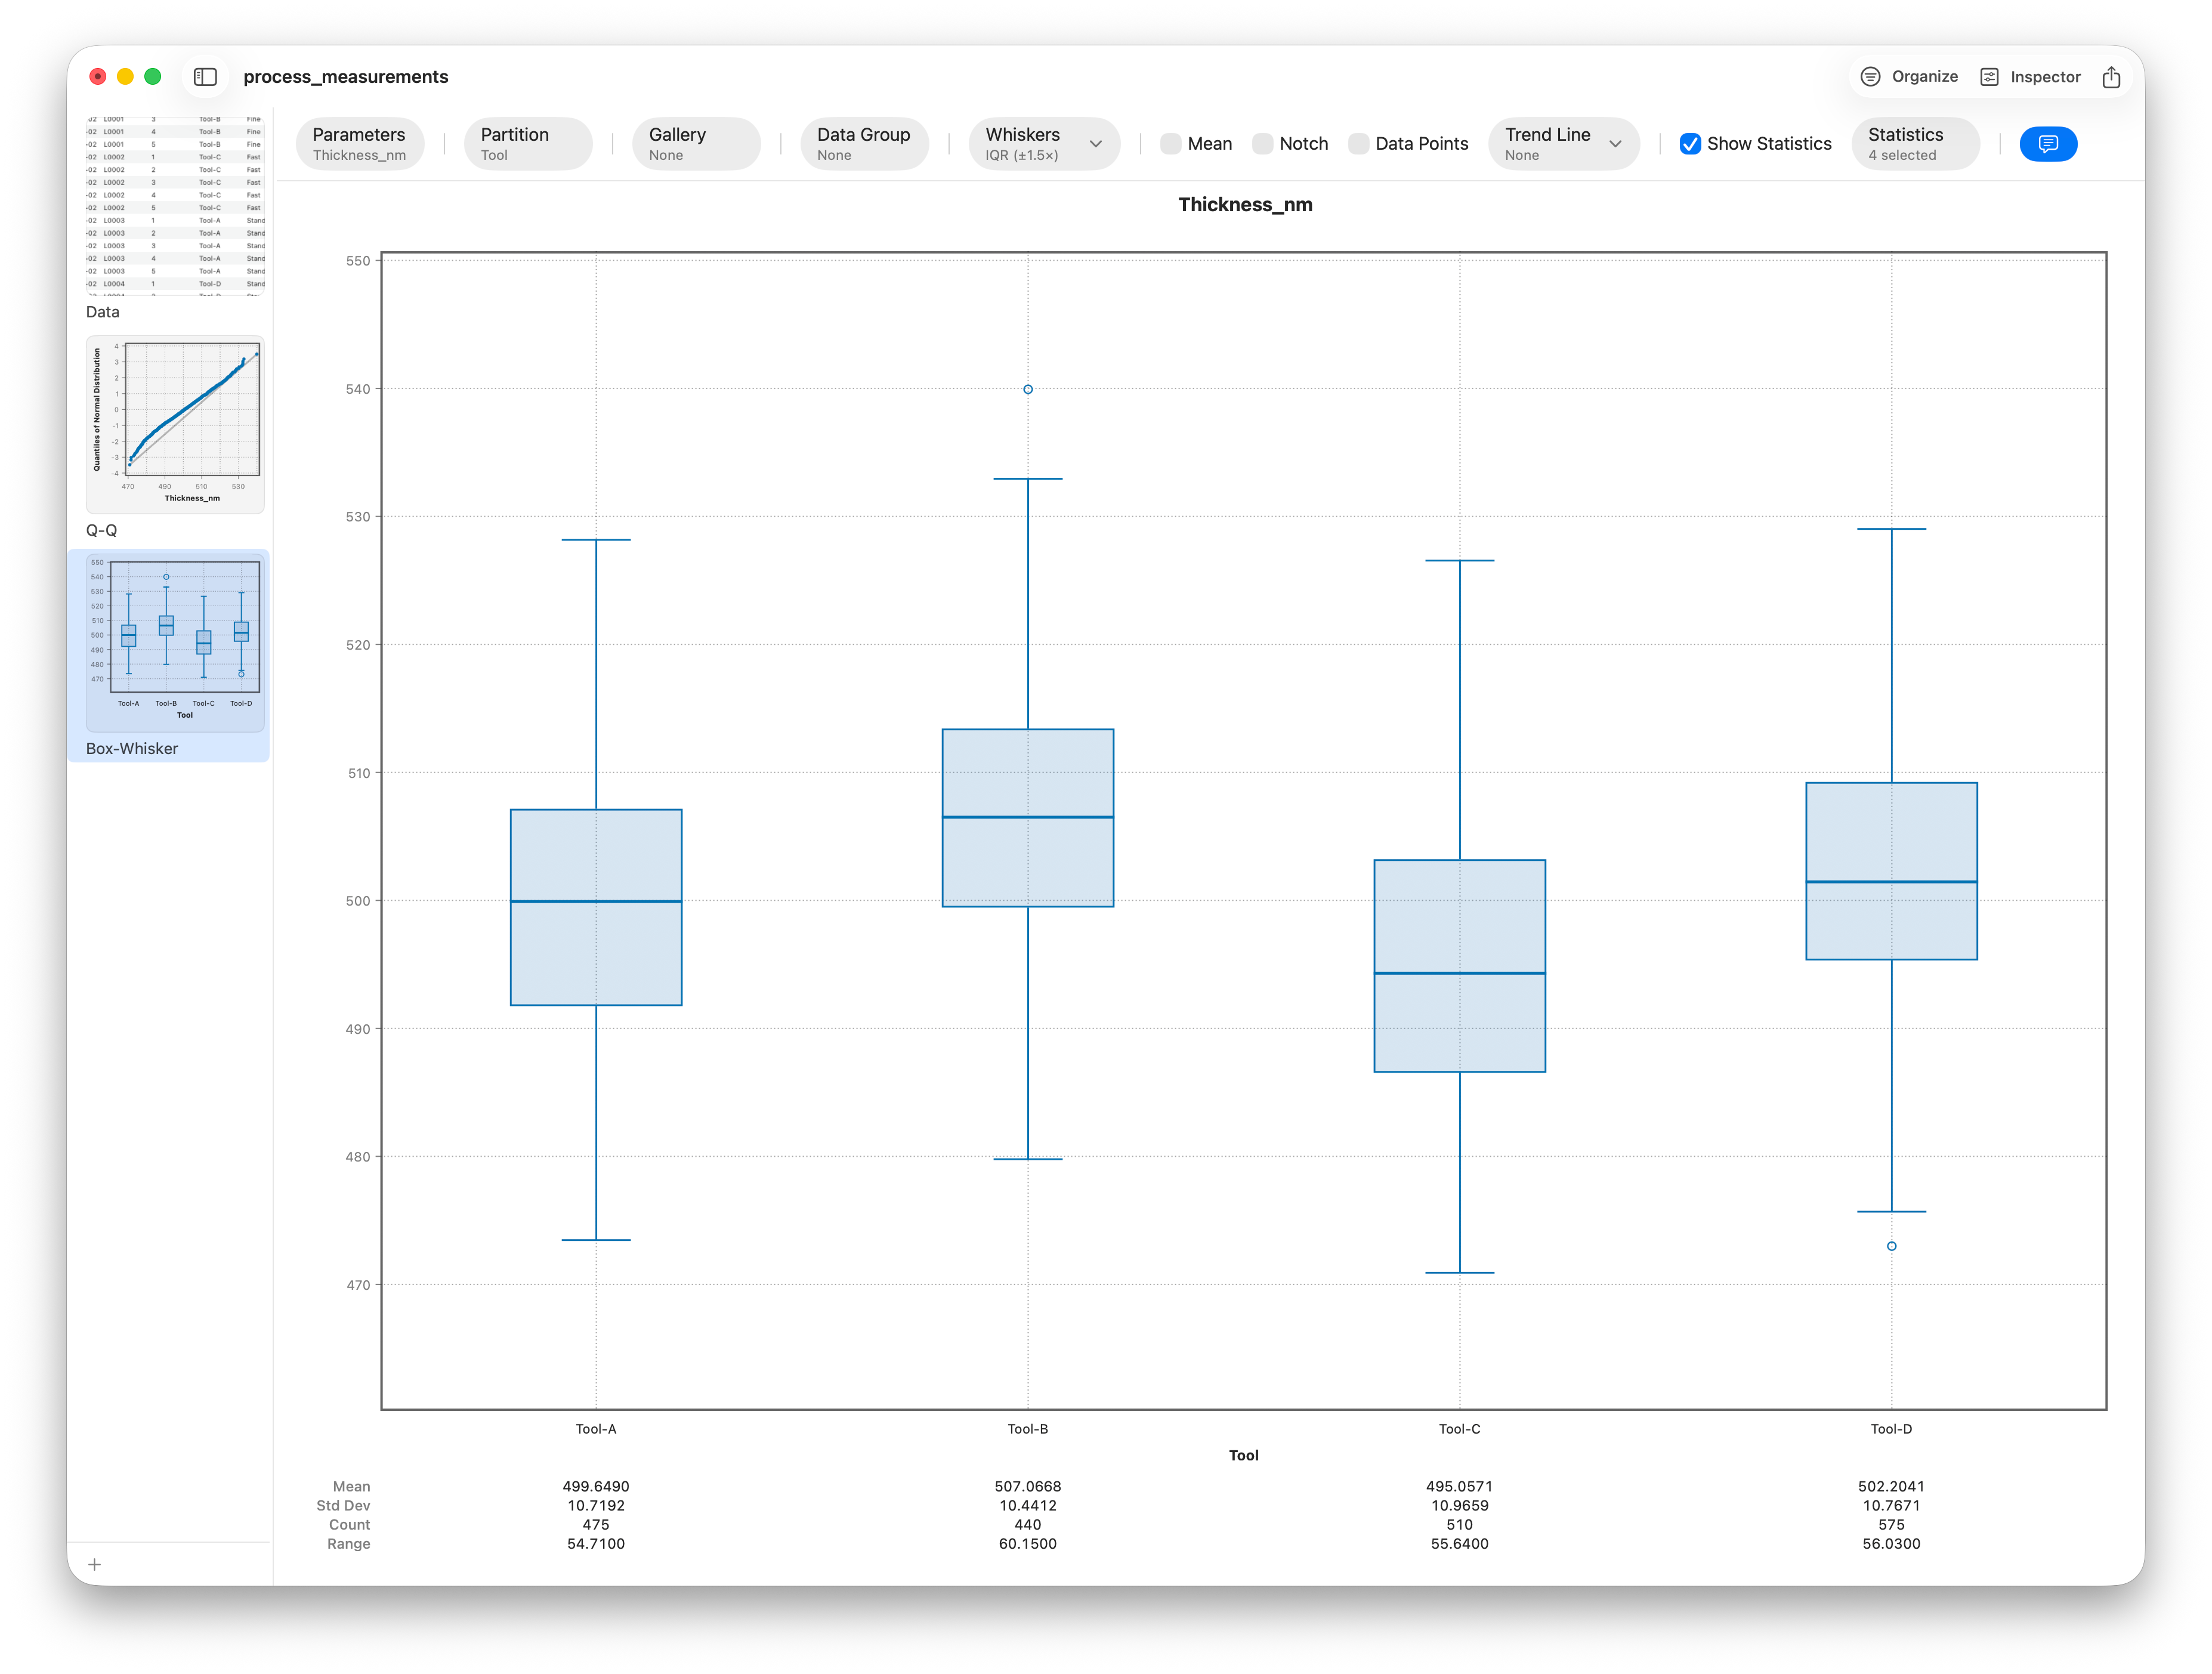
Classic ANOVA assumes every group has about the same spread. If one group is far more variable than the others, the F-test can mislead — and the danger is worst when the group sizes are also unequal, because the math leans on the smaller groups in ways you don't want.
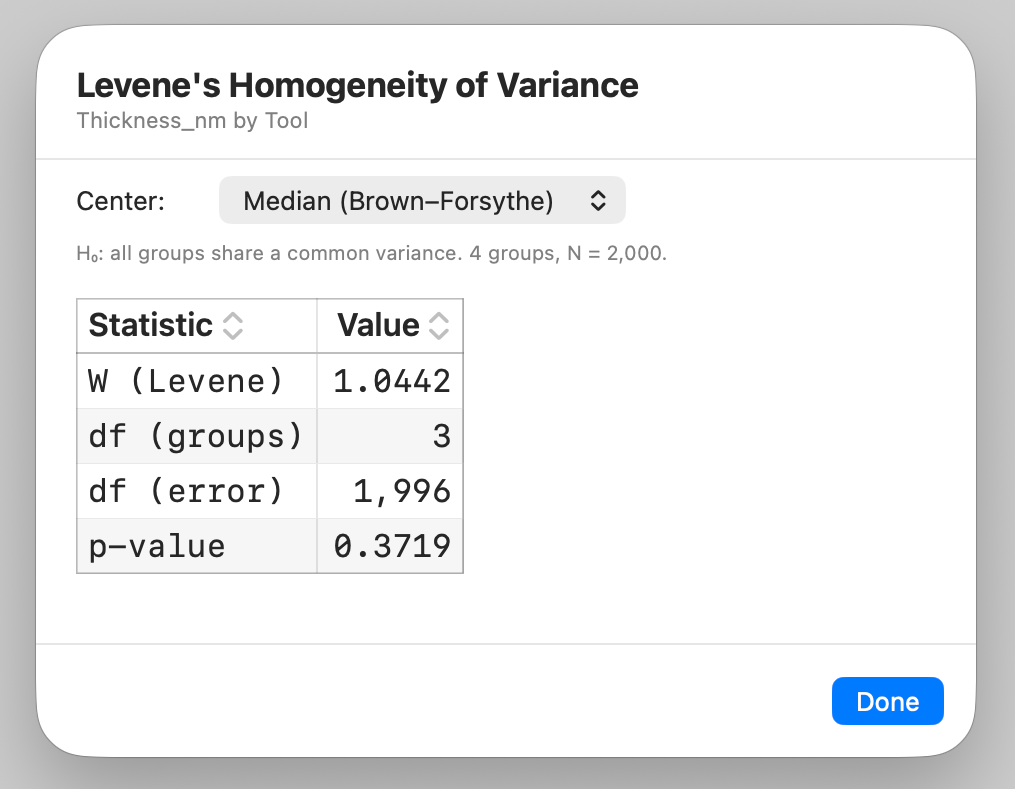
How to check: a box plot by group makes unequal spread obvious — just compare the box heights — and Stratum can run Levene's test for homogeneity of variance directly from the ANOVA result's menu. A small Levene's p-value is a flag that the spreads differ.
3. Independence
Each observation should be independent of the others: one measurement shouldn't influence another. Unlike the first two, this assumption can't be checked from the data or repaired after the fact — it's a property of how the data was collected. Repeated measurements on the same subject, values clustered in time, or samples drawn from the same batch all violate it and call for a different model.
How robust is ANOVA, really?
More than people fear, with two big caveats. With balanced groups (similar sample sizes) and a decent number of observations per group, ANOVA shrugs off moderate non-normality and even fairly unequal variances. The central limit theorem is doing the heavy lifting: the test cares about the distribution of group means, which trend normal as samples grow, not the raw values. The robustness evaporates when problems combine — unequal variances and unequal group sizes, or small samples and heavy skew. That's when a "significant" result can be an artifact rather than a real difference.
What to do when they don't hold
- Non-normal / skewed: a transformation (log or square-root) often pulls a skewed variable back toward normal; re-check with the Q-Q plot afterward. If it stays badly non-normal, use a nonparametric comparison that doesn't assume normality.
- Unequal variances: keep group sizes as balanced as you can, and prefer a method that doesn't pool the variances across groups.
- Non-independent: don't patch it — switch models. The data has structure (pairing, repeated measures, clustering) that a one-way ANOVA ignores, and modeling that structure is the fix.
A pre-flight checklist
- Plot a box plot by group — are the spreads roughly similar?
- Plot a Q-Q plot (or per-group histograms) — any heavy skew or fat tails?
- Are the group sizes reasonably balanced?
- Were the observations collected independently (no repeated measures, no clustering)?
- Only if a number is needed for the write-up: Levene's and Anderson–Darling.
Ready to put it together? See How to Run a One-Way ANOVA, or the full ANOVA lesson.
Frequently asked questions
Does my data have to be perfectly normal for ANOVA?
No. ANOVA is robust to mild non-normality, especially with larger, balanced groups. Worry about heavy skew and long tails, not small wiggles — check with a Q-Q plot.
How do I test for equal variances?
Compare group spreads on a box plot, and run Levene's test (available from the ANOVA result's menu in Stratum). A small Levene's p-value flags unequal variances.
What if my ANOVA assumptions are violated?
Transform a skewed response, keep groups balanced for unequal variances, or switch to a nonparametric test. For non-independent data (repeated measures, clustering), use a model built for that structure instead.
Which assumption matters most?
Independence — it's about how the data was collected and can't be fixed afterward. Normality and equal-variance violations are usually survivable on their own; the real trouble is when they combine with unbalanced group sizes.
Do I need a formal test, or is a plot enough?
For most decisions a box plot (variance) and Q-Q plot (normality) are enough and more honest than a p-value, since large samples make assumption tests flag trivial departures. Use Levene's / Anderson–Darling when you need a number to report.