Statistical methods · Mac & Windows
Get the analysis done today, without learning a language first. ANOVA, regression with full diagnostics, PCA, MANOVA, correspondence analysis, clustering and decision trees — point and click, with output ready to put straight in a paper. Native on Mac and Windows, one payment instead of a yearly one. Free to try on your own data before you decide.
Most of the packages that carry these methods are sold per user per year, and the multivariate and data-mining pieces are often priced on top of the base. Whatever the number comes to, it returns every year, and access stops when you stop paying.
Five years, five bills — and no software left if you stop.
Bought once, with the multivariate and data-mining methods inside Professional rather than sold as modules. The version you buy keeps working forever, on Mac and Windows alike.
$249 for Professional — once, and it’s yours.
| Method | Edition |
|---|---|
| Descriptive statistics — nearly 50 per column, with Kruskal-Wallis, Mann-Whitney, Wilcoxon and Dunn alongside the t-tests | Standard ($119) |
| ANOVA — one-way and factorial with Type I/II/III sums of squares, η², ω² and ε², Tukey-Kramer, Games-Howell, Welch | Standard |
| Correlation — Pearson, Spearman and Kendall, with Bonferroni or FDR correction, scatter matrices, contingency & chi-square | Standard |
| Regression — categorical, interaction and polynomial terms, full diagnostics, prediction intervals, best-subsets selection | Standard |
| Distribution fitting — normal, lognormal, Weibull and exponential, with goodness-of-fit tests and four normality tests | Standard |
| Curve fitting — quadratic through cubic, power, exponential, logarithmic, LOWESS and kernel smoothers | Standard |
| PCA with KMO and Bartlett’s test, MANOVA (Wilks’, Pillai, Hotelling-Lawley, Roy), correspondence analysis | Professional ($249) |
| Cluster analysis — k-means with silhouette and an elbow plot, hierarchical with Ward, complete, average or single linkage | Professional |
| Decision trees with cross-validated pruning, random forests with out-of-bag error, boosted trees with early stopping, partial-dependence plots | Professional |
| Held-out validation and model comparison — seeded splits, confusion matrices, test AUC | Professional |
| Linked selection — one row selection across the datasheet and every chart, so picking points on one highlights them everywhere | Standard |
| SPC — nine control charts, all eight Nelson rules, Phase I/II staging, capability with Cpm, Z-bench, confidence intervals and non-normal fits | Professional |
| Numerical validation | Published validation record — the outside tool named for every statistic, including the gaps |
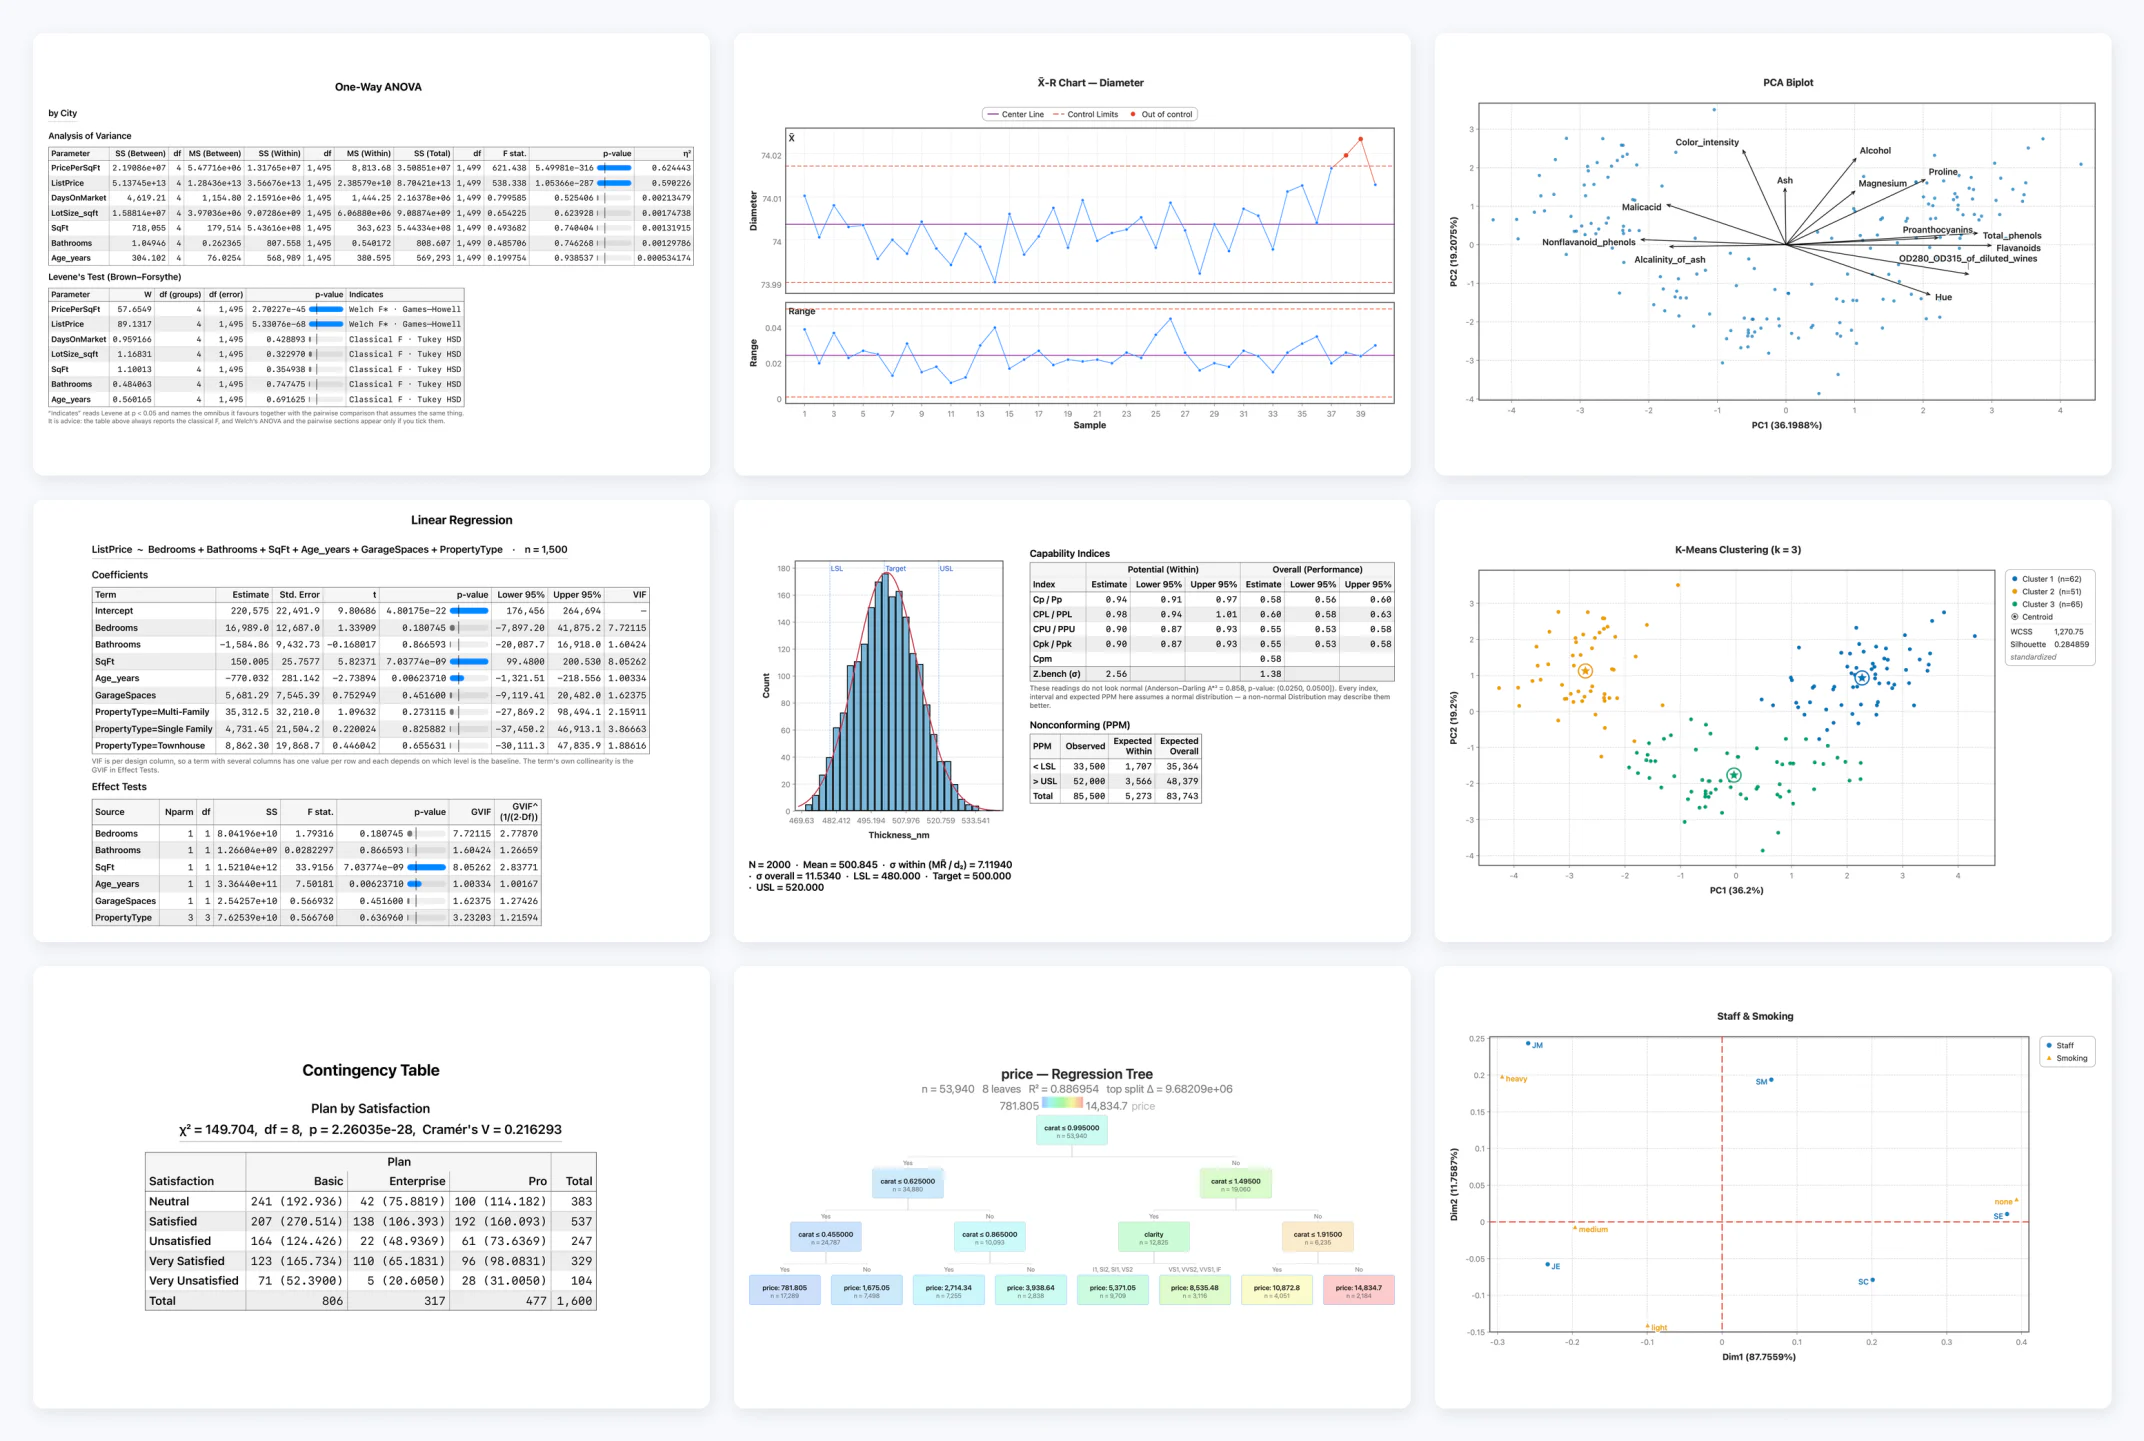
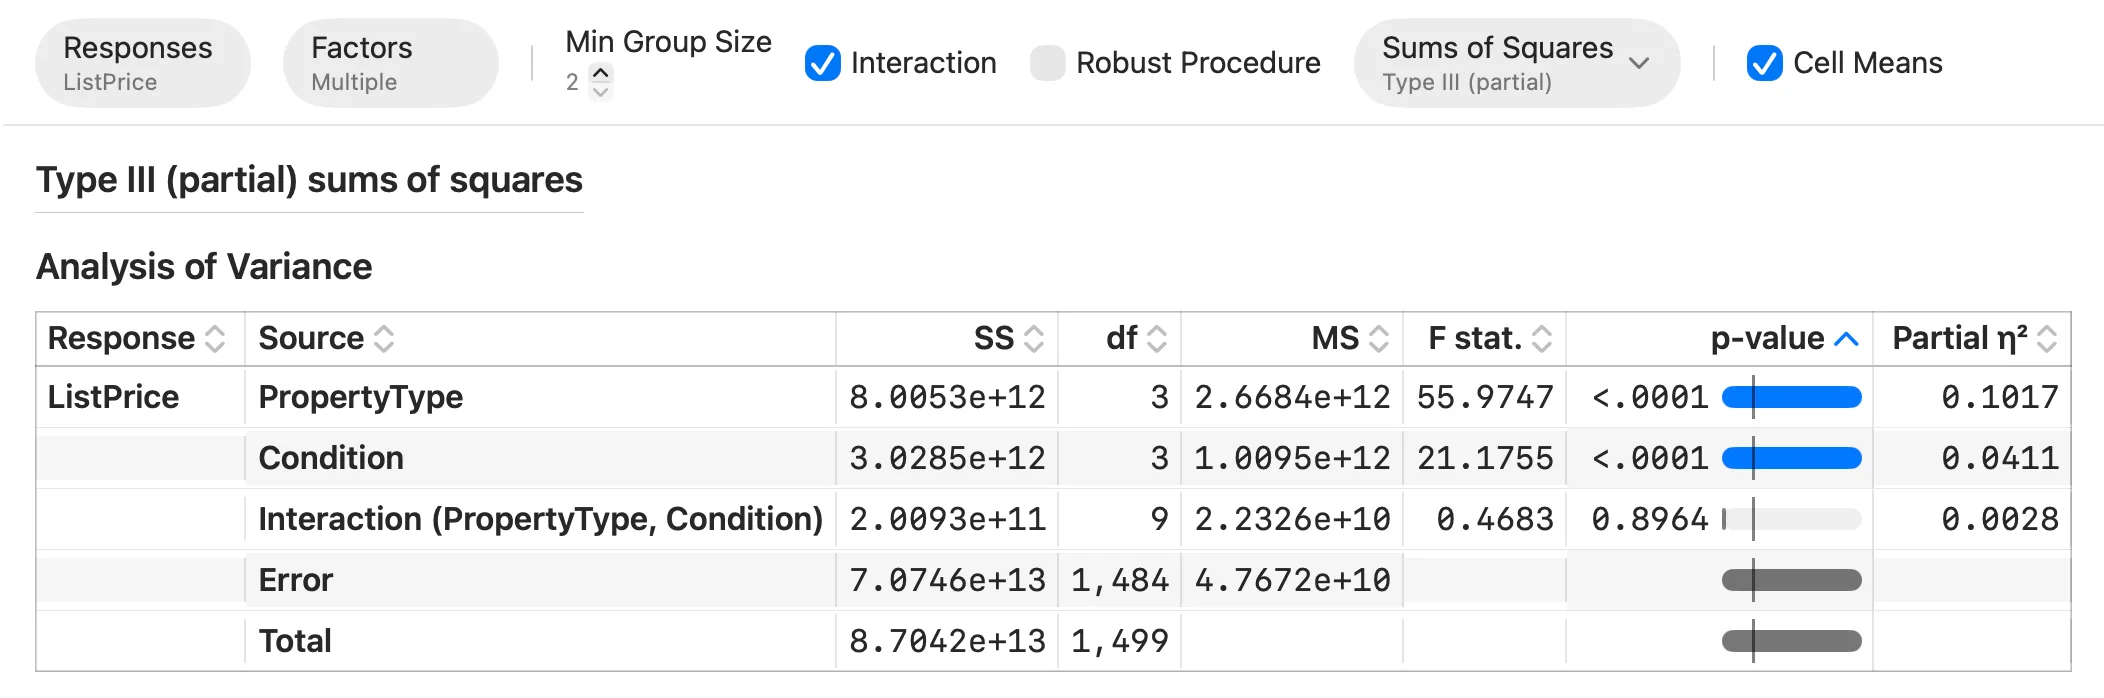
ANOVA — one-way and factorial: SS, df, MS, F, p and η², with Tukey HSD, and Welch / Games-Howell when variances differ. More on ANOVA → Standard.
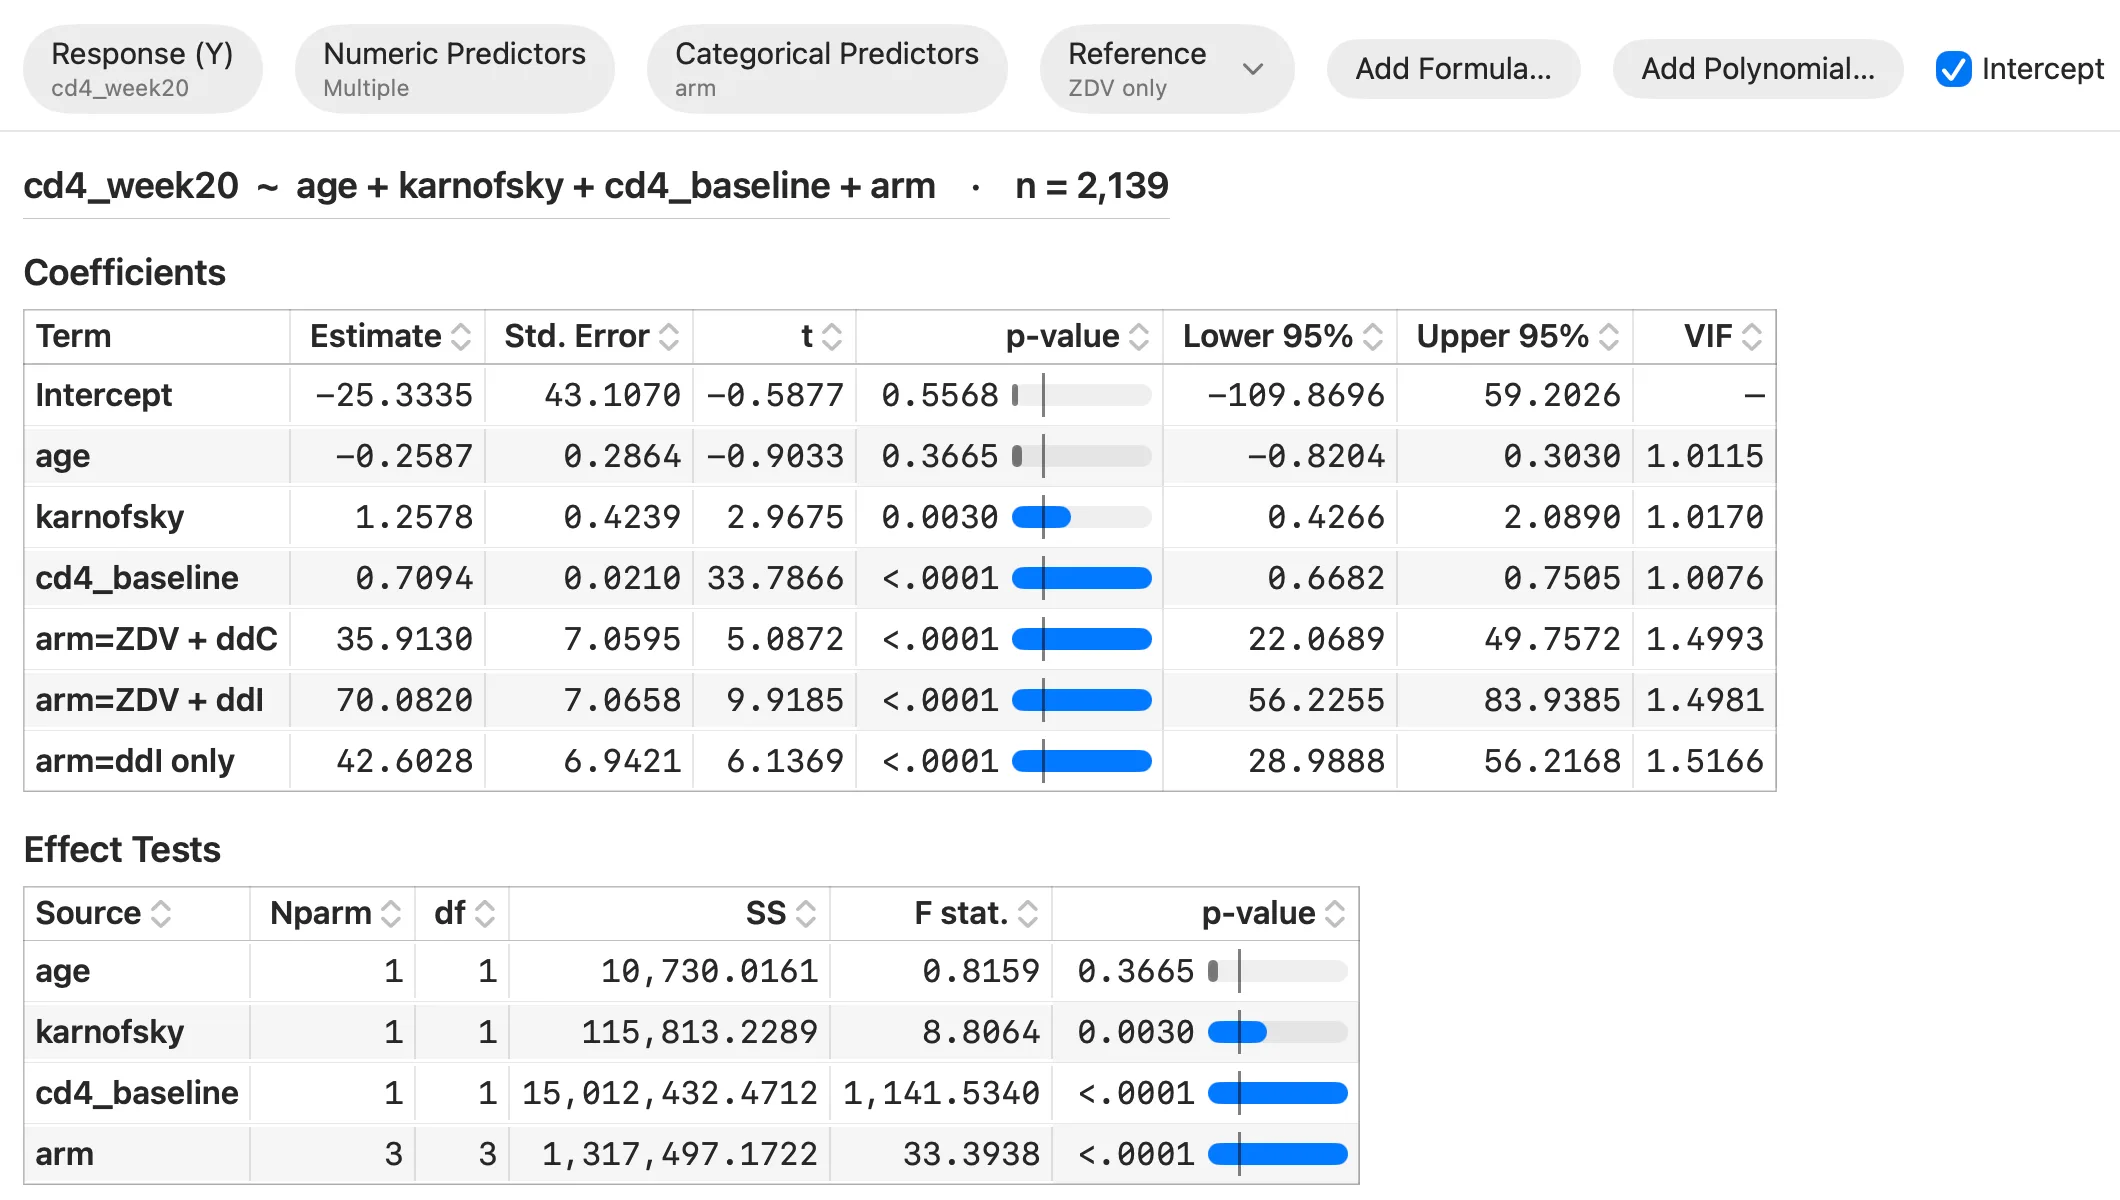
Linear Regression — coefficients with SEs, t, p and CIs, plus VIF, leverage, Cook’s D, residual and Q-Q plots, R², AIC and BIC. More on regression → Standard.
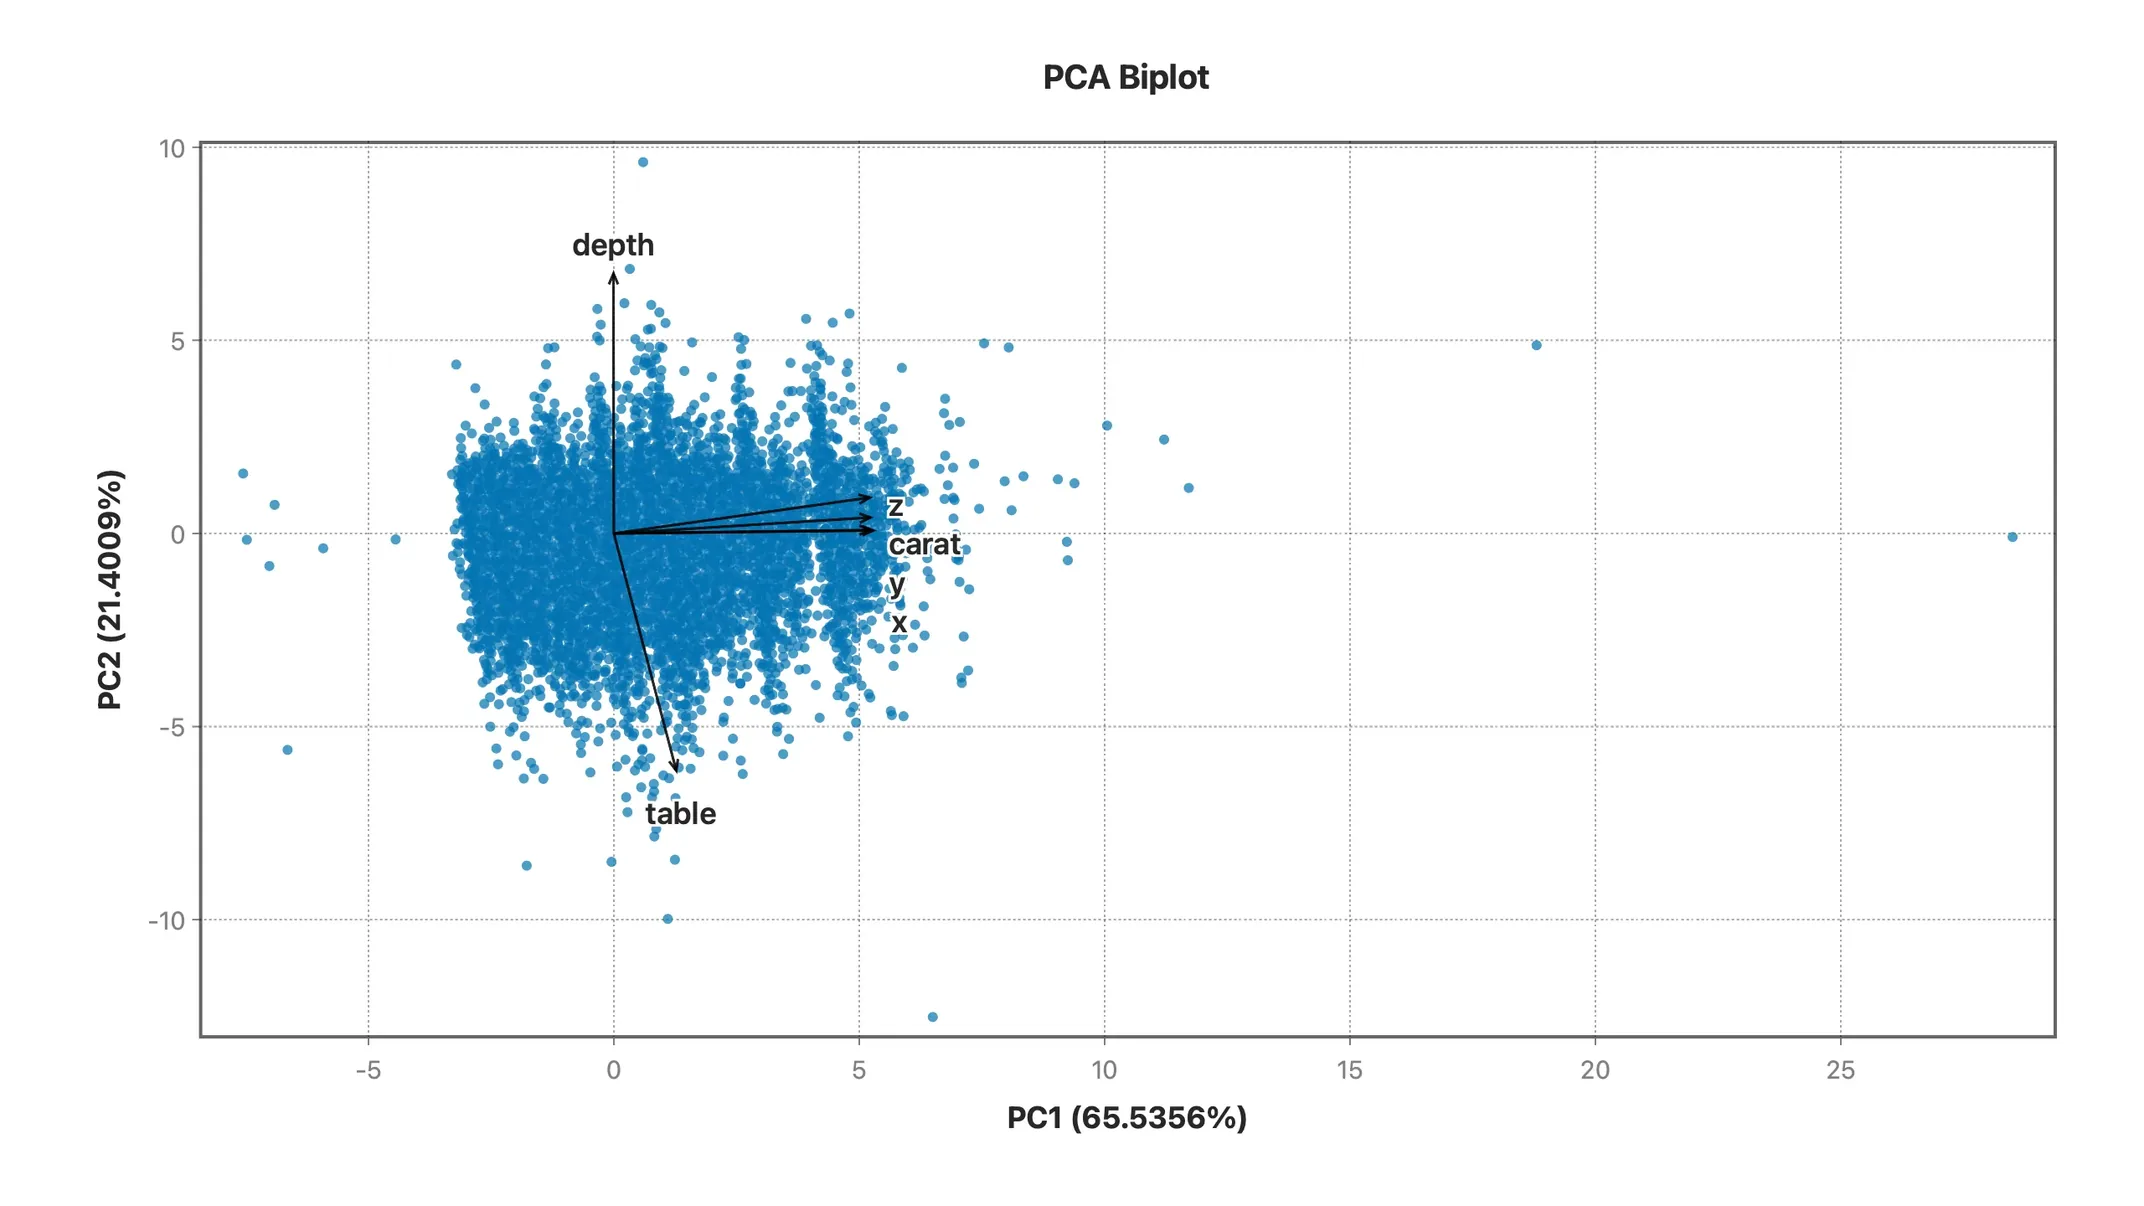
PCA — eigenvalues, explained variance, loadings, scree plot and biplot, on a correlation or covariance basis. More on PCA → Professional.
MANOVA — Wilks’ lambda, Pillai’s trace, Hotelling-Lawley and Roy’s largest root, with univariate follow-ups. Professional.
Correspondence Analysis — row and column coordinates, inertia by dimension, and a symmetric biplot. Rarely found outside the expensive packages. Professional.
Clustering — k-means and hierarchical with a dendrogram, standardization options and cluster profiles. Professional.
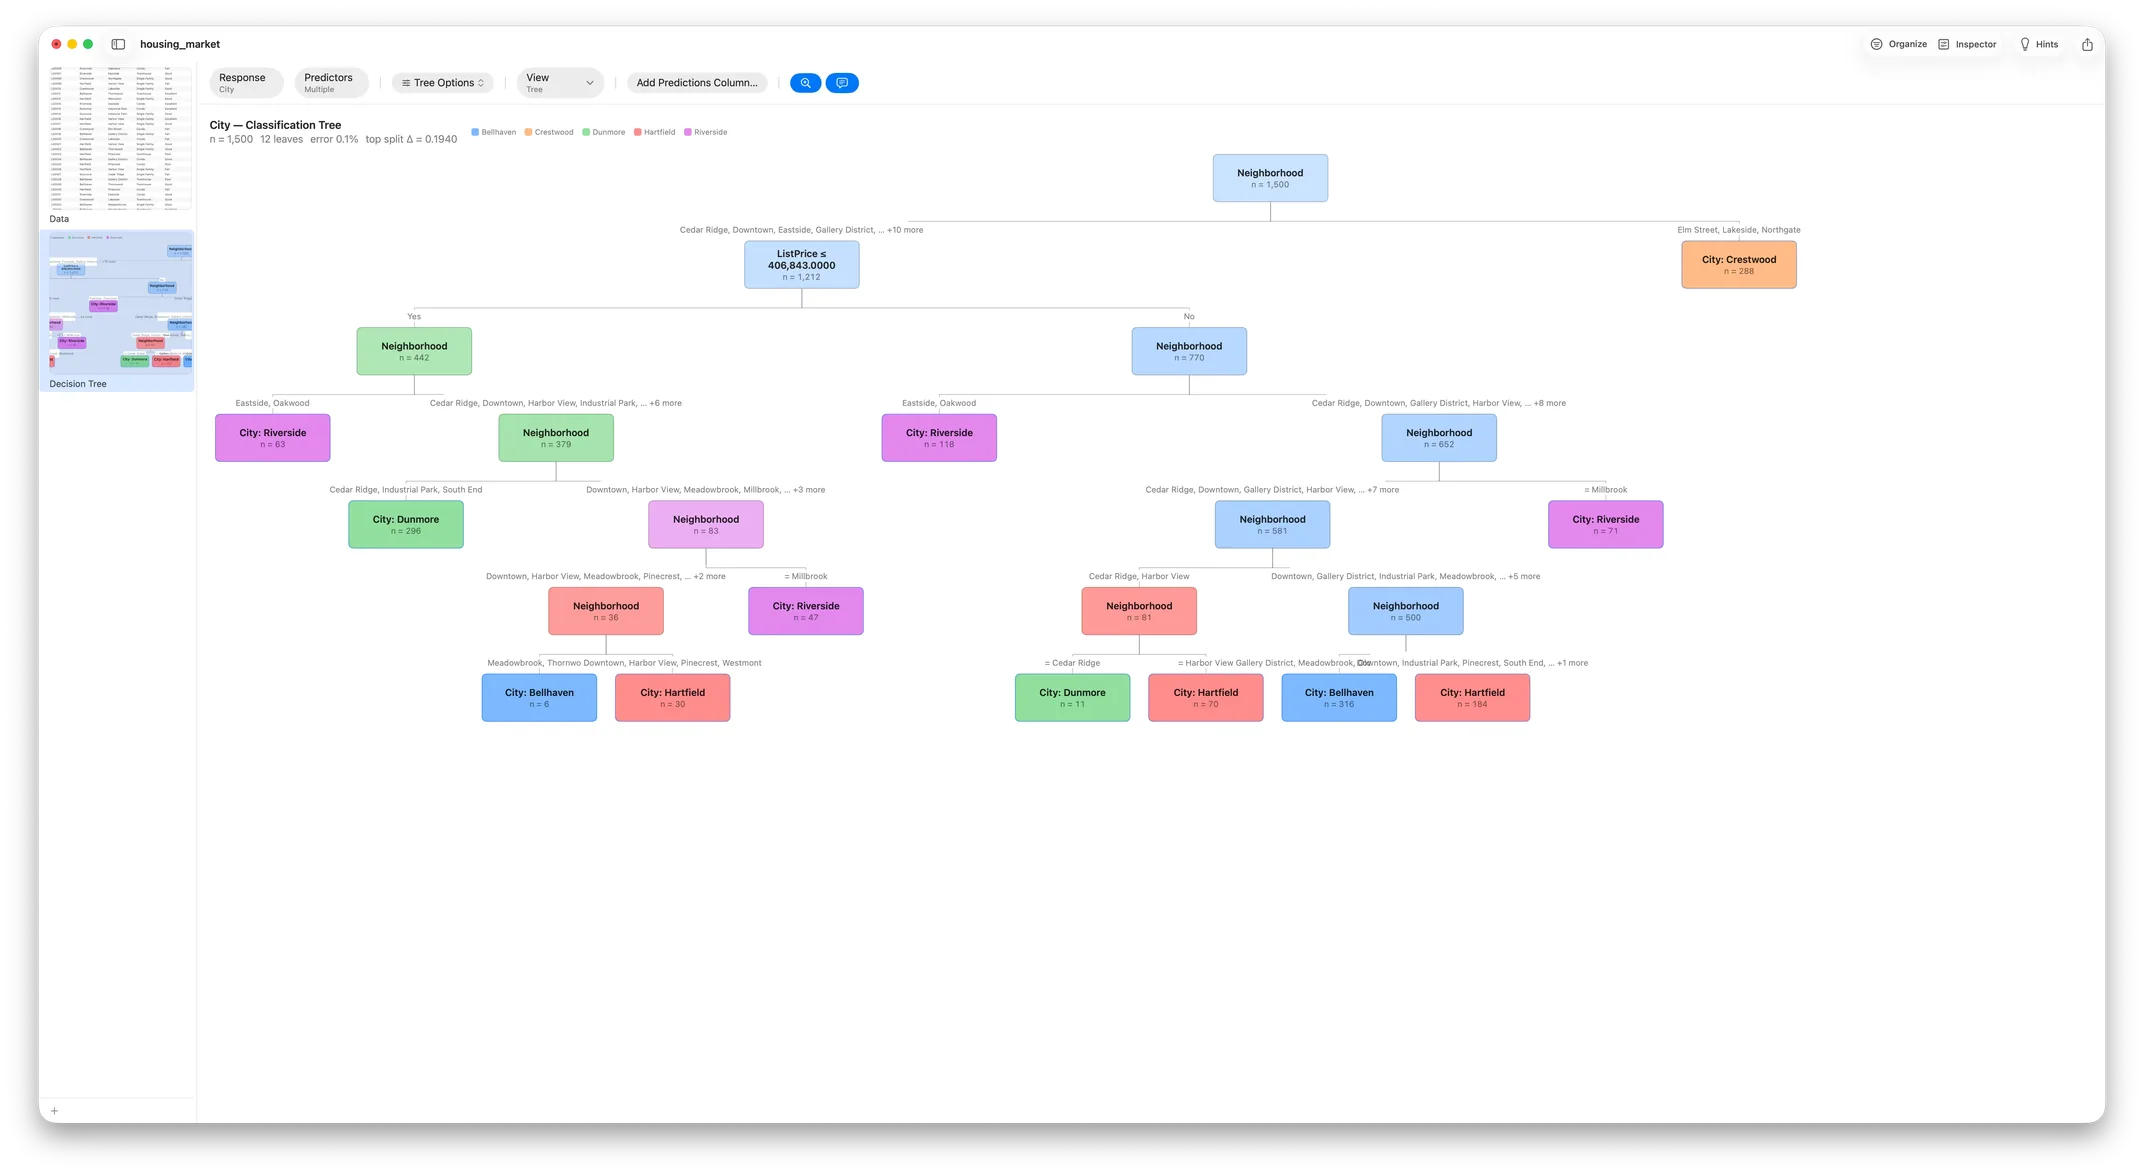
Decision Tree — classification trees for categorical outcomes, regression trees for numeric ones, with split criteria, depth control and variable importance. Random forests and boosted trees alongside. More on decision trees → Professional.
Control Charts — I-MR, X̄, p, c, CUSUM and EWMA with all eight Nelson rules, plus Cp, Cpk, Pp and Ppk. More on SPC → Professional.
Correlation, Contingency — Pearson and Spearman matrices, scatter matrices; chi-square, Fisher’s exact, Cramér’s V and mosaic plots. Standard.
Summary, t-tests — means, SD and quartiles by group; two-sample and paired t, with Mann-Whitney, Wilcoxon and Kruskal-Wallis. Standard.
Every method above is point-and-click and reports its diagnostics by default — and each one is checked against a named outside tool.
Both editions are one-time purchases, and you can upgrade from Standard to Professional later. Nothing above is an add-on module priced on top.
No. Every method here is menu-driven, and the diagnostics come with the result rather than as a separate request. Nothing to install, nothing to import, no syntax to remember between sessions.
Classification trees for a categorical outcome and regression trees for a numeric one, with control over split criteria, depth and minimum leaf size, plus variable importance. Random forests and boosted trees are in the same edition.
Yes — Stratum is equally native on macOS 14+ and Windows 10/11, on the same license, and the multivariate methods behave identically on both.
Yes. The validation record names the outside tool each statistic is verified against, analysis by analysis, and records every place Stratum deliberately differs.
Yes, and you should. The 10-day trial is the complete app, with no card and no account. Import your own file and run the method you actually need before deciding.
 Stratum