Blog · Category
Step-by-step guides for getting a specific job done in Stratum — short, practical, and reproducible.

Check whether your data is normal — read the line, spot skew and tails.
Sep 30, 2026 · 6 min read
An interpretable model: grow it, prune it, read importance, and predict.
Sep 23, 2026 · 7 min read
Compare groups by full distribution shape — and spot bimodality a box plot hides.
Sep 16, 2026 · 6 min read
See every variable pair at once with the Scatter chart's Matrix mode.
Sep 9, 2026 · 6 min read
Build a model from menus, read R² and coefficients, and check the diagnostics.
Aug 28, 2026 · 7 min read
Reduce many variables to a few components; read the scree plot and biplot.
Aug 19, 2026 · 7 min read
I-MR and X-bar charts with control limits and automatic Nelson-rule flagging.
Aug 12, 2026 · 7 min read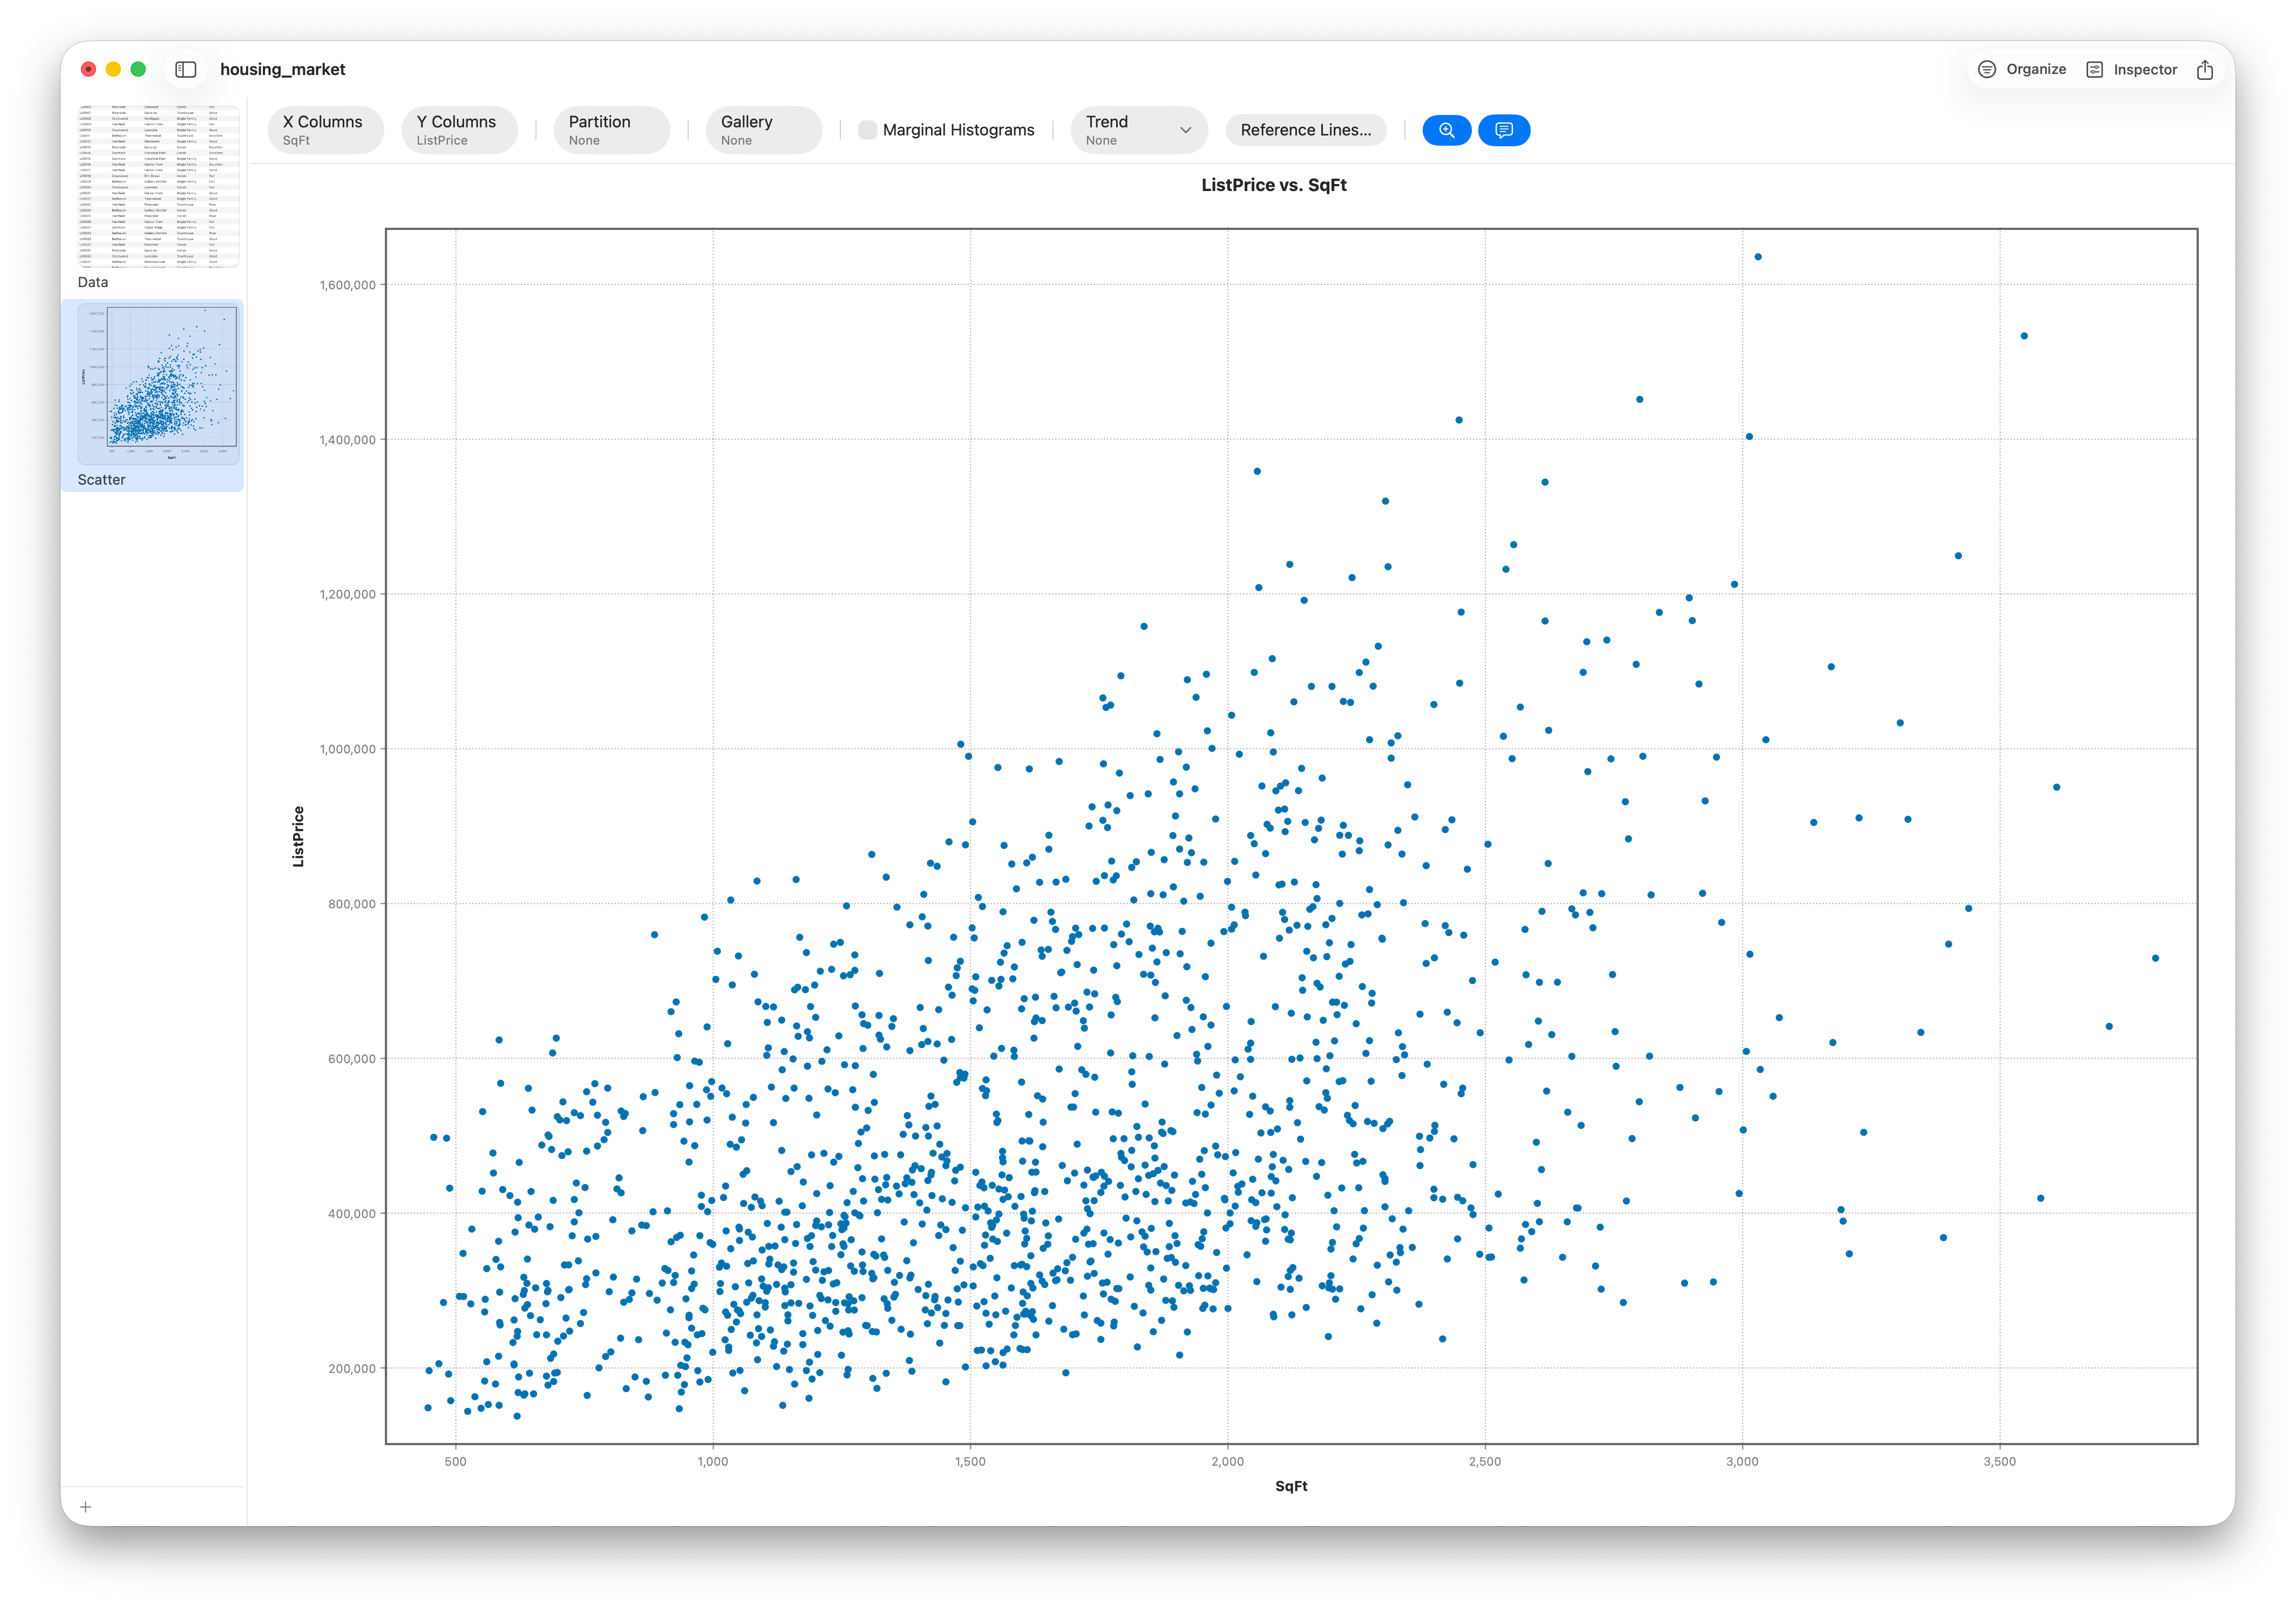
Plot two variables, add a line of best fit, and read the correlation.
Jul 31, 2026 · 6 min read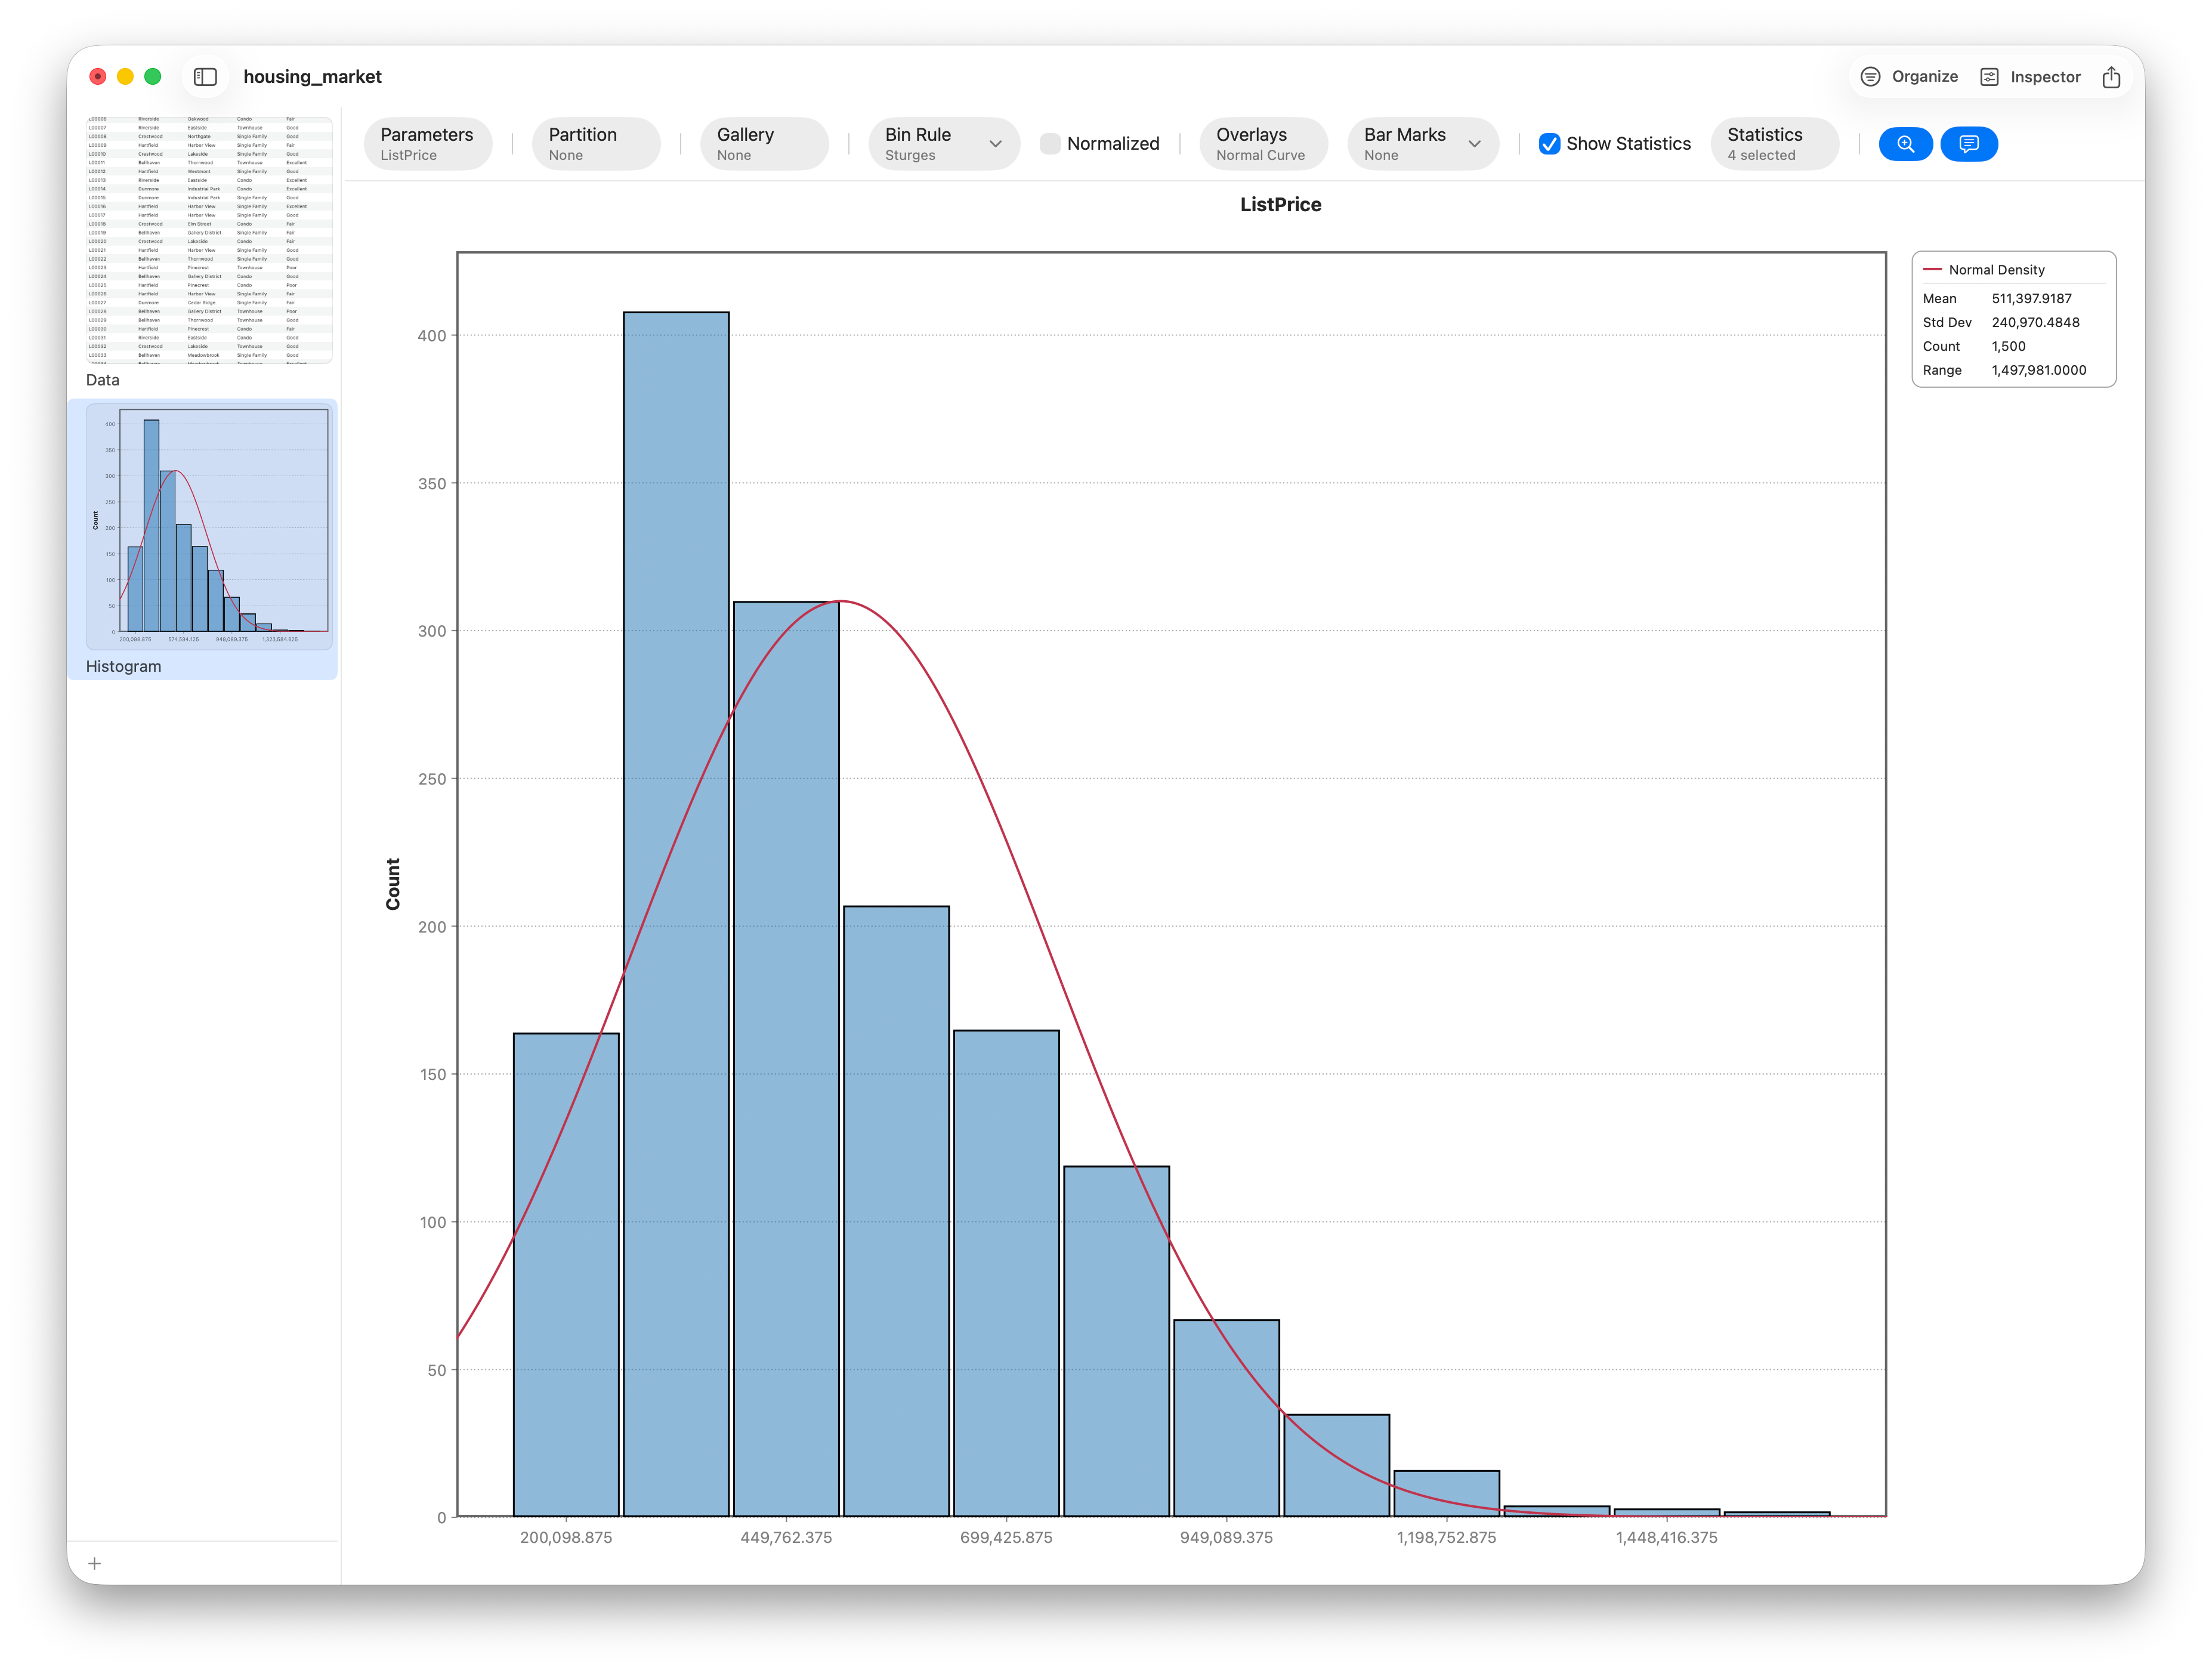
See the shape of a variable — pick bins, read skew, and export.
Jul 24, 2026 · 6 min read
Compare three or more group means, read F and p, and run a Tukey post-hoc.
Jul 15, 2026 · 8 min read
Compare two groups and read the result in under a minute — no code, no notebooks.
Jul 10, 2026 · 6 min read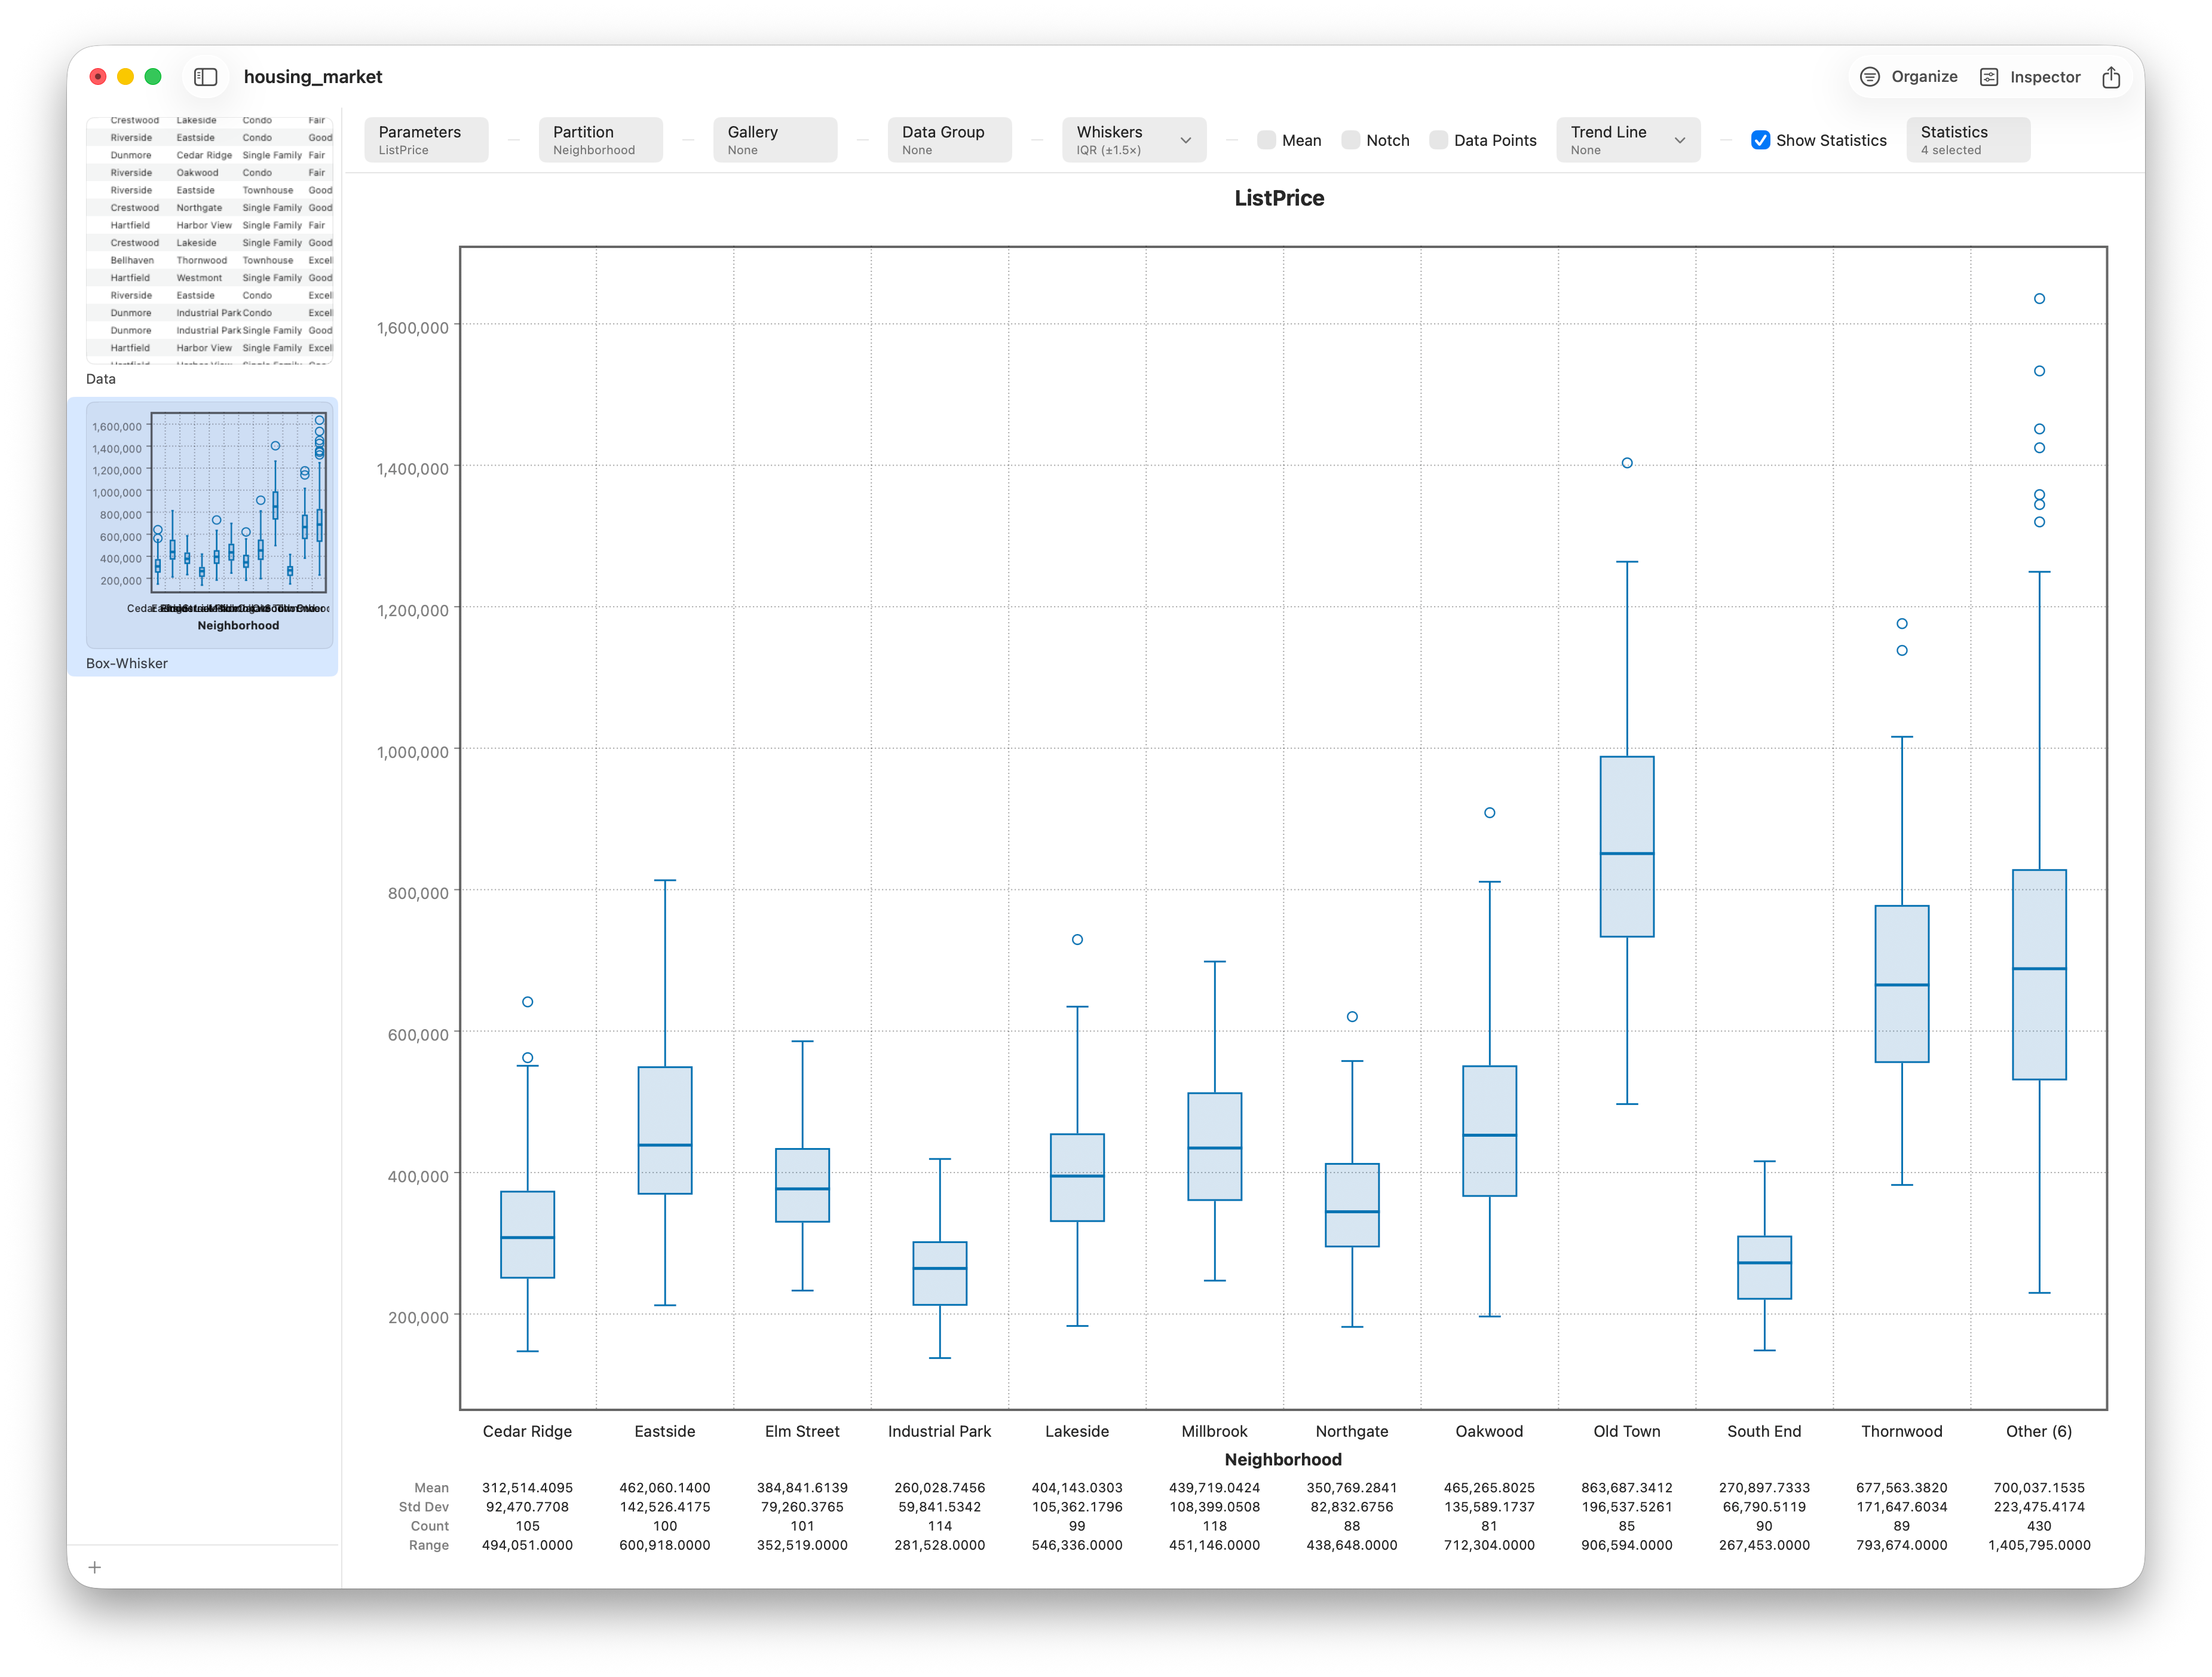
Compare groups and spot outliers with a box-and-whisker plot — in under a minute.
Jul 3, 2026 · 7 min read Stratum